RISK PERCEPTIONS OF INSTRUCTOR AND CANDIDATE
PILOTS REGARDING HELICOPTER OPERATIONS
A Master’s Thesis
by
ALI AVCIOGLU
Department of Management
Bilkent University
Ankara
August 2002
RISK PERCEPTIONS OF INSTRUCTOR AND CANDIDATE
PILOTS REGARDING HELICOPTER OPERATIONS
The Institute of Economics and Social Sciences
of
Bilkent University
by
ALİ AVCIOĞLU
In Partial Fulfillment of the Requirements for the Degree
of
MASTER OF BUSINESS ADMINISTRATION
in
THE DEPARTMENT OF MANAGEMENT
BILKENT UNIVERSITY
Ankara
August 2002
I certify that I have read this thesis and that in my opinion it is fully adequate, in scope and in quality, as a thesis for the degree of Master of Business Administration.
---Assoc. Prof. Dilek Önkal-Atay
I certify that I have read this thesis and that in my opinion it is fully adequate, in scope and in quality, as a thesis for the degree of Master of Business Administration.
---Assoc. Prof. Yavuz Günalay
I certify that I have read this thesis and that in my opinion it is fully adequate, in scope and in quality, as a thesis for the degree of Master of Business Administration.
---Assoc. Prof. Abdülkadir Varoğlu
Approved for the Graduate School of Business Administration.
---Prof. Kürşat Aydoğan
ABSTRACT
RISK PERCEPTIONS OF INSTRUCTOR AND CANDIDATE
PILOTS REGARDING HELICOPTER OPERATIONS
Avcıoğlu, Ali
M.B.A., Department of Management Supervisor: Assoc. Prof. Dilek Önkal-Atay
August 2002
This thesis investigates risk perceptions of instructor and candidate pilots. Incidents and flight scenarios concerning helicopter operations were given to participants to explore differences in risk perceptions. In contrast to the majority of earlier studies, the present study concludes that experts and nonexperts do not vary much in their evaluation of the riskiness. In addition, experienced pilots are more prone to take risks voluntarily than inexperienced pilots. Findings are discussed and limitations of current study are provided.
ÖZET
ÖĞRETMEN PİLOTLARIN VE PİLOT ADAYLARININ
HELİKOPTER OPERASYONLARIYLA İLGİLİ
RİSK ALGILAMALARI
Ali AVCIOĞLU
YÜKSEK LİSANS TEZİ, İŞLETME FAKÜLTESİ Tez Danışmanı: Doç. Dr. Dilek Önkal-Atay
Ağustos, 2002
Bu tez, öğretmen pilotlarla pilot adaylarının risk algılamalarını araştırmaktadır. Risk algılamasındaki farklılıkları tespit etmek maksadıyla, ankete katılanlara helikopter operasyonları ile ilgili olaylar ve uçuş senaryoları verilmiştir. Daha önceki birçok çalışmanın aksine, bu çalışmada uzmanların ve uzman olmayanların risk algılamalarında çok farklılık göstermedikleri sonucuna varılmıştır. Ancak, belirli koşullar altında uzman pilotların uzman olmayanlara oranla daha çok risk alma eğiliminde oldukları gözlenmiştir. Çalışmanın neticeleri ve kısıtlamalar tezde sunulmuştur.
ACKNOWLEDGEMENTS
I am very grateful to Assoc. Prof. Dilek Önkal-Atay for her supervision, constructive comments, and patience throughout the study. I also wish to express my thanks to Colonel Abdülkadir Varoğlu and Assoc. Prof. Yavuz Günalay for showing keen interest to the subject.
For their patience, I would like to express my deepest gratitude and dedicate this thesis to my wife, Ebru and my daughter, Yağmur.
TABLE OF CONTENTS
LIST OF TABLES...……... viii
LIST OF FIGURES...……... x
I. INTRODUCTION...……... 1
II. RISK AND RISK PERCEPTION...……... 7
2.1 Perception of Risk...……... 9
2.1.1 Revealed Preference...……... 10
2.1.2 Psychometric Approach...……... 12
2.1.3 Cultural Theory...……... 15
2.2 Heuristics and Biases...……... 17
2.2.1 Availability...….… 18
2.2.2 Anchoring and Adjustment...……. 19
2.2.3 Representativeness...……. 21
III.
EXPERT vs. LAYPEOPLE COMPARISONS...…….. 253.1 Study of Kraus et al. (1991)...…….. 28
3.2 Study of Barke et al. (1993)...……... 29
3.3 Study of Flynn et al. (1993)...…….... 30
3.4 Study of McDaniels et al. (1997)...……... 35
3.5 Study of Wright et al. (2000)...…….... 37
IV. METHODOLOGY...…….... 43
4.1 Participants...……... 43
4.2 Procedure...……... 44
V. RESULTS...…….... 48
5.1 Overall Riskiness of Incidents...……... 48
5.2 Evaluation of Risk Characteristics...……....51
5.2.1 Tail Rotor Shaft Breakage...……….. 51
5.2.2 Main Rotor Blade Failures...……... 53
5.2.3 Transmission System Failures...……... 54
5.2.4 Hydraulic System Failures...……... 56
5.2.5 Electric System Failures...…….. 57
5.2.6 Wire/Water/Ground Contact at Nap-of-the-earth (NOE)…….... 59
5.2.7 Power Loss...……... 61
5.2.8 Power Drop...……... 63
5.2.9 Loss of Tail Rotor Thrust...……... 65
5.2.10 Accidents due to Excessive Usage in Hover/Taxi...…….... 67
5.2.11 Spatial Disorientation (SD)...…….... 69
5.2.12 Lightning Strike...…….... 71
5.2.13 Birdstrikes...……... 73
5.3 Risk-taking vs Risk-avoiding...……... 74
VI. CONCLUSION...……...…. 81
6.1 Conclusions and Recommendations...……... 81
6.2 Limitations of Current Study...……... 83
LIST OF TABLES
TABLE 1 : Opinions About Issues Related to the HLNW
Repository Program...……..…... 32
TABLE 2 : Likelihood Evaluation of Health and Benefit Items Related to the HLNW Repository Program...……...… 34
TABLE 3 : The Sixteen Questions Asked for Each of the Scenarios……...38
TABLE 4 : 25 Hazardous Activities Asked for Risk Rating...…..…...41
TABLE 5 : Thirteen Incidents Given to Participants...………...45
TABLE 6 : T-test Results for Overall Riskiness of Thirteen Incidents…...48
TABLE 7 : Mann-Whitney Test Results for Tail Rotor Shaft Breakage……. 51
TABLE 8 : Mann-Whitney Test Results for Main Rotor Blade Failures…….53
TABLE 9 : Mann-Whitney Test Results for Transmission System Failures...……...55
TABLE 10 : Mann-Whitney Test Results for Hydraulic System Failures……. 56
TABLE 11 : Mann-Whitney Test Results for Electric System Failures……….58
TABLE 12 : Mann-Whitney Test Results for Wire/Water/Ground Contact at Nap-of-the-earth (NOE)...……... 60
TABLE 13 : Mann-Whitney Test Results for Power Loss...……... 62
TABLE 14 : Mann-Whitney Test Results for Power Drop...……... 63
TABLE 17: Mann-Whitney Test Results for Spatial Disorientation...……... 70 TABLE 18: Mann-Whitney Test Results for Lightning Strike...……... 72 TABLE 19: Mann-Whitney Test Results for Birdstrikes...……... 73
LIST OF FIGURES
FIGURE 1: Main Generator Failure Assessment of Lay Sample..……... 75
FIGURE 2: Main Generator Failure Assessment of Expert Sample……... 76
FIGURE 3: Limit Assessment of Lay Sample...……...…... 77
FIGURE 4: Limit Assessment of Expert Sample...……... 77
FIGURE 5: NOE Flight Assessment of Lay Sample...……... 78
FIGURE 6: NOE Flight Assessment of Expert Sample...……... 78
FIGURE 7: Meteorological Risk Assessment of Lay Sample………... 79
FIGURE 8: Meteorological Risk Assessment of Expert Sample...……. 79
FIGURE 9: Formation Flight Risk Assessment of Lay Sample...……. 80
CHAPTER I
INTRODUCTION
Most psychological studies on risk are directed finding factors that may potentially affect risk perception. There are three basic approaches studying risk perception. These are revealed preference approach, psychometric approach, and cultural theory. Revealed preference approach claims that, by trial and error, society arrives at an essentially optimum balance between the risks and benefits. Revealed preference considers that present risk level in the society is acceptable, because we are tolerating it. This method provided a driving force for later research in this area.
The assumption of revealed preference that past behaviour is a good indicator of present behaviours was criticized, and deficiencies of revealed preference approach have motivated researchers to conduct studies using questionnaires to measure the
preferences for a range of hazards. Studies showed that perceived risk is quantifiable and predictable; and that people tend to view current risk levels as unacceptably high for the activities given in studies. Researchers use factor analysis method to study risk perception and claim that public risk perception has two dimensions: dread risks and unknown risks. Dread risks are the ones whose severity is believed to be uncontrollable. Catastrophic, hard to prevent, fatal, inequitable, threatening to future generations are some characteristics of the risk labelled as dread. Unknown risks are hazards unobservable by the public. Observability, knowledge, familiarity are some characteristics of the risk labelled as unknown.
Another major attempt to explain risk perception is the “cultural theory” that tries to link risk perception with social and institutional arrangements, unlike the psychometric perspective. The claim of the cultural theory is that individuals’ attitudes toward risk and danger are heterogeneous and may vary according to cultural biases. Douglas explains risk perception with reference to grid-group theory (Douglas, 1978, cf Wilkinson 2001). According to theory, people are categorized into four cultural groups: hierarchists, egalitarians, fatalists, and individualists. Hierarchists like organized society and worry about risks that affect authority and social order. Egalitarians prefer a world in which power and wealth are more evenly distributed. Fatalists are prone to think that what happens in life is predetermined and cannot be changed. Individualists are worried about factors that could threat the markets such as war and recession.
It is argued that people use some heuristics to cope with risky situations. Commonly used heuristics are availability, anchoring and adjustment, and representativeness. According to availability heuristic, one’s judgement about the relative frequency of an event usually depends on the degree to which it is remembered. Easily imagined are judged to be more probable. It is a lot easier to think of words which start with the letter K than of words where K is in the third position. However, a typical selection of text contains twice as many words in which K is in the third position than words which start with K. In anchoring and adjustment process, people make judgments by starting at an initial value (anchor) and later adjust it to reach a final value as a decision. According to representativeness, The subjective probability of an event is determined by the degree to which it is similar in essential characteristics to its parent population and it reflects the outstanding features of the process by which it is generated.
The focus of present study is the perception of risk by experts and non-experts. Considerable amount of research has been conducted so far to elicit the differences of risk perception between experts and laypeople. Kraus et al. (1991) surveyed toxicologists and laypeople to demonstrate discrepancies between these groups with regard to risk perception in chemicals and concluded that experts and laypeople differed in risk perception. Laypeople had negative attitudes toward chemicals but positive attitudes and perceptions toward prescription drugs. Flynn et al. (1993) also examined the differences of risk perception between experts and laypeople
remarkable differences exist between experts and laypeople regarding the perception of radioactive waste risks. According to this study, experts perceive these risks as lower than public.
By contrast, some studies shows that discrepancies between experts and lay sample are minor; moreover, Wright et al. (2000) express that “experts can rate some risks as equal to, or even greater than, ratings given by members of the general public” (p. 682). Wright et al. (2000) investigated on expert and laypeople perceptions concerning the U.K. oil and gas industry and showed that experts and laypeople shared more similarities. Experts were also sensitive to risky situations, and they did not judge the events as less risky than laypeople. Another example is the study of McDaniels et al. (1997) concerning ecological risk to water environments. They found that in 22 of 33 given hazards, there were no significant differences between expert and lay samples with regard to risk assessments.
Our study investigates differences in perceptions of experts and non-experts toward risky events in Army Aviation concerning helicopter flights. Aviation history is full of accidents and tragic losses. Since the late 1950s, the drive to reduce the accident rate has yielded safety level to a point where it is now safer to fly than to drive a car. Still, while the aviation accident rate has declined, the cost of aviation accidents in both lives and money has steadily risen. As a result, the effort to reduce the accident rate has assumed an increased importance within both military and civilian aviation.
In the early years of aviation, it could reasonably be said that the aircraft killed the pilot. That is, the aircraft were mechanically unsafe. However, the modern era of aviation has witnessed the reversal of the situation. In the latest generation of helicopters, technology has placed in our hands very capable machines. It now appears that the aircrew themselves are more deadly than the aircraft they fly. In fact, studies indicate that between 70 and 80 percent of aviation accidents can be attributed to human error (O'Hare, 2002).
Current study investigates similarities and differences between expert and non-experts. Instructor pilots of Aviation School are used as the expert sample and candidate pilots with flight experience of less than 100 hours constitute the non-expert sample. Since all the questions in the questionnaire are related to aviation, there is a high match between experts and risk domain. One major difference of our study from earlier ones is that our non-expert sample is also familiar with the risk domain. In previous studies, novice sample is generally formed from public, whereas our non-expert sample also has flight experience and this provided us to reach better and reliable results.
Accordingly, this thesis is organized as follows: A review of literature on risk perception, including revealed preference approach, psychometric approach, cultural theory, and heuristics and biases is given in Chapter 2. To explore differences in risk perceptions of experts and non-experts, previous research is
Chapter 5 covers the results of the study. Finally, Chapter 6 covers the conclusions of current work.
CHAPTER 2
RISK AND RISK PERCEPTION
Understanding the concept of risk first requires an understanding of a hazard. Hohenemser et al. (1983) describe hazards as “threats to humans and what they value, whereas risks are quantitative measures of hazard consequences that can be expressed as conditional probabilities of experiencing harm” (p.379). Hall and Crawford (1992) define hazard as an "activity or phenomenon that poses potential harm or other undesirable consequences to people or things" (p.78). In short, the magnitude of a hazard is the amount of harm and the severity of consequences resulting from that hazard.
As Ayton and Hardman (1996) have expressed “all of us are confronted by risks; we all take risks whether we like it or not” (p. 168). Since risk is about future events, it cannot be sensed. It can only be imagined or analyzed (Sjöberg, 2000a). Can this inescapable fact of life, risk, be defined? Defining the concept of risk has
Singleton and Hovden, 1994). Currently, there is no generally accepted definition of risk. Vlek and Keren (1991, cf Pidgeon et al. 1992, p. 94) list ten different formal definitions, which are quite common in the literature, and these definitions are listed below:
1. Probability of undesired consequences
2. Seriousness of (maximum) possible undesired consequences
3. Multi-attribute weighted sum of components of possible undesired consequences
4. (Probability) ∗ (seriousness of undesired consequences ‘expected loss’)
5. Probability weighted sum of all possible undesired consequences (average ‘expected loss’)
6. Fitted function through graph of points relating probability to extent of undesired consequences
7. Semivariance of possible undesired consequences about their average 8. Variance of all possible consequences about mean expected
consequences
9. Weighted combination of various parameters of the probability distribution of all possible consequences
10. Weight of possible undesired consequences (‘loss’) relative to comparable possible desired consequences (‘gain’)
The abundance of risk definitions is only one of the problems. Furthermore, all of those definitions refer only to abstract terms such as probability and loss.
Accordingly, Doderlein (1982; cf Singleton and Hovden, 1994) suggest that we do not spend time arguing about definitions without reference to their practical usefulness. Most psychological studies on risk are directed to find factors that are affecting risk judgments. Singleton and Hovden (1994) conclude “it is progress if useful ways of exploring risk can be clarified without describing the topic itself” (p.4).
2.1 Perception of Risk
“Risk perception involves people’s beliefs, attitudes, judgments, and feelings, as well as the wider social or cultural values and dispositions that people adopt, toward hazards and their benefits” (Pidgeon et al. 1992, p.89). Slovic (1987) expresses that “... technologically sophisticated analysts employ risk assessment to evaluate hazards, the majority of citizens rely on intuitive risk judgments, typically called risk perceptions” (p.280). Slovic informs us that in 1970s few researchers attempted to work on risk perception studies, but later they began to seek what risk means for people and what factors affect perceptions of people.
It is argued that geography, sociology, political science, anthropology, and psychology made valuable contributions to the risk perception approach (Slovic, 1987). According to Slovic, geographical research concentrated on understanding
cultural factors deeply affect perception and acceptance of risk; psychological studies helped us understand relationships between risk decisions and heuristics and mental strategies that people use to assess the events; and the mediator effects of social influences on risk decisions were discovered by studies on political science. There are three basic approaches to study risk perception. These are revealed preference approach, psychometric approach, and cultural theory.
2.1.1 Revealed Preference
One of the approaches to determining the acceptable risks, for any given product, technology, etc is the revealed preference method. This method attempted to find an answer to the question of “How safe is safe enough?”. Slovic (2000) states that the revealed preferences approach assumes that “by trial and error, society arrives at an essentially optimum balance between the risks and benefits associated with any activity” (p.125). According to revealed preferences approach, people use historical and current risk data to reach a balance between risks and benefits.
Starr defends the usefulness of this method, and tries to elicit the relationship between risks and benefits via a number of studies and concluded that acceptability of risk from an activity is roughly proportional to the third power of the benefits for that activity. Also, the public will tolerate more risks from voluntary activities
(such as smoking, swimming, hunting) than involuntary activities (i.e. electric power, motor vehicles), roughly 1000 times, that provide the same level of benefits (Slovic, 2000).
Lichtenstein et al. (1978; cf Slovic, 2000) replicated Starr’s studies in expanded form. Although there were some procedural differences, but they also produced results similar to Starr’s. Both found that there was a positive relation between benefits and risks. Starr had tried to demonstrate that people are prone to be riskier in voluntary activities compared to involuntary activities. Lichtenstein et al. also arrived the same results.
Despite the results of these studies, revealed preference method has several negative aspects. First of all, this method assumes that past preferences are good predictors of present and future preferences. It assumes that people have full information and can use it optimally during decision-making process. As a final point, it is argued that (Slovic, 2000) “from a technical standpoint, it is no simple matter to develop the measures of risks and benefits needed for the implementation of this approach.” (p.128).
2.1.2 Psychometric Approach
Deficiencies of Starr’s approach motivated Decision Research group to conduct a study using questionnaires to measure the people’s attitudes toward risks. According to Sjöberg (2000b), the first such study was launched in 1978 by Fischhoff et al. (1978). The term psychometric derives from the methodology conducted to assess the risk perception of individuals (Module Handbook of Caledonian University, 2001). In psychometric studies, respondents are asked to express their preferences for a range of hazards. In the first study (Fischhoff et al., 1978), respondents were asked to evaluate 30 activities and technologies with regard to perceived risk, perceived benefit, the acceptability of its current risk level, and were asked to rate each activity depending on nine dimensions of risk.
Slovic (2000) explains the reasons that motivated the group to use such method as: the capability of extracting current preferences instead of depending on historical data; being able to consider many aspects of risks; and ease of using statistical methods. More extensive studies, both in terms of scales and the number of participants, followed this initial work. One such study (Slovic, 2000) was the one performed by Slovic et al. with 90 hazards and 18 risk characteristics.
Slovic (1987) has identified two distinct types of public concern associated with risks: concerns about the unknown, and dread. Unknown risks are hazards unobservable by the public. Slovic (2000) labeled observability, knowledge,
immediacy of consequences, and familiarity characteristics of the risk as unknown. According to Slovic (2000), dread risks are the ones “whose severity is believed to be uncontrollable tend also to be seen as dread, catastrophic, hard to prevent, fatal, inequitable, threatening to future generations, not easily reduced, increasing, involuntary” (p.141). Nuclear power or nuclear weapons are examples of dread risks. Also for dread risk, (Slovic, 2000) the "higher its perceived risk, the more people want to see its current risks reduced, and the more they want to see strict regulation employed to achieve the desired reduction in risk" (p. 226).
Studies on expressed preferences showed that perceived risk is quantifiable and predictable (Slovic, 1987). Also studies elicited the point that people tend to view current risk levels as unacceptably high for the activities given in studies. Another interesting outcome of the research is that people differ in terms of definitions of risk concept. Laypeople can make good estimates for annual fatalities, but their judgment mainly depends on different characteristics such as threat to future generations, dread, catastrophic potential, etc. On the other hand, experts generally correlate riskiness with expected annual mortality and they are influenced less by the qualitative characteristics when compared to lay people’s judgment (Slovic, 2000). For example, nuclear risk seems extremely high for lay people due to its catastrophic potential, whereas it seems less risky to experts because the number of deaths resulting from nuclear activities is relatively low up to now.
Although psychometric approach has provided groundwork for the following studies, it has also been criticized and some authors have claimed that this model is not very powerful. Several critiques against the psychometric model can be given: 1. Participants are not allowed to explain freely their ideas about the hazards in the
questionnaire. Because they have to assess according to scales given by the researcher. Actually, this drawback is common to most psychometric methods. So, outcomes of the research are influenced by the initial idea of the researchers (Module Handbook of Caledonian University, 2001). In fact, open-ended research technique can be used to eliminate the boundary, but this time extra levels of interpretation is needed to analyze data (Pidgeon et al. 1992, p. 106). 2. Factor analysis method does not yield differences between individuals (Pidgeon
et al. 1992, p. 106).
3. It has been criticized for using relatively small samples (Module Handbook of Caledonian University, 2001). However, subsequent studies tried to address these criticisms and combined qualitative and quantitative methods.
4. Sjöberg (2000) criticized the model that since the authors analyzed only mean ratings instead of raw data, model was capable of explaining perceived risk by the factors present in studies and claimed “individual ratings should be of primary interest” (p.4).
Comparisons of using aggregate data or individual data is examined my Marris et al (1997). They concluded that individuals vary in perception of the same risk, and some strong correlations observed between risk characteristics are not so
powerful when the data analyzed at individual level. But they also concluded that although aggregate analysis may overstate some correlations between risk characteristics, psychometric model is still reflecting the average of individual responses and concluded that many of the qualitative characteristics proposed by the psychometric model are closely associated with risk perceptions and model is an effective method for analyzing risk perception.
2.1.3 Cultural Theory
One of the major attempts explaining risk perception is cultural theory. Initial study that tried to link risk perception with social and institutional arrangements, rather than psychometric perspective, was introduced by the work of Douglas (1966) and Thompson (1980) (cf. Pidgeon et al. 1992). But according to Sjöberg (2000), cultural theory gained widespread attention mainly with the publication of Douglas and Wildavsky`s ‘Risk and Culture’ (1982). The claim of the cultural theory is that human attitudes toward risk and danger are heterogeneous and vary according to cultural biases. An individual’s cultural bias is linked with the so-called grid and group. Grid refers to the norms and rules. On the other hand, the concept of group refers to the extent to which person becomes incorporated into relationships with others. By linking grid and group, four types of people are specified: hierarchists, egalitarians, fatalists, and individualists. Thus, each group
1. Hierarchists: Individuals who have a strong involvement (high group) and follow the norms and rules (high grid) are called hierarchists. Hierarchists like organized society and worry about risks that affect authority and social order. 2. Egalitarians: Individuals who have a strong involvement (high group) but score
low in grid scale (low grid) are called egalitarians. They prefer a world in which power and wealth are more evenly distributed (Slovic, 2000).
3. Fatalists: Individuals who score low in group scale (low group) and score high in grid scale (high grid) are called fatalists. Fatalists are prone to think that what happens in life is predetermined and cannot be changed.
4. Individualists: Individuals who score low in group scale (low group) and score low in grid scale (low grid) are called individualists. They are autonomous and like to control their own life. They rely on individual skills and abilities. Therefore, they are worried about factors that could threat the markets such as war and recession (Sjöberg, 2000).
There have been some critics for this approach. Johnson (1987; cf Pidgeon et al. 1992, p. 113) claims that classifying people into four types may oversimplify social differences present in the society. Also Bellaby (1990; cf Pidgeon et al. 1992, p. 113) and Pidgeon (1996; cf Module Handbook of Caledonian University, 2001) argue that the cultural theory is not considering changes in worldviews overtime, and it undervalues dynamic aspects of social life. Individuals might shift from one type to another.
One of the criticisms of this approach is that there exists little empirical evidence to support the approach. Although, a quantitative study has been performed by Dake (1991; cf Sjöberg, 2000) and a qualitative study has been performed by Rayner (1986; cf Pidgeon et al. 1992, p. 113) to analyze cultural theory, it is argued that these studies are not sufficient (Sjöberg, 2000). Sjöberg (2000) claims that cultural theory is less successful than psychometric model and less than 20% of variance of risk perception can be explained by this theory. Despite criticisms, the cultural theory has made substantial contributions to risk perception research and has provided different aspects of risk and tolerance.
2.2 Heuristics and Biases
The ability to interpret risks is limited by some factors. When people are confronted with complex tasks, they violate rational decision-making processes and use heuristics to simplify the tasks. Especially lay people, since they generally have little statistical information on hand to contribute the decision making process, cope with risk tasks by using heuristics. Although heuristics are valid in some situations, in others, they may cause biases and lead to serious conclusions (Slovic, 2000). The three best-known heuristics are availability, anchoring and adjustment, and representativeness.
2.2.1 Availability
It is argued that availability heuristic is one of the most important heuristics for understanding risk perception (Kahneman et al, 1982). The availability heuristic suggests that an event is supposed to occur frequently as it is recalled or imagined easier. Actually, in our daily life, we remember the events that occur frequently. For instance, the judgment that probability of being in a traffic accident in the city is relatively high when compared to flood, because everyday an accident occurs in our city. Therefore availability is normal and often suitable and works well to assess the probability in many situations. However, in some circumstances using availability heuristic might cause serious errors in decision-making. Since factors, not related to frequency (such as recency, familiarity, and emotional saliency), can affect the availability and may cause biases (Slovic, 2000).
Lichtenstein et al. (1978) performed an experiment to study the availability heuristic. In the study, participants were told to judge the frequency of 41 causes of death, including cancer, asthma, accidents, diabetes, and excess cold. Only the total number of annual death for motor vehicle accident in U.S. was given (50,000) and they were asked to judge the frequency of 40 remaining causes. In a paper (Slovic et al, 1981), authors concluded that, “in general, rare causes of death were overestimated and common causes of death were underestimated” (p.18). For instance, homicides were judged to cause more deaths than diabetes, whereas diabetes actually causes more deaths.
Another bias introduced by the studies (Sjöberg, 2000b) is risk denial. There is a propensity among people to view themselves as immune to many hazards. People make different estimates when they rate the risk to themselves and to others. For example, Sjöberg (1994; cf Sjöberg, 2000b) conducted a study with a sample of the Swedish population where the respondents were asked to rate the risks (including alcohol, smoking, pollution, accident, etc.) on a scale from 0 (no risk at all) to 6 (extremely risky). Extreme differences were seen for risk ratings between general risk and personal risk (Sjöberg, 2000b). People think that they are less subjected to risk than others. For example, most of the drivers believe that they are better than average drivers. Slovic et al. (1981) claims that risk denial is one of the reasons why people “refuse to take protective actions such as wearing seat belts” (p.20).
2.2.2 Anchoring and Adjustment
Another heuristic that is used in information processing is anchoring and adjustment. In this process, people make judgments by starting at an initial value (anchor) and later adjust it to reach a final value as a decision. Slovic (2000) states, “…a natural starting point or anchor is used as a first approximation to the judgment. This anchor is then often adjusted to accommodate the implications of additional information” (p.38).
Authors suggest that this heuristic is insufficient to make predictions and sometimes, if not generally, lead to wrong results. The works of Tversky and Kahneman (1974; cf Module Handbook of Caledonian University, 2001) and Lichtenstein and Slovic (1971; cf Slovic, 2000) tried to provide evidence for insufficiency of anchoring heuristic, and succeeded it. Lichtenstein and Slovic used two pairs of gambles in experiment:
Bet A: 11/12 chance to win 12 chips 1/12 chance to lose 24 chips Bet B: 2/12 chance to win 79 chips 10/12 chance to lose 5 chips
Participants were asked to make a choice between A and B. Later they were asked to set a selling price for the ticket to play each bet if they had the ticket. Results were challenging. Although both alternatives were almost chosen equally, bet B received a higher selling price. In fact 87% of the subjects who chose bet A, stated a higher price for bet B.
Lichtenstein and Slovic concluded that participants used different decision-making processes when choosing the bet and setting a price for the ticket. According to authors, participants justified the choice of A in terms of good odds, but they set a higher price for B by using its high-return probability as an anchor.
2.2.3 Representativeness
The last heuristic that will be mentioned in our study is representativeness. According to Kahneman et al. (1982) “ a man who follows this heuristic evaluates the probability of an event, or a sample, by the degree to which it is: (i) similar in essential properties to its parent population; and (ii) reflects the salient features of the process by which it is generated.” (p.33).
Representativeness approach leads to some biases. One of them is insensitivity to prior probability. To investigate this, Kahneman et al. (1982) made an experiment. They wrote descriptions of 70 lawyers and 30 engineers by using interviews and personality tests. After having 100 personality descriptions, a group of 85 participants was formed and five descriptions were given to each of participants. Before the test, participants were informed about the ratio of lawyers and engineers (.7/.3). One of the personality descriptions was the following: “Dick is a 30 year old man. He is married with no children. A man of high ability and high motivation, he promises to be quite successful in his field. He is well liked by his colleagues.” Next, participants evaluated the probability of Dick being a lawyer on a scale between 0 and 100. Authors expected that the probability given by the subjects would equal to the proportion of lawyers in the descriptions (.7). But, participants evaluated the probability of Dick being a lawyer as .5, contradictory to real ratio.
People also think that small samples represent the population, regardless of the sample size. This bias is called insensitivity to sample size. In fact variations in sample size mean variations in statistical power. As the size of sample decreases statistical power of the sample decreases. Kahneman and Tversky (1972; cf Kahneman et al, 1982,p.6) studied the role of sample size, and gave the following example in the book:
A certain town is served by two hospitals. In the larger hospital about 45 babies are born each day, and in the smaller hospital about 15 babies are born each day. As you know, about 50 percent of all babies are boys. However, the exact percentage varies from day to day. Sometimes it may be higher than 50 percent, sometimes lower.
For a period of 1 year, each hospital recorded the days on which more than 60 percent of the babies born were boys. Which hospital do you think recorded more such days?
a. The larger hospital (21) b. The smaller hospital (21) c. About the same (53)
Kahneman and Tversky concluded that participants thought the events equally representative of the population. Actually, since the probability of deviation from 50 percent was less in large hospital, participants should have chosen small hospital. But numbers in parenthesis show that participants evaluated both small and large hospitals as equal.
Another bias resulting from representativeness is misconceptions of chance. In tosses of a coin, people generally evaluated the order H-T-H-T-T-H to be more likely than H-H-H-T-T-T in the studies of Kahneman et al. (1982). People expect that even in small experiment, like in tosses of a coin for six times, fairness of the coin will be seen.
One other bias is conjunction fallacy. To illustrate this, Kahneman et al. (1982, p.92) made the following experiment:
Bill is 34 years old. He is intelligent, but unimaginative, compulsive, and generally lifeless. In school, he was strong in mathematics but weak in social studies and humanities.
Please rank order the following statements by their probability, using 1 for the most probable and 8 for the least probable.
1. Bill is a physician who plays poker for a hobby. 2. Bill is an architect.
3. Bill is an account.
4. Bill plays jazz for a hobby. 5. Bill surfs for a hobby. 6. Bill is a reporter.
7. Bill is an accountant who plays jazz for a hobby. 8. Bill climbs mountains for a hobby.
They found that 87 percent of the 88 participants chose compound target, ‘an accountant who plays jazz for a hobby’. In fact, the description was representative of an accountant, and unrepresentative of a jazz player. As a result, Kahneman et al. (1982) concluded “…the reliance on the representativeness heuristic led the respondents to regard a conjunctive event as more probable than one of its components, contrary to the conjunction rule of probability theory” (p.91).
CHAPTER 3
EXPERT vs. LAYPEOPLE COMPARISONS
Considerable amount of research has been conducted to elicit the differences of risk perception between experts and laypeople, and some researchers concluded that laypeople perceive risk different than experts. Some conclusions are as follows:
Even when experts and lay people have the same goals, they may be solving different problems…other apparent differences of opinion between lay people and technical people may be traced to differences in semantics. (Fischhoff et al.1982, p. 248)
We found a substantial difference between the public and the ANS group with regard to perceptions of risk from a high-level radioactive waste depository program. (Flynn et al.1993, p. 646)
When experts judge risk, their responses correlate highly with technical estimates of annual fatalities. Laypeople can assess annual fatalities if they are asked to (and produce estimates somewhat like the technical estimates). However, their judgments of ‘risk’ are related more to other hazard characteristics…and, as a result, tend to differ from their own (and experts’) estimates of annual fatalities. (Slovic, 2000, p.223)
Since position in a job environment or seniority does not mean expertise, before trying to find the differences between experts and laypeople, we should first focus on whether experts are real experts. Bolger and Wright (1994) proposed that two factors determine expertise: ecological validity and learnability. Bolger and Wright (1994) define ecological validity as “the degree to which the expert is experienced at making the type of judgment asked for by the researchers” (p. 19). Authors also described learnability (Bolger and Wright, 1994) as “the extent to which it is possible to master decision making and judgment in the task domain under investigation, specifically by making use of feedback to refine reliable domain models as a basis for subsequent judgment” (p. 20).
Authors concluded that the quality of expert judgment mainly depends on these two factors. Both ecological validity and learnability should be high to get a high performance. They also expressed that some other factors, such as difficulty, measurement type and power of tests, also affect the judgmental performance of experts. These factors are given below:
1. Task Difficulty: Authors claim that difficulty affects the judgment and give pet show example. For example, “ an expert pet show judge should have no problems discriminating between cats and dogs but might make mistakes distinguishing between different breeds of cat or dog” (Bolger and Wright, 1994, p.16)
2. Measurement Type: Reliability and validity are commonly used measurement types. According to Bolger and Wright (1994), “...reliability is a necessary, but not sufficient, prerequisite for validity. For example, a ruler which changes length between each measurement is unreliable and consequently its readings must be invalid. However a ruler that consistently measures too short will be reliable but...invalid” (p.16). Authors conclude that reliable measure is more convenient to get a good performance.
3. Power of Tests: “Power refers to the probability of detecting an effect at an acceptable significance level” (p.16). Sample size and test sensitivity affect the power.
Researchers dealing with expert-lay differences should focus on the points explained above. Because if the expert part of the study fails, it might lead to wrong results for the whole study. Many studies have been conducted about the topic. There are some discrepancies between the conclusions of these studies. Here we want to examine and give brief information about six studies to supply a background for expert-lay differences.
3.1 Study of Kraus et al. (1991)
Kraus et al. (1991)surveyed toxicologists and laypeople to demonstrate discrepancies between these groups with regard to risk perception in chemicals. They wanted to draw out which factors were causing differences between experts and laypeople. To accomplish that, they developed a questionnaire addressing the four categories: dose-response sensitivity, trust in animal and bacterial studies, attitudes toward chemicals, and attitudes toward reducing chemical risks. In each category respondents faced several questions, and they evaluated questions on 4-point scale (strongly disagree, disagree, agree, strongly agree).
360 questionnaires were mailed to members of the Society of Toxicology (SOT), and 170 of them were returned (53 in academic subgroup, 58 in regulatory subgroup, and 59 in industrial subgroup). 91 percent of the respondents had Ph.D. degree and 2,4 percent and M.D. degree. Also 84,6 percent of the respondents were male. Lay sample was selected from the citizens of Portland, Oregon with the minimum annual income of $20,000. 27 percent of mailed questionnaires were returned, thus 262 people formed the lay sample. These individuals were well educated and had high income.
At the end of the research, it was concluded (Kraus et al, 1991)that in dose-response sensitivity category, laypeople agreed more with the statement that “if you are exposed to a toxic chemical substance, then you are likely to suffer adverse
health effects” and “if you are exposed to carcinogen, then you are likely to get cancer”(p. 217). Two groups made different judgments in this category.
Results of the third and fourth category also drew out parallel results to category 1. There were substantial differences between groups. Only in the second category, trust in animal and bacterial studies, responses of both experts and laypeople resembled. They differed only in one question that “if a scientific study produces evidence that a chemical causes cancer in animals, then we can be reasonably sure that the chemical will cause cancer in humans” (p.225).
Kraus et al. concluded that experts and laypeople differed in risk perception. Laypeople had negative attitudes toward chemicals but positive attitudes and perceptions toward prescription drugs. Also “... lack of difference between the public and toxicologists with regard to their confidence in extrapolation from animal studies” (p.228) surprised the researchers.
3.2 Study of Barke et al. (1993)
Barke et al. (1993) concentrated on exploring nuclear waste process and differences among experts and laypeople in risk perception on this issue. Expert sample consisted of 1011 scientists (members of the biology, chemistry,
Association for the Advancement of Science). Lay sample consisted of public sample and Sierra Club members. Public sample was obtained from Colorado and New Mexico via telephone survey- for a total of 1153 individuals. Sierra Club members were formed using a mail survey, totally 1506 members.
Knowledge of ionizing radiation, risk perception of potential hazards concerning nuclear waste, political and demographic attitudes were some of the 70 items tested in the questionnaire. Actually, since the main focus of the research was to draw out variability of expert perceptions, they generally concentrated on why each expert group (i.e. biologists, engineers, physicians) differed in attitudes and behaviors for risk acceptance. But it was also found that experts perceived less risk than remaining two groups (public and Sierra Club members), and concluded that there were significant differences between experts and laypeople in nuclear waste risk perception.
3.3 Study of Flynn et al. (1993)
Flynn et al’s (1993) study also tried to find the differences of risk perception between experts and laypeople with regard to high-level nuclear waste repository. A questionnaire was prepared and distributed to 60 professional people joining a meeting American Nuclear Society (ANS) held in Augusto, Georgia. 40 of them completed and submitted the survey. These were the expert sample. Lay part of the
study came from public surveys conducted by telephone. The number of people who completed the survey was not given in the paper, but Rowe and Wright (2001) gives the number as 409.
The study consisted of three parts. In the first part, participants were asked to list three images or ideas that came to mind when they heard “underground nuclear waste repository”. The expert group produced 110 images; 31% negative, 20% neutral, 49% positive. The lay group produced 1200 images; 68% negative, 10% neutral, and 22% positive. Public images were generally negative such as danger, death, environmental damage. But images produced by experts were considerably different. They generally dealt with restrictions to building the repository, too much money, etc.
In the second part, the participants were asked to express their opinions on 5-point scales, ranging from strongly disagree to strongly agree, for the statements given in Table 1. Both expert and lay samples gave similar responses for the first statement and “ more than two thirds of each group somewhat agreed or strongly agreed that accidents will occur” (Flynn et al. 1993, p. 646). The responses to second statement which was concerning the safety for future generations revealed difference between experts and lay sample. 92.5 percent of ANS group agreed or strongly agreed that nuclear waste repositories can be made safe while only 50.4 percent of laypeople agreed or strongly agreed. Statement 3 displayed much large
was 79 in laypeople while it was only 32.5 in expert sample. Statements 4 and 5 drew out similar results with the previous statement that two groups differed greatly in perception. For Statement 6, once again, two groups gave different responses. 82 percent of experts agreed or strongly agreed that shipments of nuclear wastes can be made safe from sabotage, whereas the percentage in laypeople for the same responses was 35. The last statement was concerning the reliability of U.S. Department of Energy and 55 percent of experts agreed or strongly agreed with the statement while only 21 percent of laypeople agreed or strongly agreed.
Table 1: Opinions About Issues Related to the HLNW Repository Program
1. Highway and rail accidents will occur in transporting the wastes to the repository site
2. Nuclear waste repositories can be made safe so that future generations will not accidentally dig into the site looking for resources
3. A future earthquake, volcanic activity, or other natural phenomenon may cause release of nuclear wastes to the outside environment
4. The buried waste will be contained in the waste site so that contamination of underground water supplies will not occur
5. Accidents will occur in handling the materials during the burial operations and result in contamination of workers or radioactive releases into the air and ground
Table 1 (cont’d)
6. Shipments of nuclear wastes can be made safe from sabotage or attack by terrorists
7. The U.S. Department of Energy can be trusted to provide prompt and full disclosure of any accidents or serious problems with their nuclear-waste management programs
In the third part, participants were asked to evaluate the likelihood of outcomes related to high-level nuclear waste repository program on 10-point scale, ranging from 1 (not likely) to 10 (extremely likely), for the statements given in Table 2. Both experts and laypeople had similar ideas for Statement 1 and 5, but differences observed for Statements 2, 3, and 4. Contrast was stronger for the item that “ activities at the nation’s nuclear facilities will in the future cause health problems for those who live near such activities” (Flynn et al. 1993, p. 645). 8 percent of expert sample rated as highly likely while 55 percent of lay sample rated as highly likely.
Table 2: Likelihood Evaluation of Health and Benefit Items Related to the HLNW Repository Program
1. A high-level nuclear waste repository will create a significant number of new jobs in nearby local communities
2. How likely do you think it is that activities at the nation’s nuclear facilities have in the past caused health problems
3. How likely do you think it is that activities at the nation’s nuclear facilities will in the future cause health problems
4. A high-level nuclear waste repository will result in areas near nuclear waste facilities being labeled ‘Nuclear Dump’ areas
5. A high-level nuclear waste repository will greatly increase revenues to state and local governments
At the end of the study, the researchers concluded that remarkable differences exist between experts and laypeople regarding the perception of radioactive waste risks. It was also concluded that two groups had “similar opinions only on monetary issues unrelated to the special nuclear characteristics of a high-level nuclear waste (HLNW) repository” (Flynn et al. 1993, p. 646).
3.4 Study of McDaniels et al. (1997)
McDaniels et al. (1997) investigated the differences between expert and laypeople risk perception concerning the human activities that would be ecological risk to water environments. To accomplish this, they gave a questionnaire to participants. Lay sample of participants consisted of 183 people (120 women, 81 men) from three residential communities and students from the University of British Columbia. The number of students was 47. 16 experts working in aquatic sciences formed expert sample. Eight of them were professor at the university of British Columbia, and the rest were resource management professionals at the Water Quality Branch of the BC Ministry of Environment, Lands and Parks.
Participants were asked to judge 33 hazards (such as acid rain, climate change, flooding, commercial fishing) with 17 risk characteristics (i.e. knowledge, controllability, scope, observability, human benefit, people affected) on 7-point scale ranging from 1(low) to 7(high).
Researchers used factor analysis and found that four factors were affecting the judgments of laypeople. The first factor was impact on species which reflected people’s concern about consequences of hazards to nonhuman species, and found that it was positively correlated with risk perception. Second factor was human benefits. This factor reflected benefits to humans resulting from hazardous
found to be prone to assess some events as less risky in case of high benefit. Third factor, avoidability, was reflecting the controllability of the event. The last factor was knowledge. Researchers suggested that 80% of the variability in perception could be explained by the factors given above.
They observed that only in 11 of the hazards (item 1, 2, 3, 9, 12, 13, 14, 16, 27, 29, 32), results showed significant differences between ratings of two samples. Only acid rain, increased ultraviolet radiation due to ozone depletion, and leachates from landfills were significant (at p<. 001) based on two sided t-tests. Furthermore, in 7 of remaining hazards (loss of fish habitat; agricultural waste disposal; urban runoff; alterations of shorelines for development; hydropower development; septic systems; introduced aquatic species; selective logging; canoeing, kayaking, and rafting) experts rated risks higher than laypeople. The authors concluded that:
People’s perceptions of risk are influenced by their assessment of the benefits conversely associated with a risk item. Thus, higher benefits derived from a risk item tend to reduce the perception of general risk associated with the hazard...experts see introduced species as relatively high in general risk need for regulation, while the lay public does not. (McDaniels et al. 1997, p. 351)
3.5 Study of Wright et al. (2000)
Wright et al. (2000) tried to examine discrepancies between expert and laypeople perceptions concerning the U.K. oil and gas industry. Experts were 21 loss-prevention managers in this industry who were the members of the U.K. Offshore Operator’s Association (UKOOA). All of them were professional engineers and were making risk assessments. Nonexperts consisted of two groups. The first group was 31 managers who were following organizational courses or part-time MBA programs. 30 students of business and economics program of university were forming the second group. Thus, total number of nonexperts was 61.
Participants completed a questionnaire including seven scenarios prepared by UKOOA. These scenarios were about hazardous events that would be faced in industry. Since the experts of UKOOA prepared the scenarios, there had been a high match between experts and risk issue. One of the seven scenarios was as follow:
Scenario 2: Most production platforms have ten or more helicopter flights in and out per week. They are utilized mainly to change crews. A helicopter crashes on its way from the shore to an offshore installation. The helicopter was in midflight, cruising in clear conditions at ~900 m when a Mayday was issued. The coast guard mobilized a search and rescue. There were no survivors. (p.
Table 3: The Sixteen Questions Asked for Each of the Scenarios 1. How much does society know about the risk associated with the scenario? 2. What is the potential for the events in the scenario to cause widespread
disastrous consequences?
3. How long has society known about the particular risk?
4. To what extent should the scenario’s occurrence serve as a warning to society, providing new information about the probability that a similar, or even more destructive, mishap might occur with this type of activity?
5. Given that the scenario occurs, what amount of effort (and money) should be put into preventing its reoccurrence?
6. To what extent is the risk portrayed in the scenario known precisely by the persons who are responsible for managing the risks?
7. Is the risk presented in the scenario a common one that people, in general, have learned to live with and can think about reasonably calmly, or is it one that people have a great dread for on the level of a gut reaction?
8. Can the risk portrayed in the scenario be controlled?
9. Does the risk portrayed in the scenario threaten future generations?
10. Are you, personally, at risk from an event of the type portrayed in the scenario?
11. In your opinion, is the risk from an event of the type described in the scenario increasing or decreasing as we move toward the year 2000?
12. In your opinion, can the risk from an event of the type described in the scenario be reduced easily?
Table 3 (cont’d)
13. In your opinion, if the event described in the scenario occurred, would the media/press coverage be high?
14. To what extent do you trust those responsible for managing the risk described in the scenario to act in society’s interest?
15. To what extent do you think that your evaluations of the risk portrayed in the scenario will be close to those of oil/gas industry experts?
16. Overall, how would you rate the risk of the events described in the scenario?
After reading each scenario, subjects were asked to evaluate scenarios with sixteen questions on 11-point rating scales. Full set of questions asked to subject is given in Table 3.
Wright et al (2000) expressed that evaluating less hazardous events, analyzing those events in detailed form, and concerning hazards from only one area of human activity were the issues that differed this study from earlier ones. At the end of the study, they found different results contrary to many of the outcomes of the studies on differences in perceived risk. One finding was that experts and laypeople share more similarities. Experts are also sensitive to risky situations, and they do not judge the events as less risky than laypeople. Finally, it was concluded that the idea that experts and laypeople have differences in perception of risk should not be generalized for all hazards.
3.6 Study of Lazo et al. (2000)
Lazo et al. (2000) investigated 31 risk characteristics (such as species loss, human suffering, media attention, how ethical, how controllable) for 13 global climate change (GCC) and 12 non-GCC risks given in Table 4 to elicit the differences of perception between experts (ecologists) and laypeople about ecosystems. They used factor analysis to reach conclusions by analyzing responses given to questionnaire. The participants consisted of 10 Pennsylvania State professors and researchers who were expert in ecological science, and 16 employees of the U.S. Environment Protection Agency who were expert in ecology, forming totally 26 experts. 64 students (anthropology, marketing, economics, counseling psychology, and human development classes) and 182 people of Pennsylvania were chosen arbitrarily to form lay sample by using random digit dialing. Participants evaluated 25 hazardous activities with 31 judgment scales by using 7-point scales, ranging from 1(low) to 7 (high).
Table 4: 25 Hazardous Activities Asked for Risk Rating
1. Acid rain 2. Crop failures 3. Decreased rainfall 4. Depletion of ozone layer 5. Desertification
6. Development of land for housing
7. Diseases
8. Extreme temperatures 9. Fireplaces
10. Frequent flooding events 11. Hunting of animals 12. Increased rainfall
13. Increase in severity of winter storms
14. Outdoor recreation
15. Loss of plant and animal species 16. Mining
17. More cloudy days 18. More droughts
19. More intense hurricanes 20. Nuclear power plants 21. Pesticides
22. Sea level rise 23. Top-soil loss 24. Tourism and travel 25. Volcanoes
At the end of the study they observed differences between experts and laypeople in terms of risk perception to ecosystems. They suggested that “laypeople believe scientists understand GCC risks to ecosystems and that the impacts are significant
understandable, less controllable, and more acceptable than non-GCC risks, whereas laypeople judge GCC risks as worse than non-GCC risks. Researchers propose that experts are prone to strengthen policies to reduce uncertainities about impacts.
CHAPTER 4
METHODOLOGY
4.1 Participants
Two independent samples of participants were involved in this study. The first sample was composed of 36 helicopter instructor pilots. Their mean flight experience was 2371 hours (with a standard deviation of 969 hours). On average, they had been flying for 9.7 years (range= 5 to 14 years). Since no female helicopter pilot had the certificate of instructor pilot at the time the questionnaire was applied, all participants were male.
The second sample was composed of 31 helicopter candidate pilots. Their mean flight experience was 53 hours (with a standard deviation of 38 hours). All of the candidates had been flying for less than 1 year. Three of the candidates were female. Both instructors and candidates had the same educational background,
4.2 Procedure
A questionnaire was constructed and the two samples received the same questionnaire set. The questionnaire contained 22 questions in four major sections. In the first section participants were asked their flight status, flight year and flight time to collect information related to current position and experience of the pilots. Since the education, gender, and income of the two samples were known, they weren’t asked.
In the second section, participants were asked to rate the riskiness of incidents given in Table 5. They were told to assign risk values by giving a rating between 0 (no risk) and 100 (maximum risk). The rationale for this section was to evaluate the differences between two samples with respect to riskiness of incidents.
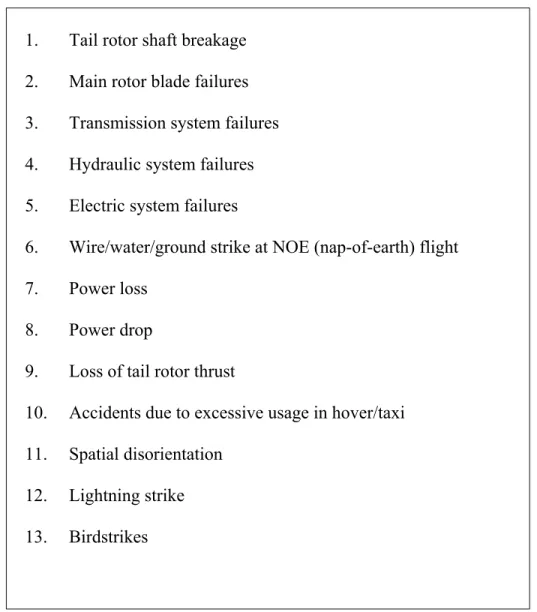
Table 5: Thirteen Incidents Given to Participants
1. Tail rotor shaft breakage 2. Main rotor blade failures 3. Transmission system failures 4. Hydraulic system failures 5. Electric system failures
6. Wire/water/ground strike at NOE (nap-of-earth) flight 7. Power loss
8. Power drop
9. Loss of tail rotor thrust
10. Accidents due to excessive usage in hover/taxi 11. Spatial disorientation
12. Lightning strike 13. Birdstrikes
In the third section, participants were asked to rate each incident on fifteen characteristics with7-point scales, each of which represented a dimension that has been hypothesized to effect risk perception, similar to those found to be important in studies of Slovic et al. (2000). Full set of rating scales is given below:
1. Centrality: To what extent is the incident important for flight safety
2. Controllability: How likely is it that the pilot can remain in control of the helicopter in the event that this incident occurs
3. Severity of consequences-personal: How likely is it that an accident/mishap resulting from this incident would cause severe injury or death to pilots or passengers
4. Severity of consequences-property: How likely is it that an accident/mishap resulting from this incident would cause a great amount of property damages 5. Importance of training: To what extent is the training important to lessen the
severity of the consequences or stay in control of the aircraft in case such incident
6. Adequacy of training: To what extent is the training level sufficient for such kind of incidents
7. Importance of altitude: To what extent is the altitude effective on the consequences of the accidents/mishaps
8. Importance of crew coordination: To what extent is the crew coordination effective on the consequences of the accidents/mishaps
9. Familiarity: To what extent are the pilots familiar with this kind of incident 10. Effect of stress on the result: To what extent is the stress effective on the
consequences of the accidents/mishaps
11. Effect of fatigue on the result: To what extent is the fatigue effective on the consequences of the accidents/mishaps
12. Effect of overconfidence on the result: To what extent is the overconfidence effective on the consequences of the accidents/mishaps
13. Effect of maintenance on the result: How likely is it that the accident/mishap is caused by technical reasons or material defects
14. Effect of night flight on the result: How likely is it that the consequences of accident/mishap would become more severe if it would happen in night flights 15. Effect of technology on the result: To what extent is the level of technology
used in aircraft important for consequences
The answers from two independent set of participants were taken, and Mann-Whitney tests were conducted to compare the answers and observe risk perception differences between these two independent samples.
Finally, five hypothetical decision-making scenarios with regard to helicopter operations, including violation of safety to some extent, were given to participants and asked to choose one of the two given alternatives. These questions were planned to assess the differences in behaviors. The samples were required to select either a risk-taking or a risk-avoiding alternative. The first decision scenario involved main generator failure; the second, exceeding maximum allowable load limits; the third, NOE flight; the fourth, heavy meteorological conditions; and the fifth, heavy meteorological conditions in formation. Full set of questions used in the questionnaire is given in Appendix.
CHAPTER 5
RESULTS
5.1 Overall Riskiness of Incidents
In question 4 of the questionnaire, we asked participants to evaluate overall riskiness of thirteen incidents given in Table 5. We hypothesized that µe = µn, and
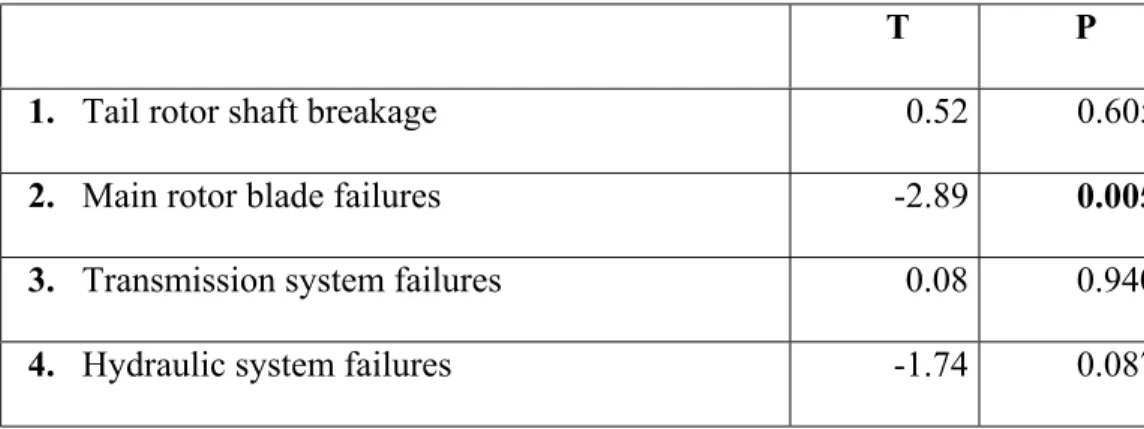
used t statistics to test it. The results of the t statistics are given in Table 6.
Table 6: T-test Results for Overall Riskiness of Thirteen Incidents
T P
1. Tail rotor shaft breakage 0.52 0.605 2. Main rotor blade failures -2.89 0.005 3. Transmission system failures 0.08 0.940 4. Hydraulic system failures -1.74 0.087
Table 6 (cont’d)
5. Electric system failures -3.68 0.000 6. Wire/water/ground contact at NOE -0.39 0.700
7. Power loss 1.21 0.230
8. Power drop 0.14 0.886
9. Loss of tail rotor thrust -0.58 0.561 10. Accidents due to excessive usage in hover/taxi -1.42 0.160 11. Spatial disorientation 0.05 0.959 12. Lightning strike -2.55 0.013
13. Birdstrikes -2.75 0.008
The responses to question 4 showed that there was a remarkable agreement between the answers of two groups, except three incidents. These exceptions were main rotor blade failures, electric system failures, and birdstrikes. While experts rated the riskiness of main rotor blade failures with M=60.42, non-experts judged it as more risky (M=78.52). Main rotor blade failures have some causes. These are design and manufacture faults, unnoticed accident damages, incorrect assembly repairs, and ageing. Incorrect assembly/repairs and ageing are generally eliminated by good maintenance system. The main sources of accidents are design and manufacture faults and unnoticed accident damages. But when we checked the statistics of helicopter accidents in Army Aviation, we observed that only one
design and manufacture fault. We also observed that only 25% of the expert sample (9 pilots) was in Army at the time the accident occurred. It means that, 25 percent witnessed only one accident, 75 percent witnessed no accident during their service resulting from main rotor blade failure. On the other hand, since the main rotor blades are the sources of lifting force, they are one of the generic parts of the helicopter, and it seems reasonable why lay sample rated it as more risky. Most probably, available information on hand caused experts to rate main rotor blade failures as less risky when compared to ratings of lay sample.
In electric system failures and birdstrikes, the results were similar to main rotor blade failures. While expert sample rated electric system failures with Me = 29.58, lay sample rated as Ml = 48.87. also Me = 30.33 and Ml = 47.32 for birdstrikes. It is known that birdstrikes are responsible for millions of dollars in damage annually to aircraft worldwide. But most of the numbers come from fixed-wing accidents. Relatively, slow speed of helicopters allow more time for birds to take evasive action and also for pilots. In aviation school, pilots are trained on bird hazards and correct reactions are taught. Aviation experts recommend pilots to climb when encounter birds in flight, because birds’ panic response is to dive away. Accident statistics for Army backs these recommendations, and no accidents resulting from birdstrikes were reported up to now. Similar results were also valid for electric system failures. Although electric system failures occur frequently, they do not result in accidents. Since all those information were available and very well
known by expert sample, they judged the incidents mentioned above as less risky contradictory to the judgments of non-experts.
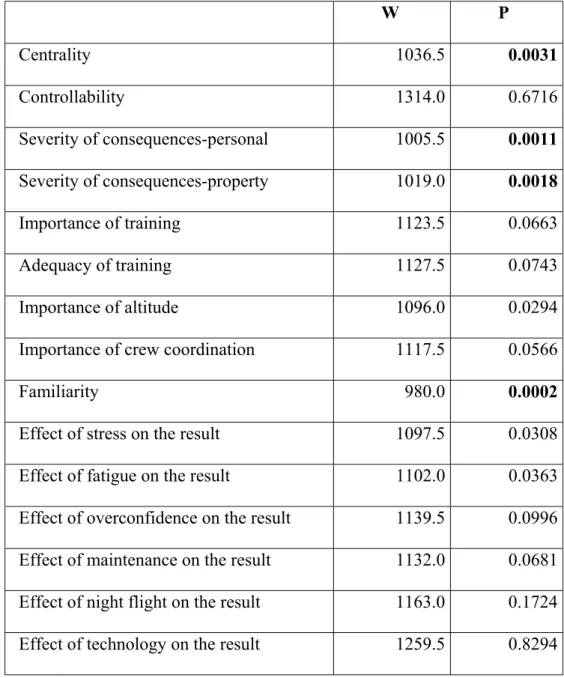
5.2 Evaluation of Risk Characteristics
As mentioned previously, we asked participants to rate each incident with fifteen characteristics on 7-point scales. It was hypothesised that µe = µn , and
Mann-Whitney test was used to observe risk perception differences between two samples at p< 0.01 significance level. The results of tests are given below.
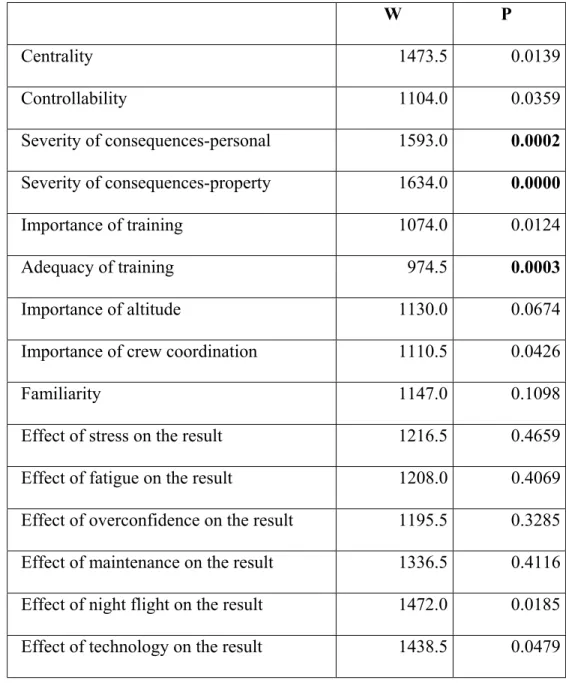
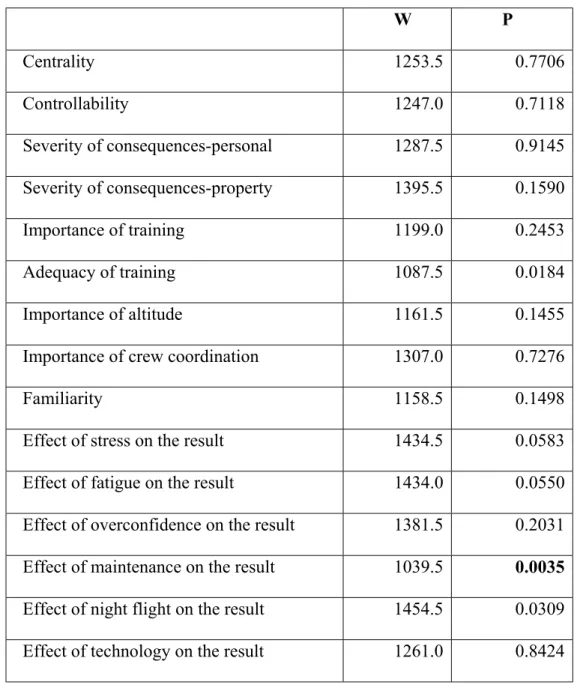
5.2.1 Tail Rotor Shaft Breakage
Test results are given in Table 7. As the table indicates two samples differed in centrality, adequacy of training, and effect of night flight on the result.
Table 7: Mann-Whitney Test Results for Tail Rotor Shaft Breakage
W P
Centrality 1518.0 0.0005