IDENTIFICATION OF A NOVEL EXPERIMENTAL MODEL TO REVEAL MECHANISMS LEADING TO EPIGENETIC CHANGES AND SUBSEQUENT ACTIVATION OF
CANCER TESTIS GENES IN CANCER
A THESIS SUBMITTED TO
THE GRADUATE SCHOOL OF ENGINEERING AND SCIENCE OF BILKENT UNIVERSITY
IN PARTIAL FULFILLMENT OF THE REQUIREMENTS FOR THE DEGREE OF
MASTER OF SCIENCE IN
MOLECULAR BIOLOGY AND GENETICS
By
BarıĢ Küçükkaraduman
ii
IDENTIFICATION OF A NOVEL EXPERIMENTAL MODEL TO REVEAL MECHANISMS LEADING TO EPIGENETIC CHANGES AND SUBSEQUENT ACTIVATION OF CANCER TESTIS GENES IN CANCER
By BarıĢ Küçükkaraduman August 2016
We certify that we have read this thesis and that in our opinion it is fully adequate, in scope and in quality, as a thesis for the degree of Master of Science.
_________________________________
Ali Osmay Güre (Advisor)
_________________________________ Serkan Göktuna
_________________________________ Sreeparna Banerjee
Approved for Graduate School of Engineering and Science:
__________________________________
Levent Onural
iii
I dedicated my thesis to my mum, dad and sisters for the endless love they gave, my wife being the meaning of my life.
iv
ABSTRACT
IDENTIFICATION OF A NOVEL EXPERIMENTAL MODEL TO REVEAL MECHANISMS LEADING TO EPIGENETIC CHANGES AND SUBSEQUENT
ACTIVATION OF CANCER TESTIS GENES IN CANCER
BarıĢ Küçükkaraduman
Master of Science in Molecular Biology and Genetics Advisor: Ali Osmay Güre
August 2016
Epigenetic aberrations are frequently observed in cancer. Tumor-suppressor genes are often repressed with anomalous hypermethylation in cancer, while DNA hypomethylation has been identified in repetitive sequences and promoter regions of cancer testis (CT) genes resulting in genomic instability. Although it has been shown that CT genes are often regulated by dissociation of repressive proteins from promoter-proximal regions and epigenetic mechanisms, including DNA methylation, histone methylation and acetylation, the process leading to epigenetic changes and de-repression of CT genes remains largely unknown. This study aimed to reveal molecular mechanisms which may have role in coordinating CT gene expression. For this purpose, we designed two groups of experiments. The first was based on extending our previous observations related to two genes (ALAS2, CDR1) which showed inverse expression patterns, compared to CT genes in cancer cell lines. The ex vivo analysis of expression patterns of these genes, however, did not support an inverse relation between their expression and that of CT genes. The second approach was based on categorizing cancer cells into CT-high, CT-intermediate and CT-low groups to define differentially expressed non-CT genes that could help explain mechanisms underlying epigenetic changes and subsequent activation of CT genes. Surprisingly, we could not identify any transcripts that differentially expressed between these subgroups. We therefore, hypothesized that non-overlapping and distinct mechanisms could be involved in the upregulation of CT genes in different tumors. As our earlier work suggested a relationship between epithelial to mesenchymal transition (EMT) and CT expression we asked if an EMT based classification could help elucidate these mechanisms. Indeed, differential genes and differentially activated signaling pathways were discovered when cancer cells were first grouped by their EMT status. This helped us identify candidate
v
proteins (BMI1, PCGF2, RB1 and RBL1) and pathways including MAPK/ERK and PTEN/PI3K pathways which can coordinate CT gene expression in cancer. Thirdly, we investigated clinical relevance of high CT gene expression in triple negative breast cancer by attempting to correlate this with drug sensitivity. Drug sensitivity against panobinostat showed correlation with CT gene expression. In summary, this study suggests new approaches to elucidate mechanisms which coordinate epigenetic aberrations in cancer and how these can be utilized for cancer therapy.
Keywords: Cancer testis genes, DNA methylation, epithelial and mesenchymal phenotype, panobinostat
vi
ÖZET
KANSERDE EPĠGENETĠK DEĞĠġĠMLERE VE SONRASINDA KANSER TESTĠS GENLERĠNĠN AKTĠVASYONUNA SEBEP OLAN MEKANĠZMALARIN ORTAYA
ÇIKARILMASI ĠÇĠN YENĠ DENEYSEL MODELLERĠN TANIMLANMASI BarıĢ Küçükkaraduman
Moleküler Biyoloji ve Genetik, Yüksek Lisans Tez DanıĢmanı: Ali Osmay Güre
Ağustos 2016
Normal olmayan epigenetik değiĢimler kanserde sıkça görülür. Kanserde, tümör baskılayıcı genler çoğu kez normal olmayan hipermetilasyon ile susturulurken, tekrar eden sekansların ve kanser testis (KT) genlerinin promoter bölgelerinin hipometilasyon uğradığı belirlenmiĢtir. KT genlerinin, promotere yakın bölgelerdeki baskılayıcı proteinlerin ayrılması ve DNA metilasyonu, histon metilasyon ve asetilasyonu gibi epigenetik mekanizmalarla kontrol edildiği gösterilmesine rağmen bu epigenetik değiĢimlere ve KT genlerinin baskıdan kurtulmasına neden olan süreç büyük oranda netlik kazanmamıĢtır. Bu çalıĢma KT gen ifadesini koordine eden moleküler mekanimların ortaya çıkarılmasını amaçlamaktadır. Bu amaçla, iki grup deney dizayn edilmiĢtir. Ġlki, KT genleri ile karĢılaĢtırıldığında ters ifade düzenine sahip olan iki gen (ALAS2, CDR1) ile ilgili önceki gözlemlerimizin geliĢtirilmesine dayanır. Bu genlerin gen ifade düzeninin ex vivo analizi, bu genlerin ifadesinin KT genleri ile ters iliĢkili olduğunu desteklememiĢtir. Ġkinci yaklaĢım, KT geni olmayan fakat epigenetik değiĢimleri ve sonrasındaki KT genlerinin aktivasyonunu sağlayan mekanizmaları açıklamamıza yardımcı olabilecek, gen ifadesinde farklılık gösteren genlerin bulunması için kanser hücrelerinin KT-Yüksek, KT-Ortave KT-DüĢük olarak kategorize edilmesine dayanmaktadır. Beklenmedik Ģekilde, bu gruplar arasında gen ifadesinde farklılık gösteren ortak genler bulunumamıĢtır. Bu yüzden, birbiri ile örtüĢmeyen farklı mekanizmaların, farklı tümörlerdeki KT genlerinin aktivasyonunda iliĢkili olabileceği varsayımında bulunduk. Bir önceki çalıĢmamızda epitel-mezenkimal geçiĢ (EMG) ile KT gen ifadesi iliĢkisini göz önünde bulundurarak, EMG’ye dayalı bir sınıflandırmanın KT gen ifadesini kontrol eden mekanizmayı açıklayıp açıklayamayacağını araĢtırdık. Kanser hücreleri EMG statülerine göre gruplandırıldıklarında, bazı genlerin ifadelerinin ve sinyal iletim yolaklarının farklılaĢarak aktive olduklarını keĢfettik. Bu yaklaĢım, bizim KT gen ifadesinin kontrolünde rol oynayabilecek bazı aday protein (BMI1, PCGF2, RB1 ve RBL1) ve MAPK/ERK ve PTEN/PI3K gibi sinyal iletim yolaklarını bulmamızı sağladı. Üçüncü olarak, üçlü negatif meme kanserindeki yüksek KT gen ifadesinin klinik bir önemi olup olmadığını ilaç hassiyetleri ile korelasyonuna bakarak araĢtırdık. Panobinostat hassasiyeti, KT gen ifadesi ile pozitif korelasyon gösterdi. Özetle, bu çalıĢma kanserdeki epigenetik anormallikleri koordine eden mekanizmaları ve bunların kanser tedavisi için nasıl kullanılabileğini ortaya koyan yeni yaklaĢımlar içermektedir.
vii
Anahtar kelimeler: Kanser testis genleri, DNA metilasyonu, epitel-mezenkimal geçiĢ, panobinostat
viii
Acknowledgements
I would like to express my sincere gratitude and appreciation to my advisor Dr. Ali Osmay Güre for his guidance in this work. His wide knowledge, support and inspiring suggestions helped me improve myself in the field of science.
For being my thesis committee members and their important critics, I would like to thank Assoc. Prof. Dr. Sreeparna Banerjee and Asst. Prof. Dr. Serkan Göktuna.
I would like to acknowledge Murat ĠĢbilen, Seçil Demirkol for their remarkable efforts on bioinformatics in this projects.
My greatest gratitude goes to my friend Alper Poyraz for his endless support. I am also deeply thankful to current and former members of AOG group; ġükrü Atakan, Sinem Yılmaz-Özcan, Seçil Demirkol, Waqas Akbar, Kerem Mert ġenses, Mehdi Ghasemi since we altogether generated a positive and social work environment.
I am especially grateful to my friends, Erol Eyüpoğlu, Ali Can SavaĢ, Özge Saatçi, Merve Mutlu, Umar Raza, Pelin Ersan and Hilal Bal for their companionship.
I would like to express my very great appreciation to all Bilkent MBG family. Füsun Hanım, Yavuz Abi, Abdullah Amca, Ümmühan Hanım made this department as a home for all of us.
Above all, I am very grateful to my mother, father and sisters for being beside me and believing me in all stages of my educational life. I have been the most lucky person to have such strong, supporting, loving and patient wife, BüĢrü Küçükkaraduman.
I was supported by TÜBĠTAK 2211 scholarship program during my study, thereby I would like to thank TÜBĠTAK for giving me this opportunity.
ix
Table of Contents
ABSTRACT ... iv ÖZET ... vi Acknowledgements... viii Table of Contents ... ix List of Figures ... xiList of Tables ... xiii
Abbreviations ... xv
1. INTRODUCTION ... 1
1.1 Cancer Testis Genes ... 1
1.2 Cancer Testis Antigens and Epithelial-Mesenchymal Transition ... 8
1.3 Potential Clinical Value of CT Gene Expression ... 10
1.3.1 Breast Cancer ... 11
1.3.2 Classification of Breast Cancer and Breast Cancer Cell Lines ... 11
1.3.3 CT Gene Expression in Breast Cancer ... 13
1.3.4 Relationship Between CT Gene Expression and Drug Sensitivity ... 13
1.4 Aim and Hypothesis ... 14
2. MATERIALS AND METHODS ... 15
2.1 MATERIALS ... 15
2.1.1 General Laboratory Reagents and Equipment ... 15
2.1.2 Cell Lines, Culture Materials and Reagents ... 16
2.1.3 Cell Culture Solutions and Drugs... 17
2.1.4 Datasets ... 18
2.2 METHODS ... 20
2.2.1 Cell Culture Techniques ... 20
2.2.2 Harvesting of Cells for RNA isolation ... 21
2.2.3 Total RNA Isolation with TRIzol... 21
2.2.4 DNAseI Treatment of Isolated RNA ... 22
2.2.5 RNA Quantification ... 22
x
2.2.7 qRT-PCR Analysis for CT Gene Expression ... 23
2.2.8 Cell Counting ... 24
2.2.9 Drug Treatment and Luminescent Cell Viability Assay ... 25
2.2.10 Calculations of the Half Maximal Inhibitory Concentration (IC50) ... 26
2.2.11 Software Programs Used in this Study ... 26
2.2.12 Tumors and Adjacent Normal Tissues ... 26
3. RESULTS ... 27
3.1 Revealing Mechanisms which Control CT Gene Expression in Cancer ... 27
3.1.1Region Specific Epigenetic Changes Leading to Cancer Testis Gene Expression 27 3.1.2 Distribution of CT Gene Expression among Cancer Cell Lines ... 32
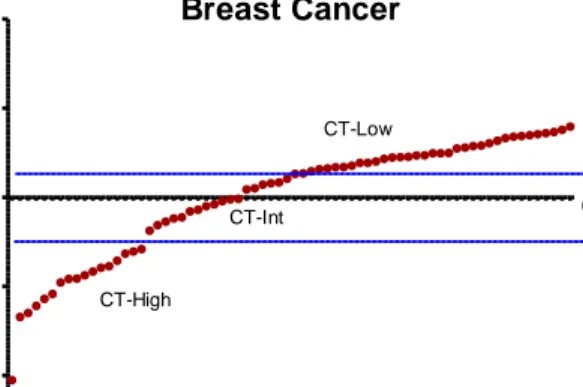
3.1.3 Subgrouping Breast, Skin and Colon Cancer Cell Lines based on CT Gene Expression ... 33
3.1.4 Identification of Differentially Expressed Transcripts (DET) between CT based Subgroups ... 35
3.1.5 Comparison of DETs among Different Cancer Types ... 35
3.1.6 Identification of Differentially Expressed Non-coding Transcripts between CT based Subgroups ... 37
3.2 Relationship between CT Gene Expression and Epithelial/ Mesenchymal Phenotype 38 3.2.1 Subgrouping based on E/M phenotype and CT Gene Expression ... 41
3.2.2 DET Analysis with New Categorization ... 42
3.2.3 GSEA with CT-High and CT-Low Subgroups Classified by Epithelial/Mesenchymal Phenotype ... 45
3.3 Potential Clinical Value of CT Gene Expression ... 49
3.3.1 Panobinostat sensitivity Correlated with CT Gene Expression in Basal B Subtype ... 51
3.3.2 In Vitro Validation ... 53
4. DISCUSSION AND CONCLUSION ... 56
5. FUTURE PERSPECTIVES... 62
BIBLIOGRAPHY... 63
xi
List of Figures
Figure 1.1: ALAS2 and PAGE2&2B mRNA expression in healthy colon and colon cancer cell lines ... 4 Figure 1.2: ALAS2 and PAGE2&2B mRNA expression in healthy lung and lung cancer cell lines. ... 5 Figure 1.3: CDR1 and SPANXB mRNA expression in healthy colon and colon cancer cell lines. ... 6 Figure 1.4:CDR1 and SPANXB mRNA expression in healthy lung and lung cancer cell
lines. ... 7 Figure 1.5:Expression levels of PAGE-2,-2B and SPANX-B during Caco-2 spontaneous
differentiation, at days 0, 10, 20 and 30. ... 9 Figure 1. 6: DNA methylation and hydroxymethylation levels during spontaneous
differentiation of Caco-2 cells. ... 9 Figure 1.7: Chromatin modifications in PAGE2, 2B and SPANXB during Caco-2
differentiation. ... 10 Figure 2.1: Design of drug cytotoxicity experiments. ... 25 Figure 3.1: mRNA expression levels of PAGE2, SPANXB and proximal genes ALAS2 and CDR1 in tumor and matched normal tissues. ... 30 Figure 3.2: Correlation of CT-proximal genes ALAS2/CDR1 expression with
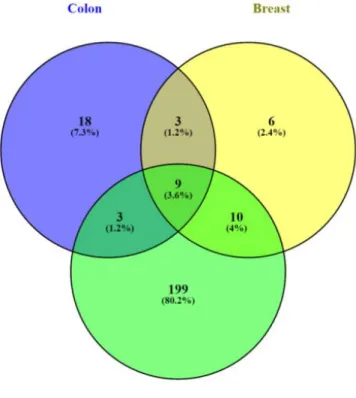
PAGE2/SPANXB gene expression in breast and colon cancer cell lines. ... 31 Figure 3.3: Distribution of CT gene expression among cancer cell lines. ... 32 Figure 3.4: Categorizing skin cancer cell lines into CT-High, CT-Int and CT-Low groups.. ... 33 Figure 3.5: Categorizing breast cancer cell lines into CT-High, CT-Int and CT-Low groups.. ... 34 Figure 3.6: Categorizing colon cancer cell lines into CT-High, CT-Int and CT-Low groups. .... 34 Figure 3.7: Nine differentially expressed genes identified in colon, breast and skin cancer
cell lines were common.. ... 36 Figure 3.8: Common non-coding transcripts between colon, breast and skin cancer cell
lines.. ... 37 Figure 3.9: Suggested expression patterns CT genes during EMT based on observations in our previous studies. ... 39
xii
Figure 3. 10: Distribution of skin cancer cells in epithelial/mesenchymal phenotype and
CT-expression based classification.. ... 39
Figure 3.11: Distribution of breast cancer cells in epithelial/mesenchymal phenotype and CT-expression based classification. ... 40
Figure 3.12: Distribution of colon cancer cells in epithelial/mesenchymal phenotype and CT-expression based classification.. ... 40
Figure 3.13: New model for CT gene expression in EMT. ... 41
Figure 3.14: Categorizing cell lines based on EMT status and CT gene expression levels. ... 42
Figure 3.15: Common genes between differentially expressed genes identified by new categorization.. ... 44
Figure 3.16: Summary of gene set enrichments in different phenotypes with different CT expression levels in breast cancer cell lines. ... 46
Figure 3.17: CT gene expression within intrinsic subtypes of breast cancer cell lines. ... 50
Figure 3.18: Panobinostat sensitivity correlation of CT-PC1 in Basal B cells.. ... 52
Figure 3.19: Dacinostat and Vorinostat sensitivity correlation of CT-PC1 in Basal B cells... 52
Figure 3.20: Other drug response correlation of CT-PC1 in Basal B cells. ... 53
Figure 3.21: Percent cell viability curves for Panobinostat with Basal B cells. ... 54
xiii
List of Tables
Table 1.1: Intrinsic subtypes of breast cancer cell lines ... 12
Table 2.2: List of instruments used in this study ... 16
Table 2.3: List of reagent used in cell culture. ... 17
Table 3.1: Enriched gene sets in CT-High epithelial breast cancer cell lines. ... 45
Table 3.2: Enriched gene sets in CT-Low epithelial breast cancer cell lines. ... 45
Table 3.3: Enriched gene sets in CT-High mesenchymal breast cancer cell lines. ... 46
Table 3.4: Enriched gene sets in CT-Low mesenchymal breast cancer cell lines. ... 46
Table 3.5: Enriched gene sets in CT-High epithelial colon cancer cell lines. ... 47
Table 3.6: Enriched gene sets in CT-Low epithelial colon cancer cell lines. ... 47
Table 3.7: Enriched gene sets in CT-High mesenchymal colon cancer cell lines ... 48
Table 3.8: Enriched gene sets in CT-Low mesenchymal colon cancer cell lines ... 48
Supplementary Table 1.1: Differentially expressed transcripts between High and CT-Low skin cancer cell lines.. ... 70
Supplementary Table 1.2: Differentially expressed transcripts between High and CT-Low breast cancer cell lines.. ... 72
Supplementary Table 1.3: Differentially expressed transcripts between High and CT-Low colon cancer cell lines.. ... 72
Supplementary Table 1.4: Differentially expressed non-coding RNAs between CT-High and CT-Low skin cancer cell lines. ... 73
Supplementary Table 1.5: Differentially expressed non-codin RNAs transcripts between CT-High and CT-Low breast cancer cell lines.. ... 74
Supplementary Table 1.6: Differentially expressed non-coding transcripts between CT-High and CT-Low colon cancer cell lines. ... 75
Supplementary Table 1.7: Differentially expressed transcripts between High and CT-Low breast epithelial cancer cell lines ... 75
Supplementary Table 1.8: Differentially expressed transcripts between High and CT-Low breast mesenchymal cancer cell lines. ... 76
Supplementary Table 1.9: Differentially expressed transcripts between High and CT-Low colon epithelial cancer cell lines. ... 78
xiv
Supplementary Table 1.10: Differentially expressed transcripts between High and
CT-Low colon mesenchymal cancer cell lines.. ... 79 Supplementary Table 1.11 Differentially expressed transcripts between High and
CT-Low skin mesenchymal cancer cell lines.. ... 81 Supplementary Table 1.12: Gene set enrichments in CT-High breast cancer cells. ... 82 Supplementary Table 1.13: Gene set enrichments in CT-Low breast cancer cells. ... 84
xv
Abbreviations
5-AZA 5-aza-2'-deoxycytidine
ALAS2 5'-Aminolevulinate Synthase 2
ATP Adenosine triphosphate
BMI1 Polycomb Group RING Finger Protein 4
BORIS CCCTC-binding factor like
CCLE Cancer Cell Line Encyclopedia
CDH1 Cadherin-1
CDR1 Cerebellar degeneration related protein 1
CDX2 Caudal Type Homeobox 2
CGAP Cancer Genome Anatomy Project
CGP Cancer Genome Project
cDNA Complementary deoxyribonucleic acid
CSC Cancer stem cell
CT Cancer testis
CTCF CCCTC-binding factor
ddH2O Double distilled water
DET Differentially expressed transcripts
DMEM Dulbecco's Modified Eagle Medium
EMEM Eagle's Minimum Essential Medium
EMT Epithelial-mesenchymal transition
ERK Mitogen-activated protein kinase
FBS Fetal bovine serum
FN Fibronectin
GAGE G Antigen
GSEA Gene set enrichment analysis
HDACi Histone deacetylase inhibitor
HP1 Heterochromatin protein 1
KMT6 Enhancer Of Zeste Homolog 2
xvi
IC50 Inhibitory concentration 50%
LINE1 Long interspersed nuclear elements
MAGE Melanoma Antigen Family
MAP2K1 Mitogen-Activated Protein Kinase Kinase 1
MET Mesenchymal-epithelial transition
mRNA Messenger ribonucleic acid
NY-ESO-1 New York Esophageal Squamous Cell Carcinoma 1
OD Optical density
PAGE Prostate associated gene family
PBS Phosphate buffered saline
PCGF2 Polycomb Group Ring Finger 2
PI3K Phosphoinositide 3-kinase
PRC2 Polycomb Repressive Complex 2
PTEN Phosphatase and tensin homolog
RB1 Retinoblastoma 1
RBL1 Retinoblastoma-Like 1
RPMI Roswell Park Memorial Institute medium
RNA Ribonucleic acid
SAHA Suberoyl hydroxamic acid, Vorinostat
SPANX Sperm protein associated with the nucleus, X chromosome family
SSX Sarcoma, synovial, X-chromosome-related gene family
TET2 Tet Methylcytosine Dioxygenase 2
TNBC Triple negative breast cancer
TSA Trichostatin A
1
1. INTRODUCTION
1.1 Cancer Testis Genes
Cancer-Testis (CT) Genes are group of genes which show selective expression patterns [1]. Their expression is restricted to adult testis germ cells among healthy tissues and they are reactivated in various tumor types [2]. Additionally, CT gene expression is also observed in fetal ovary and placenta [3]. Epigenetic changes which result in anomalous gene expression patterns are recognized as a hallmark of cancer. Tumorigenesis is promoted and driven by group of genes; some of them are called epigenetic-drivers. Aberrant expression patterns in cancer are thought to be crucial characteristics of epigenetic-drivers of tumorigenesis [4-8]. The re-activation of CT genes in cancer is thought to involve similar epigenetic changes that are observed in gametogenesis and tumorigenesis [9]. Therefore, studying epigenetic mechanisms which control CT gene expression may provide a better understanding of tumorigenesis. Despite the fact that CT gene expression occurs irrespective of tissue of origin in cancer, it is not observed in all samples of a given cancer type. This selective expression pattern of CT genes is a valuable model to examine epigenetic alterations behind aberrant gene expression and complex regulations in carcinogenesis.
To date, more than 200 CT genes have been reported [10]. As most CT gene products are capable of inducing autologous anti-tumor immune responses, autologous typing was the first methodology to identify CT antigens [11]. With the development of microarray and next-generation sequencing technologies, new CT antigens were identified recently by using multiple databases [12]. Studying CT gene expression in silico is challenging as most CT genes exist as families with highly homologous members which are difficult to distinguish in microarray or RNA sequencing based methods. Additionally, there is lack of in vitro experimental models in which epigenetic regulations of CT genes can be studied.
2
CT genes are expressed in various cancer types which can thus be designated as “CT-rich” or “CT-poor”. CT-rich tumors include melanomas, hepatocellular carcinomas, chondrosarcomas, non-small lung, ovarian and bladder cancers. Tumors originated from breast and prostate have moderate expression of CT genes. Tumors defined as “CT-poor” include renal, pancreatic and colon cancers, and hematological malignancies [13, 14]. There are different classifications of CT genes based on their chromosomal localizations, “CT-X” genes and “non-X CT” genes [1], or based on their mRNA expression spectrum in normal tissues, “testis/brain-selective”, “testis-restricted” and “testis-selective” [15].
Although CT genes have heterogeneous expression among different cancer types, it has been shown that CT genes are coordinately expressed in non-small lung cancer as well as in other cancers [16]. This is an important observation suggesting that mechanism of CT gene expression regulation is controlled by common mechanisms [17].
The common mechanism which controls CT gene expression is thought to be mainly epigenetic in nature [13]. Studies show that healthy tissues lacking CT gene expression have DNA hypermethylation in their promoter region. In contrast, CT expressing cancers and testis tissue show DNA hypomethylation in promoter regions of CT genes [18]. This fact is also observed in 5-aza-2’-deoxycytidine (5-AZA, a DNA hypomethylating agent) induced cell lines in which 5-AZA treated cell lines have CT gene upregulation with DNA hypomethylation in their promoter region, suggesting that DNA methylation is a crucial epigenetic change in controlling expression of CT genes [19]. DNA hypomethylation in promoter region of CT genes is observed in parallel to LINE1 repeat demethylation indicating that global DNA hypomethylation is a leading epigenetic mechanism in re-activation of CT genes in cancer[20-23]. Intratumor and intertumor heterogeneity of CT gene expression is associated with promoter region-specific and global DNA methylation status in tumors as well [19, 24], suggesting the mechanisms that control methylation status of CT genes are likely to be complex. In
3
other studies, it has been shown that histone acetylation results in upregulation of CT gene expression [25, 26]. In another study, findings suggest that CT gene expression is both associated with DNA methylation and EZH2-H3K27Me3 status. It was shown that siRNA silencing of EZH2, in combination with 5-AZA and TSA treatment, induced strong activation of GAGE family CT genes while 5-AZA and TSA treatment alone resulted in weak induction [27]. This is concordant with our results where we showed EZH2 dissociation from CT gene promoters during Caco-2 differentiation resulting in upregulation of PAGE2 and SPANXB [36]. KMT6 mediates trimethylation of H3K27 which is associated with polycomb repressive complex 2 (PRC2) binding. KDM1 and KDM5B mediate demethylation of H3K4 which is associated repressed genes. Inhibition of these proteins was shown to improve the effect of DNA hypomethylating agent 5-AZA in terms of CT gene upregulation [28-30]. In summary, repressor complexes, histone acetylation, histone and DNA methylation, and associated proteins were shown to play a role in the regulation of CT gene expression [28-30][28-30][28-30]. Transcription factors have also shown to be important regulators of CT gene expression. In lung cancer cells, promoter region of NY-ESO-1 is occupied with transcription factors CTCF and BORIS resulting in de-repression of this gene [31]. Re-activation and de-repression are also observed in conditional expression of BORIS in healthy cells resulting in DNA hypomethylation [32]. Our studies also suggested that CT genes in a defined region are epigenetically activated, while other regions of genome have different epigenetic changes which repress genes in the region. So, genomic locations on which CT genes are found have clear boundaries, thus these regions and outside of the regions are controlled by different epigenetic mechanisms.
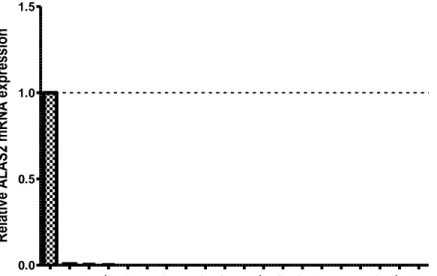
Previously, members of our group hypothesized that if CT genes were co-regulated, that there could be genes whose expression followed the exact opposite pattern. In this line, we showed that CT genes, PAGE2B and SPANXB, are up-regulated while two genes proximal to these (identified by an in silico method involving the CGAP database), ALAS2 and CDR1, are down-regulated in cancer while the opposite expression pattern is observed for normal tissues (Figure 1.1, 1.2, 1.3, 1.4).
4 COLO N Lim 1215 CaCO2SW837Colo2 05 SW122 2 SW480HCT 116 HCT 15 LoV o Ls17 4T Ls18 0 S K- CO-17 S K- CO-19 SW403SW620 0.0 0.5 1.0 1.5 R el at iv e A LA S2 m R N A e xp re ss io n CO LON HCT 116 HCT 15 LoV o SW 837 Lim121 5 Ls1 74T Ls1 80 SW 480 SW 403 Colo 205 SW 620 S K-CO -19 S K-CO -17 SW 1222 CaCO 2 0 2 4 6 8 Re la ti v e P A GE 2 & P A GE 2 B m RN A e x p re s s io n
Figure 1.1: ALAS2 and PAGE2&2B mRNA expression in healthy colon and colon cancer cell lines. The significant down-regulation in ALAS2 (50 kb away from PAGE2
gene) expression was observed in a panel of colon cancer cell lines compared to normal tissue while PAGE2&2B mRNA expression was significantly up-regulated in cancer cell lines compared to normal. GAPDH gene expression was used as endogenous control. These data adapted from our previous studies.
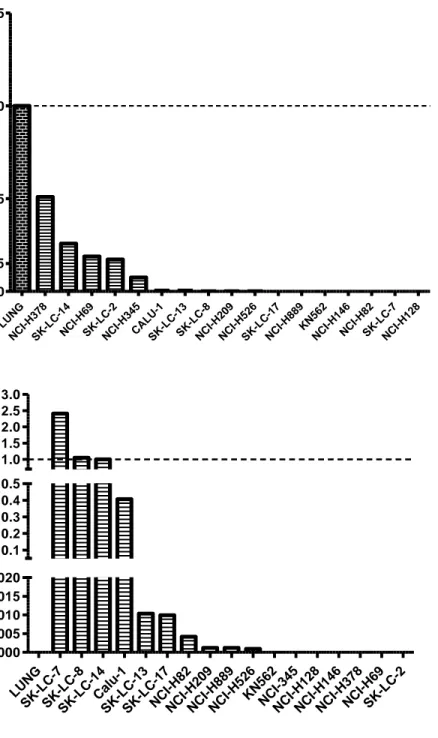
5 LUNG NCI-H69 S K- LC-8 S K- LC-7 S K- LC-6 Calu-1 KN562 NCI-740 NCI-H128 NCI-H146 NCI-H209 NCI-H345 NCI-H378 NCI-H526 NCI-H82 NCI-H889 S K- LC-13 S K- LC-14 S K- LC-17 S K- LC-2 0.0 0.5 1.0 1.5 R ela tiv e A LA S2 m R N A e xp re ss io n LUNG NCI -H1 46 NCI -345 NCI -H1 28 SK-L C-17 SK-L C-13 NCI -H2 09 SK-L C-7 NCI -H8 2 SK-L C-8 Ca lu-1 NCI -H3 78 NCI -H8 89 NCI -H5 26 KN5 62 NCI -H6 9 SK-L C-2 SK-L C-14 0.0 0.5 1.0 1.5 2.0 2.5 5 10 15 20 200 400 600 800 R e la ti v e P A GE 2 & P A GE 2 B m R N A e x p re s s io n
Figure 1.2: ALAS2 and PAGE2&2B mRNA expression in healthy lung and lung cancer cell lines. The significant down-regulation in ALAS2 (50 kb away from PAGE2
gene) expression was observed in a panel of lung cancer cell lines compared to normal tissue while PAGE2&2B mRNA expression was significantly up-regulated in cancer cell lines compared to normal. GAPDH gene expression was used as endogenous control. These data adapted from our previous studies.
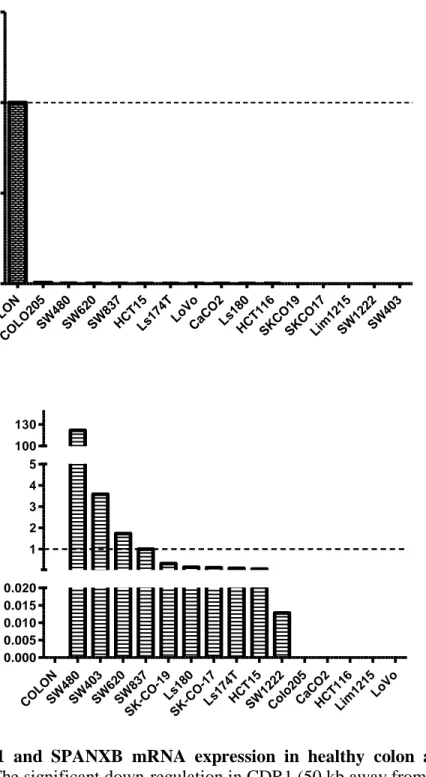
6 COLON COLO20 5 SW 480 SW 620 SW 837 HC T15 Ls1 74T LoVo CaCO2Ls1 80 HC T11 6 SKC O19 SKC O17 Lim1 215 SW 1222 SW 403 0.0 0.5 1.0 1.5 R e la ti v e CDR 1 m R N A e x p re s s io n CO LON SW 480 SW 403 SW 620 SW 837 S K-CO -19 Ls1 80 S K-CO -17 Ls1 74T HCT 15 SW 1222 Colo 205 CaCO 2 HCT 116 Lim121 5 LoV o 0.000 0.005 0.010 0.015 0.020 1 2 3 4 5 100 130 Re la ti v e S P A NX B m RN A e x p re s s io n
Figure 1.3: CDR1 and SPANXB mRNA expression in healthy colon and colon cancer cell lines. The significant down-regulation in CDR1 (50 kb away from SPANXB
gene) expression was observed in a panel of colon cancer cell lines compared to normal tissue while SPANXB mRNA expression was significantly up-regulated in cancer cell lines compared to normal. GAPDH gene expression was used as endogenous control. These data adapted from our previous studies.
7 LU NG NC I-H378 SK-LC-14 NC I-H69 SK-LC-2 NC I-H345CALU -1 SK-LC-13 SK-LC-8 NC I-H209 NC I-H526 SK-LC-17 NC I-H889KN 562 NC I-H146 NC I-H82 SK-LC-7 NC I-H128 0.0 0.5 1.0 1.5 0.15 R e la ti v e C D R 1 m R N A e x p re s s io n LUNG S K- LC-7 S K- LC-8 S K- LC-14 Calu-1 S K- LC-13 S K- LC-17 NCI-H82 NCI-H209 NCI-H889 NCI-H526 KN562 NCI-345 NCI-H128 NCI-H146 NCI-H378 NCI-H69 S K- LC-2 0.000 0.005 0.010 0.015 0.020 0.1 0.2 0.3 0.4 0.5 1.0 1.5 2.0 2.5 3.0 Re la ti v e S P A NX B m RN A e x p re s s io n
Figure 1.4:CDR1 and SPANXB mRNA expression in healthy lung and lung cancer cell lines. The significant down-regulation in CDR1 (50 kb away from SPANXB gene)
expression was observed in a panel of colon cancer cell lines compared to normal tissue while SPANXB mRNA expression was significantly up-regulated in cancer cell lines compared to normal. GAPDH gene expression was used as endogenous control. These data adapted from our previous studies.
8
1.2 Cancer Testis Antigens and Epithelial-Mesenchymal Transition
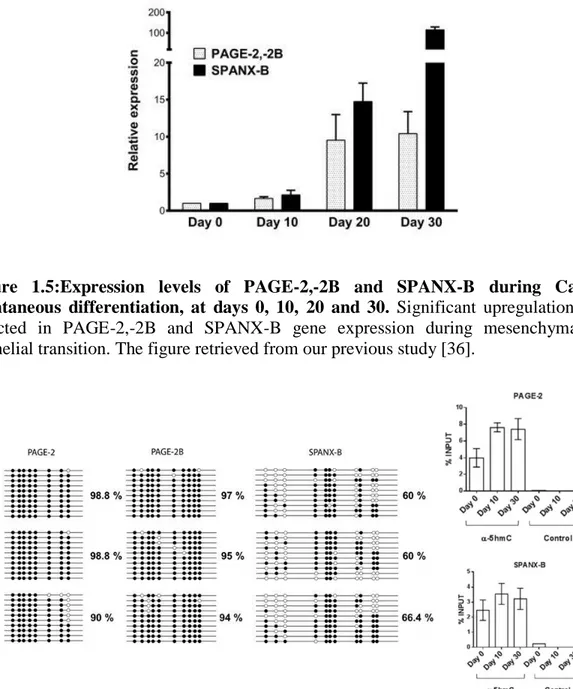
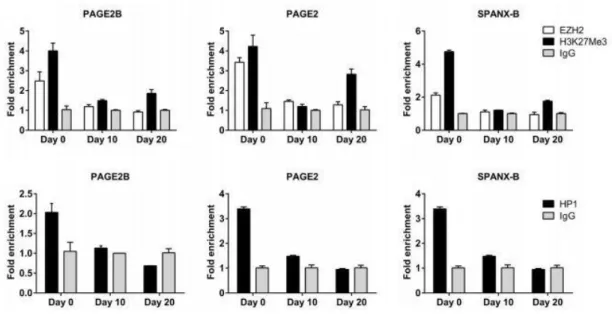
CT gene expression status during epithelial-to-mesenchymal transition (EMT) is very controversial. Some reports indicate that CT genes are highly expressed in cells with an epithelial phenotype (or differentiated) while others report that there is CT gene upregulated in cells with mesenchymal phenotype (or a stem-cell like). For instance, SSX, a CT gene family, is highly expressed in human mesenchymal stem cells and was shown to co-localize with mesenchymal marker gene, Vimentin [33]. Similarly, in another study, MCF-7, a breast cancer cell line, which overexpresses SSX showed repressed E-Cadherin, an epithelial marker gene [34]. CT45 which is a testis-restricted CT gene has been identified with aberrant expression in epithelial cancers [35]. In our recent findings, in contrast to findings summarized above, we showed that mesenchymal-to epithelial transition (MET) resulted in upregulation of some CT genes. In this study, we used Caco-2 colon cancer cell line to examine CT gene expression during mesenchymal-to epithelial transition. When Caco-2 cells reach confluency, they start to differentiate with phenotypic changes. In this model, CT gene expression was measured at post-confluence, day 10, 20 and 30. SPANXB and PAGE2 genes were upregulated during differentiation (Figure 1.5). If cells at day 20 were detached and seeded resulting in de-differentiation, downregulation of SPANXB and PAGE2 genes were observed together with upregulation of mesenchymal markers. In the same study, we showed that there is an increase in TET2 expression and 5-hydroxymethylation levels in promoter regions of SPANXB and PAGE2 genes concordant with MET (Figure 1.6). Dissociation of both PRC2 and HP1 repressor proteins (Figure 1.7) from promoter regions of these genes was also observed during MET [36]. Although this study helped identify novel epigenetic changes which relate to the activation of these genes, we still don’t have a complete understanding of how these genes are selectively activated and which mechanisms lead to these epigenetic changes that result in CT gene expression.
9
Figure 1.5:Expression levels of PAGE-2,-2B and SPANX-B during Caco-2 spontaneous differentiation, at days 0, 10, 20 and 30. Significant upregulation was
detected in PAGE-2,-2B and SPANX-B gene expression during mesenchymal-to-epithelial transition. The figure retrieved from our previous study [36].
Figure 1. 6: DNA methylation and hydroxymethylation levels during spontaneous differentiation of Caco-2 cells. Hydroxymethylation levels (at right) in promoter region
of CT genes, PAGE-2 and SPANX-B, increases during mesenchymal to epithelial transition while promoter proximal DNA regions of CT genes are heavily hypermethylated (at left). The figure retrieved from our previous study [36].
10
Figure 1.7: Chromatin modifications in PAGE2, 2B and SPANXB during Caco-2 differentiation. Heterochromatin protein 1 (HP1) and polycomb repressive complex 2
protein EZH2 are dissociated from promoter-proximal regions of CT genes, PAGE-2 and SPANX-B, and H3K27Me3 levels were decreased during mesenchymal to epithelial transition. The figure retrieved from our previous study [36].
1.3 Potential Clinical Value of CT Gene Expression
Various tumor associated antigens were identified in several studies and this leads to development of new approaches for targeted immunotherapy of cancers [37]. One of these targets for immunotherapy is cancer testis antigens because of their particular expression pattern in healthy and cancerous tissues [1]. Most of studies about clinical significance of cancer testis gene expression suggest correlation of CT expression with worse prognosis while CT expression has been less frequently linked to improved outcome in different cancer types [38-42]. However, clinical significance of CT gene expression as being chemosensitivity biomarker in cancers remains largely unknown. In this study, we aimed to show potential clinical value of CT gene expression in breast cancer by attempting to correlate CT gene expression with drug response data from CCLE and CGP.
11 1.3.1 Breast Cancer
Breast cancer is a complex disease which is the most frequently diagnosed cancer and the most common cause of death from cancer in women after lung cancer. Risk factors are divided into three groups, potentially modifiable factors, non-modifiable factors and reproductive factors. Long-term heavy smoking, alcohol consumption, weight gain after 18 in years of age, obesity, being on menopausal hormone therapy, and physical inactivity are called modifiable factors which are associated with increased breast cancer risk [43-47]. High dose radiation to the chest, inherited mutations in risk factor genes, older age, history of hyperplasia, ductal or lobular carcinoma, and type 2 diabetes are classified as non-modifiable factors [48-52]. Reproductive factors include high levels of sex hormones, aberrant menstrual history, never having children, and having one’s first child after 30 years of age [53-57]. Treatment strategies for breast cancer depend on tumor characteristics. Breast conserving surgery or removal of all breast tissue is the usually commonly performed. Treatment options also involve targeted therapy, hormonal therapy, radiation therapy and chemotherapy. Despite there being advanced strategies to treat breast cancer, resistance to treatment is very common [58-62].
1.3.2 Classification of Breast Cancer and Breast Cancer Cell Lines
Breast tumors and frequently used breast cancer cell lines are mostly classified in various studies based on their histopathology, grade, stage, hormone receptor status, gene expression and mutation status [63-67]. In classification of breast cancer cell lines, genome copy number and transcriptional profiles of cell lines and primary breast tumors were compared [68, 69]. Breast cancer cell lines were classified into Luminal, Basal A and Basal B while intrinsic subtypes of breast cancer has been identified as Luminal A, Luminal B, HER2-enriched, Basal-like and Normal-like [66, 68, 70]. These classifications are mostly based on differences in gene expression analyses which also provide valuable insights into breast cancer complexity. Classification of breast cancer cell lines revealed that cell lines mirror most of primary breast tumors with some
12
differences. For instance, Basal-like intrinsic subtype of breast tumors has been subdivided into two termed Basal A and Basal B. It has been shown that Vimentin-positive Basal B subtype is clearly distinct from Basal A subtype exhibiting a stem cell-like expression pattern. On the other hand, Basal A subtype reflects the features of the clinical triple-negative tumor type. Luminal cluster of cancer cell lines mirror Luminal A and Luminal B intrinsic subtypes of breast primary tumors [66, 70-72].
13 1.3.3 CT Gene Expression in Breast Cancer
CT genes are moderately expressed in breast cancer [2]. Additionally, there are a number studies on the clinical relevance of CT gene expression in breast cancer. A recent finding suggests that AKAP3 expression in breast tumors and normal adjacent tissues may be good predictor of prognosis [73]. Another study examined the expression of NY-ESO-1 in 623 breast tumors, suggesting that NY-ESO-1 gene is highly expressed in triple-negative breast cancer and it is related with good prognosis [74]. On the other hand, large scale study by Grigoriadis et al. showed that MAGEA family of CT genes and NY-ESO-1 are highly expressed in ER-negative breast tumors [75]. MAGEA9 expression was also evaluated in invasive ductal breast cancer, and results showed that higher MAGEA9 expression was correlated with poor prognosis [76]. It was also shown that other MAGEA family genes, MAGEA1, MAGEA6 and MAGEA12 are frequently expressed in breast cancer [77] and identified as causal factor in the formation of tamoxifen resistant breast cancer [78]. Therefore CT gene expression has been associated with good and bad prognosis groups in different studies.
1.3.4 Relationship Between CT Gene Expression and Drug Sensitivity
A subtype of breast cancer, triple negative breast cancer (TNBC), is characterized by the lack of estrogen receptor, progesterone receptor expression and lacking amplification of human epithelial growth factor receptor 2. This type of cancer is generally aggressive, and therapeutic approaches are very limited [79, 80]. Studies on CT expression in breast cancer showed that basal-like subtype tumors have a high variation of CT gene expression compared to other subtypes [12, 81]. This heterogeneity could be reflecting distinct cellular pathways being active in CT-High and CT-Low cells, and if this is so then CT gene expression in TNBCs could correlate with drug response.
14
1.4 Aim and Hypothesis
Since CT gene expression shows variability in cancer, studying CT gene expression can reveal distinct mechanisms active in CT-High and CT-Low cells and the study of these could help understand epigenetic-drivers tumorigenesis. In this line, studying CT gene expression patterns could also help develop new personal therapeutic approaches by predicting drug responses.
In the present study, we aimed to identify an experimental model whose study could reveal molecular mechanisms which may have role in controlling epigenetic changes in promoter regions of CT genes. We assumed that rich”, moderate” and “CT-poor” tumors would correspond to cancer cell lines, with CT high, CT intermediate and CT low expression. Analyzing gene expression differences between CT high and low cell line groups, we tried to identify non-CT genes that could be responsible for this difference. Secondly, with the knowledge of the role of EMT in CT gene expression, we performed a similar analysis in cancer cell lines that were first classified according to their epithelial/mesenchymal phenotype. Finally, we studied clinical relevance of CT gene expression as a marker of targeted drug responses in Basal B subtype of breast cancer cell lines.
15
2. MATERIALS AND METHODS
2.1 MATERIALS
2.1.1 General Laboratory Reagents and Equipment
Table 2.1: List of laboratory reagents used in this study
Material Catalog
Number
Company
DEPC-Treated Water AM9920 Ambion by Life Sciences (CA,
USA)
TRIzol Reagent 15596026 Ambion by Life Sciences (CA,
USA) RNaseZap RNase
Decontamination Solution
AM9782 Ambion by Life Sciences (CA,
USA)
DNA AWAY Surface Decontaminant
7010 Molecular BioProducts (CA, USA)
Qubit RNA BR Assay Kit
Q10210 Invitrogen (CA, USA)
Maxima First Strand cDNA Synthesis Kit for RT-qPCR
K1641 Thermo Scientific (IL, USA)
DNA-free
DNA Removal Kit
AM1906 Ambion by Life Sciences (CA,
USA) OneTaq Hot Start DNA
Polymerase
M0481S New England BioLabs (MA,USA)
LightCycler 480 SYBR Green I Master
04707516 001
Roche Diagnostics (Basel, Switzerland)
Taqman Gene
Expression Master Mix
4369016 Applied Biosystems by Life
Sciences (CA,USA) Gene Ruler 100 bp DNA
Ladder
SM0241 Thermo Scientific (IL, USA)
Gene Ruler DNA Ladder Mix
16
Table 2.1: List of instruments used in this study
Instruments Company
Eppendorf 5810 R Refrigerated Centrifuge Eppendorf (Hamburg, Germany)
Heat Block
Qubit Fluorometer Invitrogen (CA, USA)
NanoDrop One Thermo Scientific (DE, USA)
Merinton SMA1000 Spectrophotometer Merinton (MI,USA)
XCell SureLock Mini-Cell Electrophoresis System
Life Sciences (CA, USA)
Mini-Sub Cell GT Horizontal Electrophoresis System
BIO-RAD (CA, USA)
Light Cycler 480 II PCR Machine Roche (Basel, Switzerland)
Bio-Tek Synergy HT Multi-Mode Microplate Reader
BioTek Instruments (VT, USA)
CO2 Incubator NU-8500 Water Jacket NuAire (MN,USA)
LabGard NU-425 Class II Biosafety Cabinet
NuAire (MN,USA)
2.1.2 Cell Lines, Culture Materials and Reagents
Breast cancer Basal B subtype cell lines (CAL-51, HBL-100, HCC38, MDA-MB-231, MDA-MB-MDA-MB-231, MDA-MB-436 and SUM149PT) and Basal A subtype cell line (BT-20) were obtained from LGC Standards (Middlesex, UK).
Cell culture materials; T-25 and T-75 flask, 100 cm2 cell culture dishes, 5ml and 10 ml serological pipets were purchased from Costar Corning INC (NY, USA) and 6-well,
17
12-well, 96-well plates , cryotubes, 10, 20, 200, and 1000 ul filtered tips for micropipettes were purchased from Greiner Bio-One (NC,USA). Cell culture scrapers were purchased from Sarstedt (Numbrecht, Germany).
Table 2.2: List of reagent used in cell culture.
Reagents Company
RPMI Medium Capricorn Scientific (Ebsdorfergrund,
Germany)
DMEM Lonza (Basel, Switzerland)
Ham’s F12 Medium Lonza (Basel, Switzerland)
Fetal Bovine Serum Capricorn Scientific (Ebsdorfergrund,
Germany)
Trypsin-EDTA HyClone (IL, USA)
L-Glutamine HyClone (IL, USA)
Penicillin-Streptomycin Capricorn Scientific (Ebsdorfergrund, Germany)
Non-essential Aminoacids HyClone (IL, USA)
Insulin-transferrin-sodium selenite media supplement
Sigma-Aldrich (MO, USA)
2.1.3 Cell Culture Solutions and Drugs
Complete Growth Medium (DMEM and RPMI)
10% FBS
1% L-Glutamine
1% Penicillin-Streptomycin
18 Complete Growth Medium (Ham’s F12)
10% FBS
1% Insulin-transferrin-sodium selenite media supplement
1% L-Glutamine
1% Penicillin-Streptomycin
L-Glutamine, FBS and Penicillin-Streptomycin was filtered through 0.2 um Millex-FG syringe filters (Merck Millipore, MA, USA) while adding to medium.
Phosphate Buffered Saline (10X PBS)
80g Sodium Chloride
2g Potassium Chloride
2.4g Potassium Phosphate
14.4g Sodium Phosphate
Bring to 1 liter with ddH2O
10X PBS was firstly diluted to 1X and then autoclaved. 1X PBS was filtered through surfactant-free cellulose membrane serum filter (Thermo Fischer, MA, USA) before use in cell culture.
Freezing Medium
10% DMSO
90% FBS
2.1.4 Datasets
E-MTAB-2706 RNA-seq dataset were downloaded from ArrayExpress
19
consists of 675 commonly used human cancer cell lines. Dataset contains normalized gene expression read counts for all coding and non-coding genes. There are 144 lung cancer cell lines, 100 lymphoid cancer cell lines and breast, ovary, skin colorectal, pancreas, brain, stomach, head-neck, liver, kidney, sarcomatoid, cervix, urinary bladder, uterus cancer cell lines in decreasing number[82]. In this present study, RNA-seq data of breast, colon and skin cancer cell lines for coding and non-coding genes was used to reveal mechanism which controls CT gene expression. Analyzed cell lines are 52 colon, 70 breast and 49 skin cancer cell lines representing CT-poor, CT-moderate and CT-rich tumors respectively.
In this present study, we have used drug data from CCLE which has pharmacologic profiles for 24 anticancer agents across 504 cell lines. We also used drug sensitivity data from Cancer Genome Project (CGP) database. It includes 265 compounds and 1074 cancer cell lines.
20
2.2 METHODS
2.2.1 Cell Culture Techniques
Breast cancer cell lines CAL-51, HBL-100, HCC38, MDA-MB-231, MDA-MB-231, MDA-MB-436, BT-20 and SUM149PT were used in this study. CAL-51, HBL-100, MDA-MB-231, MDA-MB-231and MDA-MB-436 cell lines were maintained with complete growth medium DMEM. HCC38 cell line was maintained with complete growth medium RPMI. SUM149PT cell line was maintained with Ham’s F12 medium which enriched by 10% FBS, 1% L-glutamine, 1% penicillin-streptomycin and 1% Insulin-transferrin-sodium selenite media supplement. These cell lines were incubated at 37oC in the condition of 5% CO2. Before seeding, all cell lines were stored in liquid
nitrogen. To isolate RNA and perform cytotoxicity experiment with these cell lines, cells were taken from nitrogen tank and thawed immediately at 37C in water bath. Before the cell was completely thawed, pre-warmed complete medium was added to cryotubes to complete thawing. Then, cells were taken into 15 ml falcon tubes and centrifuged for 5 minutes at 1200 rpm to pellet cells. DMSO containing freezing medium was removed by aspirator and pellet was re-suspended in 3 ml of complete growth medium, then added to T-25 flask containing 3 ml complete growth medium. After reaching appropriate confluency, cells were passaged and transferred into 100 mm culture dishes and T-75 flasks. Before passaging, growth medium in the flask was removed by aspirator and cells were washed by sterile 1X PBS. Passaging of cells was done by adding pre-warmed 1 ml Trypsin to detach cells from flask surface. Trypsin added flasks were placed into incubator for 5 minutes until detaching was observed. 4 ml complete growth medium was added to flask to inactivate trypsin and cells were dispersed by pipetting up and down. Then, these cells in media were centrifuged to remove media containing trypsin and dead cells. Pellets then were re-suspended in 4 ml complete growth media and added into flask containing 6 ml media. When the cells were reached confluency and required passaging, washing with PBS, detaching by trypsin, inactivation of trypsin, removal of trypsin by centrifugation and transferring into new flask were performed respectively. When experiments were completed, cells
21
were cryopreserved. For cryopreservation of cells, media were removed by aspirator and cells washed by 1X PBS once. After removal of PBS by aspirator, cells were detached by trypsinization by using 1 ml Trypsin. By adding 3 ml growth media, trypsin were inactivated and removed by centrifugation. Pellets were then re-suspended in freezing medium containing 90% FBS and 10% DMSO. Cells in freezing medium were then transferred into cryovials. Cryovials containing cells in 1 ml freezing medium were immediately placed into -20oC then transferred into -80oC. For long term storage, stocks were maintained at liquid nitrogen.
2.2.2 Harvesting of Cells for RNA isolation
All cell lines used in this study were adherent cells. For the collection of cells for RNA isolation, growth medium in T -75 flask containing monolayer, 80-90% confluent cells was removed by aspirator and washed with 1X PBS to discard remained medium and dead cells. Then, 1ml TRIzol reagent was added directly to cells in the T-75 flask per 10 cm2 of surface area. Cells were further detached by cell scratcher and homogenized by pipetting up and down. Homogenized samples in TRIzol reagent were put into eppendorf tubes and stored into -80C for later RNA isolation.
2.2.3 Total RNA Isolation with TRIzol
1 ml homogenized samples stored in -80oC were thawed and incubated for 5 minutes at room temperature to allow complete dissociation of the nucleoprotein complex. After adding 0.2 mL of chloroform to homogenized samples, eppendorfs were shaken vigorously by hand for 15 seconds and then, incubated for 3 minutes at room temperature. Samples were centrifuged at 13000 rpm at 4oC for 15 minutes and upper phases containing RNAs were removed by anfling the tubes and pipetting the upper phases out. Upper aqueous phase was taken into new tube and RNA in samples was precipitated by adding 100% 0.5 ml isopropanol to aqueous phase. There was 10 minutes incubation at room temperature for 10 minutes after addition of isopropanol. Incubated samples were then centrifuged at 13000 rpm for 15 minutes at 4oC. Pellets were visible after this step. Then, pellets were washed with 1 ml 75% ethanol after
22
removal of supernatant. Washing was improved by vortexing tubes. After that, tubes were centrifuged at 10000 rpm for 5 min at 4oC and ethanol was discarded. Pellets were then air dried for 20 minutes. Air dried RNA pellets were then re-suspended in 40 ul of DEPC-treated water. Re-suspended RNA pellets were incubated at 60oC for 15 minutes to dissolve further. RNA samples were stored at -80oC for further experiments.
2.2.4 DNAseI Treatment of Isolated RNA
After phase separation by adding chloroform, upper phases may be contaminated with interphases containing DNA. Elimination of such contaminations was accomplished by DNase treatment using DNA-free kit. RNA samples were firstly diluted to 200 ng/ul. In reaction setup, 4 ul 10X DNase I Buffer and 1 ul rDNase I were added to 40 ul RNA samples. Total reaction volume was incubated at 37oC for 30 minutes in ABI 9700 PCR machine. After incubation, 4.5 ul of pre-mixed DNase inactivation reagent was added into total reaction. Mixing occasionally, reactions were incubated for 2 minutes in room temperatures. With centrifugation for 2 minutes at 13000 rpm, supernatant containing treated RNA was transferred into a fresh eppendorf tube.
2.2.5 RNA Quantification
Isolated RNA from both TRIzol extraction and DNase treated samples were qualified and quantified by NanoDrop One, Merinton Instruments and Qubit RNA BR Assay Kit. With NanoDrop One Instrument, RNA samples were both qualified and quantified applying 2 ul of samples. The instrument has given concentration values by eliminating possible contaminations. Concentrations of RNA samples were also quantified by using Merinton SMA1000 spectrophotometer by applying 2 ul of samples. After DNase treatment, concentrations of RNA samples were quantified by Qubit Fluorometer. To quantify RNA, working solution was firstly prepared by adding 1 ul BR reagent to 199 ul of buffer and then standards were prepared by adding 10 ul of standard 1 and 2 to 190 ul of working solution and RNA samples were prepared by adding 4 ul samples to 196 ul of working solution for every sample. After 2 minutes
23
incubation, quantities of RNA in samples were measured. The concentration of samples was calculated with following equation:
Concentration of sample= QF value x (200/x)
QF was the value given by Qubit 2.0 Fluorometer and x was the amount of the sample in the reaction setup.
2.2.6 cDNA Synthesis
In synthesis, Thermo Scientific Maxima First Strand cDNA Synthesis Kit for RT-qPCR (Cat# K1641) was used . cDNA synthesis reaction was performed as a series of parallel reactions with DNase-treated RNA samples isolated from all cell lines. 2000 ng total RNA template was used per reaction. 8 ul 5X Reaction Mix and 4 ul Maxima Enzyme Mix, 2000 ng template RNA and nuclease-free water were added up to 40 ul of total reaction volume in a sterile PCR tubes. The tubes were gently mixed and centrifuged briefly. Then, the tubes were incubated at 25oC for 30 minutes followed by 15 minutes at 50oC. cDNA synthesis reaction was terminated by heating at 85oC for 5 minutes. Control reactions were performed with reverse transcriptase minus negative controls which contain every reagent except Maxima enzyme mix and no template control which contain all reagents except any RNA template.
2.2.7 qRT-PCR Analysis for CT Gene Expression
qRT-PCR reactions were performed in triplicates for CT genes and duplicates for housekeeping gene in Roche LightCycler 480 II machine. No template control reactions were also performed for each gene. TaqMan Gene Expression Assays used in this study include 4352934E for GAPDH, Hs03805505_mH for PAGE2 and PAGE2B, Hs02387419_gH for SPANXB, Hs04190522_gH for MAGEA3, Hs01057958_m1 for MAGEA1 and Hs00265824_m1 for NY-ESO-1 genes. The reaction mixture is prepared as indicated in the next page.
24
2X TaqMan Gene Expression Master Mix 5 ul TaqMan Primer-probe Mix 0.5 ul Nuclease-free Water 2.5 ul
cDNA 2 ul
Total volume 10 ul
Thermal cycle conditions were indicated below.
Step Time Temperature
UDG Incubation 2 minutes 50oC
AmpliTaq Gold, UP Enzyme Activation 10 minutes 95oC
45 Cycles Denature 15 seconds 95oC
Anneal/Extend 1 minute 60oC
Cooling 1 hour 25oC
The relative gene expression values were calculated by using mean of cycle threshold (CT) values of replicates and using 2-∆∆CT calculation, where
∆∆CT= (CTTarget-CTGAPDH)Sample –(CTTarget- CTGAPDH)Reference
2.2.8 Cell Counting
To seed approximately 5000 cells per well into 96-well plate for drug cytotoxicity experiments, haemocytometer was used to count cells in suspension. Cells were firstly detached by trypsinization and re-suspended in 5 ml of complete growth medium. 10 ul from these cell suspensions were taken into an eppendorf tube and mixed well with 10 ul of trypan blue. After cleaning of haemocytometer and coverslip with 70% ethanol gently, 10 ul of cells stained with trypan blue were loaded into each chamber. The cells in 16-squares in each corner of chamber were counted. Average of four 16-squares was calculated by dividing 4, the value was multiplied with dilution factor 2. Multiplying
25
the final value with 104 was resulted in the approximate number of cells per ml of cell suspension.
2.2.9 Drug Treatment and Luminescent Cell Viability Assay
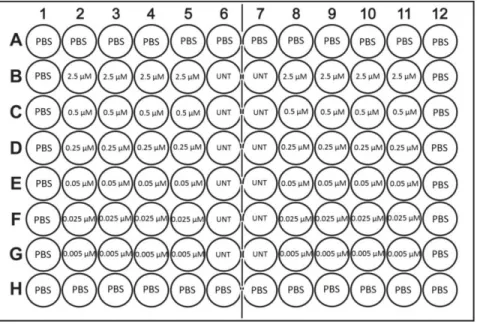
Before drug cytotoxicity experiments, each cell line were cultured in 100 mm culture dishes. After counting with haemocytometer as described previously, 5000 cells/well in 100 ul were seeded into 96 well plates as depicted in Figure 2.1. After a day, cells were treated with different concentrations of Panobinostat, a pan-HDAC inhibitor. Different concentrations of drugs were prepared by using complete growth medium containing 0.1% DMSO. 100 ul of each drug concentrations were loaded quadruplicate for each cell line and incubated for 3 days at 37oC in CO2 incubator. After 3 days, 96-well
plates were taken out and waited for 30 minutes at room temperatures. Then, 30 ul pre-warmed CellTiter-Glo Reagent was added to each well and plates were shaken vigorously as possible for 10 minutes on horizontal shaker. 200 ul of this suspension were transferred to white opaque plate and OD values were measured by using BioTek Synergy HT microplate reader. Measured OD values were used to calculate the cell viability percentage.
26
2.2.10 Calculations of the Half Maximal Inhibitory Concentration (IC50)
Drug cytotoxicity was measured by using CellTiter-Glo Luminescent Cell Viability Assay which is based on quantitation of ATP, an indicator of metabolically active cells. OD values obtained from microplate reader were used to cell viability percentage by using formula given below.
% Cell Viability= (OD value of drug treated well/OD value of 0.1%DMSO treated control) * 100
% cell viability values were then used to construct dose-response curves for each cell lines using GraphPad software. IC50 values for each cell line were analyzed by using GraphPad software.
2.2.11 Software Programs Used in this Study
GraphPad Prism 5.0 was used to construct dose-response curves and analyze half maximal inhibitory concentration. It is also use to draw figures for drug cytotoxicity/CT gene principal component analysis correlation.
2.2.12 Tumors and Adjacent Normal Tissues
All samples used this study were same samples in our previous study [83] obtained from consenting study subjects undergoing surgical tumor resection who signed a written informed consent approved by their respective IRBs.
27
3. RESULTS
3.1 Revealing Mechanisms which Control CT Gene Expression in
Cancer
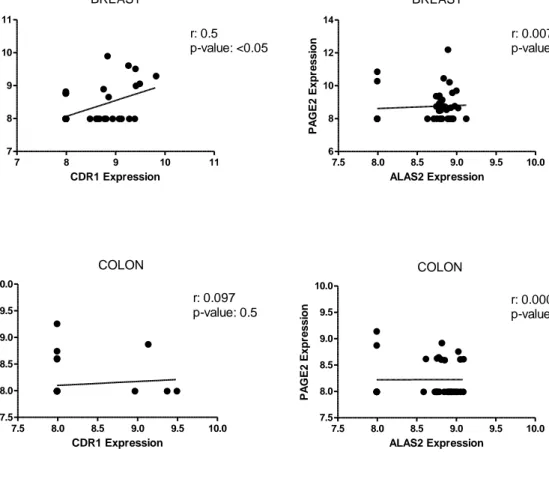
In the first part of this study, we aimed to identify an experimental model whose study could reveal molecular mechanisms leading to epigenetic changes and subsequent activation of cancer testis genes in cancer. In the first model, we tried to extend our previous observations related to two CT-proximal genes, ALAS2 and CDR1 genes, which showed inverse expression patterns, compared to CT genes in cancer cell lines. We checked this inverse correlation in gene expression in 8 tumors and 8 matched healthy tissues. Then, we performed in silico analysis to observe gene expression correlations of CT and CT-proximal genes by using RNA-seq data of breast and colon cancer cell lines. In the second model, we hypothesized that expression levels of CT genes in cancer cell lines can be used to classify cancer cells, whose comparative analysis would help identify mechanisms related to control of CT expression in cancer. For this purpose, cancer cell lines were initially categorized into high, CT-intermediate and CT-low based on their CT gene expression status. In the second step, cell lines were classified based on their epithelial and mesenchymal phenotypes and expression levels of CT genes. With these models, we tried to identify any transcripts that were differentially expressed between these classes and these could help explain mechanisms underlying epigenetic changes and subsequent activation of CT genes.
3.1.1Region Specific Epigenetic Changes Leading to Cancer Testis Gene Expression
Our previous data suggested that those epigenetic changes resulting in expression of CT genes would have to occur within a region in the genome with clear boundaries which would exclude CT proximal non-CT genes. Our group members identified such CT proximal genes using an in silico method involving the CGAP database. Genes that
28
had no expression in cancer cell lines, but had expression in normal healthy tissues were selected. To extend our previous observations related to two such CT proximal genes (ALAS2 and CDR1), and therefore, to validate our earlier findings that were restricted to cell lines and normal tissue, we checked the expression of CT and CT proximal genes in tumor and matched-normal colon tissues (Figure 3.1). In this experiment, we expected to see downregulation of ALAS2 and CDR1 mRNA expression in tumors relatively to normal counterpart. At the same time, we were expecting that expression of CT genes would be upregulated in tumors relative to their normal counterpart. For 3 of tumor and matched normal samples, we observed the expected inverse correlation. However, in the other 5, we could not observe inverse relation between their expression and that of CT genes (PAGE2 and SPANXB). PAGE2 expression, detected in only 2 tumor tissues, was clearly upregulated compared to normal tissues. SPANX-B was detectable in 7 of 8 tumor tissues and was clearly upregulated in 5 tumor tissues. In one case upregulation was present but not obvious, and in one case, tumor proximal tissues showed more SPANX-B expression compared to tumor (#48). ALAS2 expression was clearly detectable in all but two tumors. In 4 tissue pairs, it showed down-regulation in tumors, compared to normal tissues, while it was upregulated in normal tissue compared to tumors in tissues #74 and #126. CDR1 expression was detected in 6 tissues. It was clearly down-regulated in tumors in two tissues, but not in the other 4. However, to our surprise, none but one tumor-pair (#123) showed upregulated CT gene expression concomitant with down-regulated non-CT genes in tumor tissue, compared to its normal counterpart.
29
PAGE2 PAGE2
SPANXBSPANXBALAS2 ALAS2 CDR1 CDR1
0.0 0.5 1.0 1.5 48 R e la ti v e m R N A e x p re s s io n 53 PAGE2 PAGE2
SPANXBSPANXBALAS2 ALAS2 CDR1 CDR1
0.0 0.5 1.0 1.5 TUMOR NORMAL R e la ti v e m R N A e x pr e s s ion 58 PA GE2 PA GE2 SPA NXB SPA NXB ALA S2 ALA S2 CD R1 CD R1 0.0 0.1 0.2 0.3 0.5 1.0 1.5 Re la ti v e m RNA e x p re s s io n 61 PAGE 2 PAGE 2 SPAN XB SPAN XB ALA S2 ALA S2 CDR 1 CDR 1 0.0 0.5 1.0 1.5 Re la ti v e m RNA e x p re s s io n 71 PAGE2 PAGE2
SPANXBSPANXBALAS2 ALAS2 CDR1 CDR1
0.0 0.1 0.2 0.3 1.0 1.5 R e la ti v e m R N A e x pr e s s ion 74 PAGE2 PAGE2
SPANXBSPANXBALAS2 ALAS2 CDR1 CDR1
0.0 0.5 1.0 1.5 TUMOR NORMAL R e la ti v e m R N A e x pr e s s ion 123 PAGE2 PAGE2
SPANXBSPANXBALAS2 ALAS2 CDR1 CDR1
0.0 0.5 1.0 1.5 R e la ti v e m R N A e x pr e s s ion 126 PAGE2 PAGE2
SPANXBSPANXBALAS2 ALAS2 CDR1 CDR1
0.0 0.5 1.0 1.5 R e la ti v e m R N A e x pr e s s ion