DETERMINATION OF MOLYBDENUM BY
ADSORPTIVE CATALYTIC STRIPPING VOLTAMMETRY IN
THE PRESENCE OF ALIZARIN RED S AND PERSULPHATE
Nuri Nakiboglu1,*, Zeki Tünay2 and İbrahim Şahin3
1Balıkesir University, Science and Arts Faculty, Chemistry Department, 10145, Balıkesir-Turkey 2Balıkesir University, Application and Research Center for Environmental Concern, 10100 Balıkesir- Turkey 3Balıkesir University, Necatibey Education Faculty, Chemistry Education Division, 10100 Balıkesir- Turkey
ABSTRACT
An alternative and sensitive method by adsorptive cata-lytic stripping voltammetry for the determination of trace molybdenum is proposed. The method is based on the ad-sorption collection of the Mo(VI)–Alizarin Red S com-plex on a hanging mercury drop electrode (HMDE) follow-ing the catalytic reduction of both Mo(VI) and Alizarin Red S (ARS) in the complex in the presence of persul-phate as oxidizing reagent. The experimental parameters such as accumulation time, accumulation potential, scan rate, pH, concentration of ARS and persulphate were opti-mized. Under the optimized conditions, the relationship between the peak current and molybdenum concentration is linear in the range of 0.15-5.0 µg/L. The detection limit and quantitation limit of the method based on the standard deviation of blank for accumulation time of 30 s were cal-culated as 0.046 µg/L (4.79x10⁻¹⁰ M) and 0.15 µg/L (1.56x 10⁻⁹ M), respectively. The method was applied to the de-termination of molybdenum in drinking water samples. The recoveries for 1 and 3 µg/L molybdenum in the drinking water samples were found as 90% and 93%, respectively. Relative standard deviation for 3 µg/L molybdenum is 2.88%. 100 µg/L As(III), Ni(II) and Zn, 50 µg/L Al(III) did not interfere while serious interference was observed from Sb(III). Voltammetric characteristics and mechanism of the Mo(VI)-ARS-S2O82- system were also investigated. KEYWORDS: Molybdenum, Alizarin Red S, persulphate,
catalyt-ic, stripping voltammetry.
1. INTRODUCTION
Molybdenum is an essential trace element to all living organisms, especially plants [1], animals and humans. How- ever, excess concentrations of molybdenum can cause ad-verse effects. It has been reported that molybdenum con-
* Corresponding author
tent higher than 5 µg/g in plants and equals to 10 µg/g for ruminants can be toxic [2]. The U.S. EPA drinking water health advisories recommended long-term limits of 10 µg/L for children and 50 µg/L for adults and the United Nations Food and Agriculture Organization recommended a maxi-mum level for irrigation water of 10 µg/L.The concentra-tions of molybdenum in human serum have been reported as lower than 1 µg/L while 42.5 µg/L in urine. Whole blood concentrations for most people have been reported as <5 ng Mo/mL. On the other hand, molybdenum contents of sea-water and mineral sea-waters have been reported in the range of 6–20 µg/L and 0.25–1.0 µg/L, respectively [2]. Most natural waters contain low levels of molybdenum in the range of <2–3 µg/L [3]. Therefore, sensitive, selective and precise methods are needed for determination of molyb-denum in industrial, environmental and biological samples.
Various techniques such as ultra-violet visible spec-trophotometry [4], neutron activation analysis [5], flame atomic absorption spectrometry (FAAS) [6], electrothermal atomic absorption spectrometry (ETAAS)[7,8], inductively coupled plasma–atomic emission spectrometry (ICP-AES) [9,10], and inductively coupled plasma– mass spectrometry (ICP-MS) [11-13]. However, these methods have com-mon disadvantages such as the requirement of preconcen-tration and separation steps and high instrument cost. On the other hand, adsorptive catalytic stripping voltammetry (AdCtSV) is a low cost and sensitive technique for deter-mination of metal ions in the complex including molyb-denum.
Numerous AdCtSV techniques based on the adsorp-tive accumulation of a molybdenum complex on to elec-trode surface have been developed for the determination of molybdenum. Various catalytic systems such as dihy-droxynaphthalene-bromate [14], mandelic acid-chlorate [15], methyl thymol blue-chlorate [16], pyrogallol red-chlorate [17], tiron-red-chlorate [18] and pyrocatecholviolet-chlorate [19] have been used. The adsorptive stripping voltammetric methods reported for determination of Mo(VI) have been well listed in the literature[18]. On the other hand, it has been reported that Mo(VI) forms a 1:1
com-plex in 0.1 M acid solution and 1:2 comcom-plex with Alizarin Red S (ARS) in the pH ranges 2-5 [20]. The complex has been used for determination of molybdenum by spectro-fluorimetry [21] and adsorptive stripping voltammetry [22]. The lowest detection limits obtained at mercury electrode and mercury free electrode for an accumulation time of 60 s were reported as 0.006 µg/L (6.25x10⁻¹¹ M) [18] and 0.086 µg/L (9x10⁻¹⁰ M) [22], respectively.
This work presents an AdCtSV method for the deter-mination of molybdenum, using Alizarin Red S (monoso-dium salt of 1,2-dihydroxyanthraquinone-3-sulphonic acid) as ligand and persulphate (firstly used for the determina-tion of molybdenum) as oxidizing reagent. The proposed method is based on the catalytic reduction of Mo(VI)–ARS complex accumulated at the HMDE in the presence of per-sulphate. As the potential is scanned in the negative direc-tion, Mo(VI) in the complex adsorbed on the electrode sur-face is reduced to Mo(V). Then, Mo(V) is immediately oxidized back to Mo(VI) by the persulphate and the cata-lytic cycle resulting in high sensitivity is completed. The proposed method has been applied to determination of molybdenum in different water samples.
2. MATERIAL AND METHODS 2.1. Apparatus and Reagents
The voltammetric measurements were carried out us-ing a Radiometer Pol 150 Polarographic Analyzer in com-bination with a MDE 150 polarographic stand. The ana-lyzer was controlled with Trace Master 5 Software. Three-electrode system consisting of a hanging mercury drop electrode (HMDE) as the working electrode, an Ag/AgCl with saturated KCl as the reference electrode and a platin-ium wire as the auxiliary electrode were used. Hexadistilled mercury (Radiometer-Copenhagen) was used throughout the study for HMDE. WTW pH-meter with combined pH electrode was used for pH measurement. 1x10⁻² M stock solution of ARS was prepared from Fluka. The working solutions were prepared daily. The other chemicals used throughout the study were of analytical grade. All the solutions were prepared with deionized water having the resistivity of 18.2 MΩ.
2.2. Procedure
Twenty five microliters of 5x10⁻⁵ M of ARS and the required amount of Mo(VI) (or water sample) was pipet-
ted into a 10 mL of volumetric flask and completed to the mark with 0.04 mol/L acetate-phosphate buffer at pH 4.25. The solution was transferred to the quartz volt-ammetric cell and nitrogen was purged for 5 min after addition of 100 µL of 0.1 M K2S2O8. A new mercury drop was extruded and then, accumulation on HMDE was per-formed at 0.00 mV by stirring the solution at 400 rpm for 30 s. The stripping was initiated toward cathodic direc-tion and differential puls voltammogram with a potential scan rate of 25 mV/s was recorded. All of the measure-ments were performed at room temperature.
3. RESULTS AND DISCUSSION
3.1. Voltammetric peak characteristics of the Mo(VI)-ARS-per-sulphate system
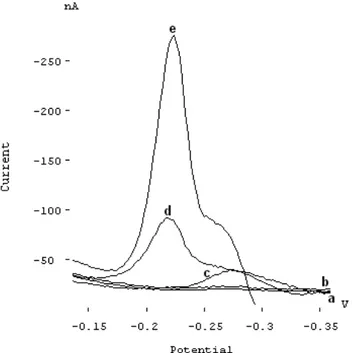
Voltammetric behaviours of Mo(VI)-ARS-persulphate system were summarized in Figure 1. No significant peak was observed when scanning the electrode potential to the negative direction for the solution containing 3 µg/L of Mo(VI) (Fig.1b) in 0.04 mol/L acetate-fosfat buffer at pH 4.25. On the other hand, a cathodic peak at -276 mV vs Ag/AgCl reference electrode was observed for 1.25x10⁻⁷ mol/L of ARS in the absence of Mo(VI) and persulphate in the same conditions (Fig.1c). However, a peak at -214 mV in addition to the peak at -276 mV appears when 3 µg/L of Mo(VI) was added to the solution containing 1.25x10⁻⁷ mol/L of ARS (Fig.1d). Addition of 1x10⁻³ mol/L of per-sulphate causes an increase of the peak current at -214 mV (Fig.1e). This suggests that the reduction of Mo(VI) in the complex is catalyzed by persulphate. Additionally, it is noted that current of the peak at -276 mV increased and the peak at -214 mV also appeared when the persulphate was added to the solution containing ARS alone in 0.04 mol/L acetate-phosphate buffer at pH 4.25(not shown in here). This implies that the reduction of ARS is also catalysed by per-sulphate. On the other hand, it was noted above that Mo(VI) forms 1:2 complex with ARS in the pH ranges 2-5. From all of the information mentioned above, the possible reac-tion mechanism is that the Mo(VI)-(ARS)2 complex formed in the bulk solution was accumulated onto the mercury electrode at 0.0 V. Both Mo(VI) and ARS in the complex are then reduced during the potential scan. At the same time, the reduction products are oxidized back to Mo(VI) and ARS, which formed a catalytic cycle to increase the reduction current. The following catalytic mechanism can be suggested;
0,5 0,52 0,54 0,56 0,58 0,6 0 500 1000 1500 2000 2500 scan rate (mV/s) cu rr en t f un ct io n Ip v-‐ 1/ 2( (µ A .m V 1/ 2 s -‐1 /2 ) 0 100 200 300 400 500 600 2,5 3 3,5 4 4,5 5 pH pe ak c ur re nt (nA )
The catalytic process could be further confirmed by plotting the current function, Ipv1/2, versus potential scan rate, v. The current function of the catalytic peak decreased dramaticly with the increasing potential scan rate in the range of 100-200 mVs-1 then leveled off (Fig.2). This result also confirmed the catalytic process.
FIGURE 1 - Voltammograms representing the behaviour of Mo-ARS-persulphate system. (a) 0.04 mol/L acetate-fosfat buffer at pH 4.25, (b) a+3 µg/L Mo(VI), (c) a+1.25x10⁻⁷ mol/L ARS, (d) c + 3 µg/L
Mo(VI) and (e) d + 1x10⁻³ mol/L S
2O82-, Eacc =0 mV, tacc=30 s.
FIGURE 2 - Dependence of current function on the potential scan rate.
3.2. Effect of pH
The effect of pH on the peak current of Mo(VI)-ARS-persulphate system was studied in the range of 3.0 and 5.0, because no significant signal related to the complex was obtained below pH 3.0. As can be seen in Fig.3, the peak current slightly increases from pH 3.0 and gives a maximum at pH 4.25 and then, decreases by increasing of
pH. A negative shift in the peak potential was observed as the pH increases. Therefore, the optimum pH was selected as 4.25 to carry out subsequent experiments. Additionally, various buffer system at pH 4.25 were tested such as cit-rate, tartacit-rate, acetate, phospate, hydrogen phthalate and acetate-phosphate mixture. Among these, acetate-phosphate mixture (0.04 mol/L of each) was found to be suitable.
FIGURE 3- The effect of pH on the peak current. (10-3 mol/L S 2O82-,
3 µg/L Mo(VI), 1.5x10⁻⁷ mol/L ARS , E
acc=0 mV, tacc=30 s).
3.3. Effect of ARS Concentration
The effect of the ARS concentration on the peak cur-rent of Mo(VI)-ARS-persulphate system was investigated in the range of 5x10⁻⁸-1x10⁻⁶ mol/L of ARS. No signifi-cant peak was obtained for concentration of ARS below 5x10⁻⁸ mol/L. The peak current at -214 mV increases be-tween 5x10⁻⁸-1.5x10⁻⁷ mol/L of ARS concentrations and then decreases at higher concentrations. However, the peak at -214 mV overlaps with the peak at -264 mV for high concentrations of ARS at a concentration of more than 1.5x10⁻⁷ mol/L and the current of the resulting peak in-creases independently from concentration of Mo(VI). This is attributed to the change of the stoichiometry of the Mo(VI)-ARS complex. The result suggests that the con-centration of the ARS is a critical parameter for selectivi-ty and accuracy of the method. Therefore, the concentra-tion of ARS was selected as 1.25x10⁻⁷ mol/L.
3.4. Effect of persulphate concentration
The effect of persulphate concentration on the peak current of Mo(VI)-ARS-persulphate system was investi-gated for the solutions containing 3 µg/L of Mo(VI), 1.25x10⁻⁷ mol/L of ARS in acetate-phosphate buffer. The peak current increased with the increasing persulphate con-centrations from 1.0x10⁻⁴ mol/L up to 1.0x10⁻³ mol/L. The values higher than 1.0x10⁻³ mol/L of persulphate concen-trations, no peak was observed belonging to the catalytic system because of whole oxidation of mercury on the elec-trode by persulphate. For this reason, the persulphate con-centration was selected as 1.0x10⁻³ mol/L.
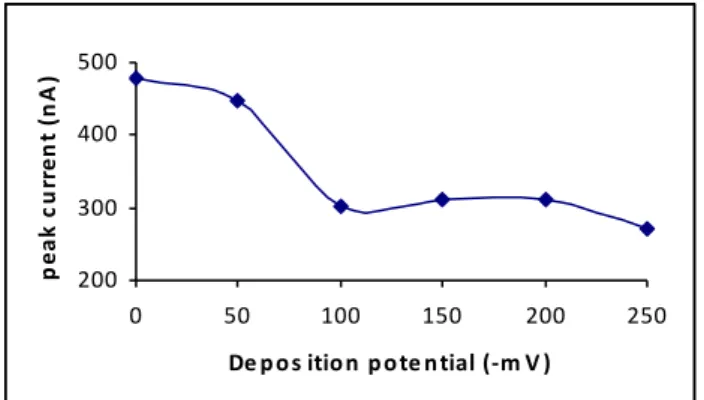
3.5. Effect of accumulation potential
Fig. 3 shows the effect of changes of the accumula-tion potential on the peak current of Mo(VI)-ARS-per-sulphate system. The higher peak current was obtained at the potential of zero charge, suggesting the Mo(VI)-ARS complex is a neutral molecule. The study for positive po-tentials was not performed because of the limitation of the mercury electrode. The accumulation potential, therefore, was preferred as 0 mV. 200 300 400 500 0 50 100 150 200 250
De pos ition pote ntial (-‐m V )
pe ak c ur re nt ( nA )
FIGURE 4 - The effect of accumulation potential on the peak cur-rent. (10-3 mol/L S
2O82-, 3 µg/L Mo(VI), 1.25x10⁻⁷ mol/L ARS, 0.04
mol/L acetate-fosfat buffer ( pH 4.25), tacc=30 s)
3.6. Effect of accumulation time
The effect of accumulation time on the peak current is shown in Fig.4. The peak current increases linearly with accumulation time up to 60 s for 3 µg/L of Mo(VI) and then it tends to level off for the longer accumulation time.
0 100 200 300 400 500 0 20 40 60 80 100 120 140 160 ac c umulatio n time (s )
FIGURE 5 - The effect of accumulation time on the peak current (10-3 mol/L S
2O82-,3 µg/L Mo(VI), 1.25x10⁻⁷ mol/L ARS, 0.04 mol/L
acetate-fosfat buffer (pH 4.25), Eacc=0 mV).
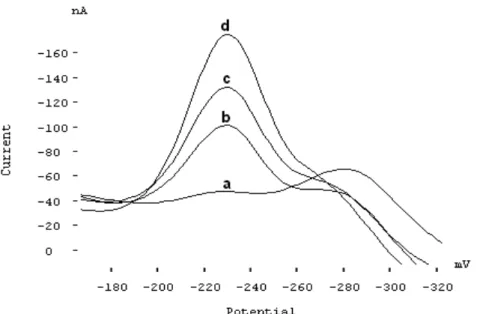
3.7. Calibration plot, detection limit and repeatability
As a result of the studies above, a calibration curve was constructed for determination of Mo(VI). Some voltammo-grams are shown in Fig.6. The curve was linear in the con-centration range of 0.15–5.0 µg/L. The equation of re-gression line was calculated as Ip= 62.9CMo+ 17.4 where Ip is the peak current (in nA) and CMo is the concentration of molybdenum. The coefficient of determination, r2, was 0.9986 (for N=6). The detection limit and quantitation limit of the method based on the standard deviation of blank
(N=9) for accumulation time of 30 s were calculated as 0.046 µg/L (4.79x10⁻¹⁰ M) and 0.15 µg/L (1.56x10⁻⁹ M), respectively. The relative standard deviation of blank solu-tions was calculated as 6.24%.
.
FIGURE 6 - Some voltammograms used for construction of calibra-tion curve (a) blank solucalibra-tion (1.25x10⁻⁷ mol/L ARS, 0.04 mol/L
acetate-phosphate buffer at pH 4.25), (b) 0.25 µg/L Mo(VI), (c) 0.50 µg/L Mo(VI), (d):0.75 µg/L Mo(VI), (e) 1.0 µg/L Mo(VI) and (f) 2.5 µg/L Mo(VI).
3.8. Interference study
The interference from Al3+, As3+, Ca2+, Mg2+, Ni2+, Sb3+, Zn2+, humic acid and Triton-X-100 was studied in the solution containing 1 µg/L of Mo(VI). The tolerance limits were taken as those concentrations causing changes no greater than ±5% in the peak current. It was found that 2 mg/L of Ca2+ and Mg2+,100 µg/L of Al3+, Zn2+, As3+, Ni2+, 0.1 mg/L Triton X-100 and 0.5 mg/L humic acid not interfere while 1 µg/L of Sb3+ causes serious interference. 3.9. Application of the method
The method proposed applied to three different drink-ing water samples and molybdenum was not detected in all of samples. The samples were fortified with molyb-denum and the recoveries obtained were found accepta-ble. Voltammograms recorded for determination of mo-lybdenum by standard addition method in fortified water sample were given in Fig.7. Additionally, accuracy of the proposed method was checked by inductively coupled plasma atomic emission spectrometric (ICP-AES) meas-urement. All of the results obtained are shown in Table 1. Statistical evaluation of the results shows good agreement between the mean concentrations obtained by the two methods in a 95% confidence level.
FIGURE 7 - Standard addition voltammograms obtained for the determination of molybdenum in fortified water samples. (a) blank solution (1.25x10⁻⁷ mol/L ARS, 0.04 mol/L acetate-phosphate buffer at pH 4.25), (b) sample (c) and (d) upon additions of 0.50 µg/L Mo(VI).
TABLE 1 - Determination of molybdenum in water samples. Samples Mo(VI) Added (µg/L) Mo(VI) Found
by proposed method (µg/L±s) Mo(VI)Found by ICP-OES (µg/L±s) % R±s DW1 - <0.046 - - DW1 1 0.90±0.12 - 90±1.2 DW1 3 2.78±0.08 - 93±3.0 DW2 - <0.046 - - DW2* 25 25.4±0.6 25.9±0.3 101.6±2.4 DW3 - <0.046 - -
s:standard deviation for three replicate measurements. *Sample diluted (1:10) for application of the proposed method.
4. CONCLUSIONS
Sensitive and an alternative adsorptive catalytic strip-ping voltammetric method for the determination of mo-lybdenum in the presense of ARS and persulphate was described. The method proposed differs from the other voltammetric method given in the literature in terms of persulphate firstly used as oxidizing agent for the deter-mination of molybdenum. The limit of detection of the method can be improved further by extending the deposi-tion time. Voltammetric characteristics and mechanism of the Mo(VI)-ARS-S2O82- system were also investigated. The method can be applied succesfully to the water sam-ples with satisfactory results.
ACKNOWLEDGEMENTS
This study was financially supported by the Research Project Division of Balıkesir University (contract no: 2008/29). The authors would like to thank the Balıkesir
University Research Center of Applied Sciences for providing laboratory facilities in the scope of this study.
REFERENCES
[1] Kalembasa, S. and Symanowicz, B. (2009) The changes of molybdenum and cobalt contents in biomass of goat’s rue (Galega orientalis Lam.). Fresenius Environmental Bulletin 18 (7), 1150-1153
[2] Pyrzynska, K. (2007) Determination of molybdenum in envi-ronmental samples. Analytica Chimica Acta 590 (1), 40–48. [3] Barceloux, D.G. (1999) Molybdenum. Clinical Toxicology
37 (2), 231–237.
[4] Alkan, M., Kharun, M. and Chmilenko, F. (2003) Spectro-photometric determination of molybdenum with Alizarin Red S in the presence of poly(sulfonylpiperidinylmethylene hy-droxide). Talanta 59 (3), 605-611.
[5] Sun,Y.C., Yang, N.Y. and Tzeng, S.R. (1999) Rapid deter-mination of molybdate in natural waters by coprecipitation and neutron activation analysis. Analyst 124 (2), 421-424.
[6] Boaventura, R.G., Hirson J. R. and Santelli, R.E. (1994) De-termination of molybdenum in silicates by flame atomic ab-sorption spectrometry exploiting activated carbon as collec-tor. Fresenius’ Journal of Analytical Chemistry 350 (10-11), 651-652.
[7] Vinas, P., Campillo, N., Lopez-Garcia, I. and Hernandez-Cordoba, M. (1997) Electrothermal atomic absorption spec-trometric determination of molybdenum, aluminium, chromi-um and manganese in milk. Analytica Chimica Acta 356 (2-3), 267-276.
[8] Bencs, L., Szakacs, O., Kantor, T., Varga, I. and Bozsai, G. (2000) Determination of chromium, molybdenum and vana-dium dopants in bismuth tellurite optical crystals by multi-element graphite furnace atomic absorption spectrometry. Spectrochimica Acta Part B: Atomic Spectroscopy 55 (7), 883-891.
[9] Martynkova, K., Komendova, R., Fisera, M. and Sommer,L. (2004) Solid phase extraction of molybdenum on modified octadecyl silica sorbents in the presence of cationic surfac-tants and on silica-based anionic exchanger and its determi-nation by inductively coupled plasma emission spectrometry. Microchimica Acta 147 (1-2), 65-71.
[10] Agrawal, Y.K. and Sharma, K.R. (2005) Speciation, liquid– liquid extraction, sequential separation, preconcentration, transport and ICP-AES determination of Cr(III), Mo(VI) and W(VI) with calix-crown hydroxamic acid in high purity grade materials and environmental samples. Talanta 67 (1), 112-120.
[11] Pozebon, D., Dressler, V.L. and Curtius, A.J. (1998) Deter-mination of Mo, U and B in waters by electrothermal vapori-zation inductively coupled plasma mass spectrometry. Talan-ta 47 (4), 849-859.
[12] Cava-Montesinos, P., Cervera, M.L., Pastor, A. and de-la-Guardia, M. (2005) Room temperature acid sonication ICP-MS multielemental analysis of milk. Analytica Chimica Acta 531 (1), 111-123.
[13] Reid, H.J., Bashammakh, A.A., Goodall , P.S., Landon, M.R., O’Connor, C. and Sharp, B. L. (2008) Determination of iodine and molybdenum in milk by quadrupole ICP-MS. Talanta 75 (1), 189–197.
[14] Li, H. and Smart, R.B. (1997) Square wave catalytic strip-ping voltammetry of molybdenum complexed with dihy-droxynaphthalene. Journal of Electroanalytical Chemistry 429 (2-3), 169-174.
[15] Yokoi, K. and Van den Berg, C.M.G. (1992) Simultaneous determination of titanium and molybdenum in natural waters by catalytic cathodic stripping voltammetry. Analytica Chim-ica Acta 257 (2), 293-299.
[16] Safavi, A. and Shams, E. (1999) Selective determination of ultra trace concentrations of molybdenum by catalytic ad-sorptive stripping voltammetry. Analytica Chimica Acta 396 (2-3), 215-220.
[17] Ensafi, A.A., Khayamian, T. and Khaloo, S.S. (2004) Appli-cation of adsorptive cathodic differential pulse stripping method for simultaneous determination of copper and mo-lybdenum using pyrogallol red. Analytica Chimica Acta 505 (2), 201-207.
[18] Ensafi, A.A. and Khaloo, S.S. (2005) Determination of trace molybdenum by catalytic adsorptive stripping voltammetry. Talanta 65 (3), 781–788.
[19] Zarei, K., Atabati, M. and Ilkhani, H. (2006) Catalytic ad-sorptive stripping voltammetry determination of ultra trace amount of molybdenum using factorial desing for optimiza-tion. Talanta 69 (4), 816–821.
[20] Csanyi, L.J. (1980) Reactions of molybdate ions with poly-phenol reagents: Determination of molybdenum with Pyro-catechol Violet and Alizarin Red S. Microchimica Acta 73 (2-3), 277-287.
[21] Chimpalee, N., Chimpalee, D., Boonyanitchayakul, B. and Thorburn Burns, D. (1993) Flow-injection spectrofluorimet-ric determination of boron using Alizarin Red S in aqueous solution. Analytica Chimica Acta 282 (3), 643-646. [22] Tyszczuk, K. and Korolczuk, M. (2008) Adsorptive stripping
voltammetric determination of trace concentrations of mo-lybdenum at an in situ plated lead film electrode. Analytica Chimica Acta 624 (2), 232–237. Received: October 28, 2010 Revised: December 30, 2010 Accepted: January 20, 2011 CORRESPONDING AUTHOR Nuri Nakiboglu Balıkesir University Science and Art Faculty Chemistry Department 10145 Balıkesir TURKEY Phone: ++90 0266 612 10 00 Fax: ++90 0266 612 12 15 E-mail: [email protected]