• Sonuç bulunamadı

Modeling and analyzing army air assault operations via simulation

N/A
N/A
Protected

Academic year: 2021

Share "Modeling and analyzing army air assault operations via simulation"

Copied!
134
0
0

Yükleniyor.... (view fulltext now)

Tam metin

(1)

MODELING AND ANALYZING ARMY AIR ASSAULT

OPERATIONS VIA SIMULATION

A THESIS

SUBMITTED TO THE DEPARTMENT OF INDUSTRIAL

ENGINEERING

AND THE INSTITUTE OF ENGINEERING AND SCIENCES

OF BILKENT UNIVERSITY

IN PARTIAL FULFILLMENT OF THE REQUIREMENTS

FOR THE DEGREE OF

MASTER OF SCIENCE

By

Gökhan Virlan

June, 2001

(2)

ii

I certify that I have read this thesis and that in my opinion it is fully adequate, in scope and in quality, as a thesis for the degree of Master of Science.

Assoc. Prof. Ihsan Sabuncuoğlu (Principal Advisor)

I certify that I have read this thesis and that in my opinion it is fully adequate, in scope and in quality, as a thesis for the degree of Master of Science.

Assoc. Prof. Osman Oğuz

I certify that I have read this thesis and that in my opinion it is fully adequate, in scope and in quality, as a thesis for the degree of Master of Science.

Assoc. Prof. Erdal Erel

Approved for the Institute of Engineering and Sciences:

Prof. Mehmet Baray

(3)

ABSTRACT

MODELING AND ANALYSIS OF ARMY AIR ASSAULT

OPERATIONS VIA SIMULATION

Gökhan Virlan

M.S. in Industrial Engineering

Supervisor: Assoc. Prof. Ihsan Sabuncuoglu

June, 2001

It is very important to use combat simulations in personel training and as a scientific decision tool in developed countries. The use of simulation and analysis methodologies gives opportunity to the staff officers and the commanders to foresee the results of their plans and to take some precautions accordingly. Different combat scenarios can be tried without deploying the units to the combat area and getting losts, costs and risks. As one of the most complicated and decisive operation in the way to victory “Air assault operations” are high risk, high payoff operations, that, when properly planned and vigorously executed, allow commanders to take the initiative of the combat area. The use of Air Assault Operations Simulation Model (AAOSM) allows planners: (1) to build models of air assault operations early in the decision process and refine those models as their decision process evolve, (2) perform “Bottleneck analysis” of the preplanned operation using statistical procedures and take some precautions accordingly. (3) perform “Risk management” of the operation before conducting the real one.

AAOSM is created by using ARENA 3.0 simulation program and SIMAN programming languauge.The outputs of the model is analysed using experimental design procedures and the significant factors that are significant to the outputs are analysed. Moreover, the best scenarios are evaluated in different weather and terrain conditions and different refuelling and maintenance configurations.

Key Words: Simulation, Air Assault Operations, Experimental Design, Scientific Decision tool

(4)

iv

ÖZET

KARA KUVVETLERİ UÇARBİRLİK HAREKATININ

MODELLENMESİ VE SİMÜLASYON YOLUYLA

DEĞERLENDİRİLMESİ

Gökhan Virlan

Endüstri Mühendisligi Bölümü Yüksek Lisans

Tez Yöneticisi: Doç.Dr. İhsan Sabuncuoğlu

Haziran, 2001

Gelişmiş ülkelerde harb simülasyonlarının personel eğitiminde ve bilimsel karar destek mekanizması olarak kullanılması günümüzde çok önem kazanmıştır. Karmaşık harekatlarda, simülasyon ve analiz metodlarının kullanılması karargah subaylarına ve komutanlara planlamalarının sonuçlarını önceden görmeye ve sonuçlara göre bazı tedbirler almaya olanak sağlar. Böylece birlikleri harp meydanına çıkarmadan hiç bir zayiata ve masrafa katlanmaksızın ve risk üstlenmeden, değişik muharebe senaryolarının denenmesi sağlanabilir. Uçarbirlik Harekatı da doğru olarak planlandığı ve cesaretle icra edildiği takdirde komutanlara harekat alanının insiyatifini ele geçirmeyi sağlayan yüksek riskli fakat getirisi de ona göre çok önemli olan ve zafere götüren bir harekat şeklidir. Uçarbirlik Harekatı Simülasyon modelini kullanılarak: (1) Komutana, karargah subaylarına ve uygulayıcılara planlama safhasında ve karar verme sürecinde bilimsel karar destek mekanizması olarak yardımcı olunabilir. (2) Planlanan harekat icra edilmeden önce bilgisayar modelinin çıktıları istatiksel metodlarla incelenerek harekatta oluşabilecek darboğazlar önceden görülerek tedbir alınabilmesi sağlanabilir. (3) Değişik senaryolar modele adapte edilerek bir çeşit "Risk Yönetimi " icra edilebilir.

Uçarbirlik Harekatı Simülasyon modeli ARENA 3.0 simülasyon programı kullanılarak ve SIMAN dilinde hazırlanmıştır. Modelin çıktıları deneysel tasarım metodları kullanılarak incelenmekte ve harekatta hangi unsurların daha fazla etkin olduğu belirlenmektedir. Ayrıca değişik hava ve arazi şartlarında, değişik bakım ve ikmal konfigürasyonlarında hangi senaryonun en iyi olduğu incelenmektedir.

Anahtar sözcükler: Simülasyon, Uçarbirlik Harekatı, deneysel tasarım, bilimsel karar destek

(5)

v

To my wife Dilek and my beloved daughter Yaren;

And to the souls of all courageous and bold pilots, technicians and the soldiers who lost their lives and sacrificed their souls in Air Assault Operations for the nation’s undividable unity and for the republic .

(6)

ACKNOWLEDGEMENT

I would like to express my deep gratitude to Assoc. Prof. Dr. İhsan Sabuncuoğlu for his guidance, attention, understanding, motivating suggestions and patience throughout all this work.

I am grateful to the readers for their valuable comments, kindness, and time.

I cannot fully express my gratitude and thanks to my friends and commanders in Army Aviation School, for their support and encouragement. And special thanks to my wife for her moral support and help during the preparation of this thesis.

(7)

Contents

1 Introduction 1

1.1 Air Assault Operations……….………. 1

1.2 Stages of the Army Assault Operations. ………2

1.2.1 The Ground Tactical Plan……….3

1.2.2 The Landing Plan………..3

1.2.3 The Air Movement Plan………4

1.2.4 The Loading Plan………..4

1.2.5 The Staging Plan……….. …4

1.3 Objective of the Study. ………..5

1.4 Thesis Outline……….5

2 Literature Review 7

2.1 Simulation Software and Methodology………...7

2.2 Military Simulation……….9

2.3 Tactical and Combat Simulations………..11

2.4 Air Warfare Simulations………...12

3 The Simulation Model 13

3.1 Formulation of the Problem and Planning the Study………13

3.2 Model Development………..16

3.2.1 Conceptual Model………...17

3.2.2. Flowchart of the System……….……….…...22

3.2.3 Simulation Model (Computer Code)………...28

3.3 Input Data Analysis………...………29

3.4 Model Verification and Validation………..………..29

3.4.1 Verification………..29

(8)

viii

3.4.2.1 Face Validity………...30

3.4.2.2 Statistical Validation ………..30

4 Design and Analysis of Experiments 31

4.1 25 Factorial Designs and Analysis of Experiments on AAOSM………...31

4.2 Departures from Assumptions in Analyses of Variance…………..………...33

4.3 Evaluation of Performance Measures……….……….34

4.3.1 Time in the system Statistics………...34

4.3.2 Time in the Tanker Queue Statistics………...39

4.3.3 Time in the maintenance Queue Statistics………..40

4.3.4 Number of Soldiers Arrived to LZ Statistics………...42

4.3.5 Number of Helicopters Shot During the Operation Statistics……….43

4.4 Diagnostic Checking………...46

5 Implementations of Ranking and Selection Procedures to AAOSM 48

5.1 Introduction...48

5.2 Objective of the Study……….48

5.3 Comparison of the Scenarios with MCPs………51

5.4 Selecting the best system……….53

5.5 Selecting a subset of size m containing the best of k systems………55

5.6 Selecting the m best of k systems ………...56

6 Conclusion 57

6.1 General………...57

6.1.1 Factors effecting the Performance Measures ………58

6.1.2 The best configuration according to weather & terrain conditions.…59 6.2 Concluding Remarks and Future Research Directions………60

(9)

A The Computer Code of AAOSM………62

B The Scatter Plots of the Variances of the Performance Measures………..65

C ANOVA tables of the Performance Measures………..68

D The Scatter Plots of Effects of the Performance Measures………..72

E Analysis of Normal Probability Plots and Effects of Performance Measures…74 F Residual Analysis and Scatter Plots of Performance Measures………...82

G Histograms and P-P Comparison Graphs of Residuals………92

H MCPs and R&S Tables for Different Weather and Terrain Conditions and Performance Measures………94

I Input Data………...113

(10)

x

List of Figures

1.2.1 Stages of the Air Assault Operation ...…..………...…...3

3.2.1 Screen Shot of the Air Assault Operation Model... 17

3.2.2.1 The flowchart of Logical Model………...………..……… 23

3.2.2.2 The flowchart of effects of Weather and Terrain Conditions….………….. 24

3.2.2.3 The flowchart of Helicopter fuel Consumption………. 25

3.2.2.4 The flowchart of Helicopter breakdown considerations……… 26

3.2.2.5 The flowchart of pilot tiredness considerations……… 27

3.2.2.6 The flowchart of effects of enemy air defense weapons………... 27

3.2.2.7 The flowchart of mission accomplishment……… 28

4.3.1.1 Normal probability plot off time in the system statistics………. 37

4.3.1.2 Scatter plots of effects of time in the system statistics……….. 37

4.3.1.3 Main effects of time in the system statistics……….. 38

4.3.2 Main effects of time in the tanker queue statistics……… 40

4.3.3 Main effects of time in the maintenance queue statistics..……… 41

4.3.4 Main and interaction effects number of soldiers arrived to LZ statistics…… 42

4.3.5 Main and interaction effects number of helicopters shot statistics…….…… 43

4.2.1 Scatter plot of variances of time in the system statistics………..65

(11)

4.2.3 Scatter plot of variances of time in the maintenance queue statistics …………..66 4.2.4 Scatter plot of variances of number of soldiers arrived to LZ statistics………...66 4.2.5 Scatter plot of variances of number of helicopters shot statistics……….67 4.3.2.2 Scatter plot of effects of time in the tanker queue statistics………....72 4.3.3.2 Scatter plot of effects of time in the maintenance queue statistics………..72 4.3.4.2 Scatter plot of effects of number of soldiers arrived to LZ statistics…………...73 4.3.5.2 Scatter plot of effects of number of helicopters shot statistics………....73 4.3.2.1 Normal probability plot of time in the tanker queue statistics………..75 4.3.3.1 Normal probability plot of time in the maintenance queue statistics……….77 4.3.4.1 Normal probability plot of number of soldiers arrived to LZ statistics………….79 4.3.5.1 Normal probability plot of number of helicopters shot statistics………...81 4.4.1 Scatter plot of residuals for time in the system statistics………...83 4.4.2 Scatter plot of residuals for time in the tanker queue statistics………..85 4.4.3 Scatter plot of residuals for time in the maintenance queue statistics…………...87 4.4.4 Scatter plot of residuals for number of soldiers arrived to LZ statistics ………...89 4.4.5 Scatter plot of residuals for number of helicopters shot statistics……….91 4.4.6 Histogram of residuals of time in the system statistics………..92 4.4.7 Probability plot of residuals of time in the system statistics………..93

(12)

xii

List of Tables

1 Summary table of related literature...10

4.1 Factors effecting AAOSM...32

4.2 The results of Bartletts test according to performance measures...33

4.3.1.1 Analysis of variance of time in the system statistics...35

4.3.1.2 Analysis of normal P-P plot effects of time in the system statistics...36

4.3.5 Avarage, maksimum and the minumum numbers of helicopters shot ...44

4.3.6 Results of the factors effecting the Performance Measures...45

4.3.2.1 Analysis of variance of time in the tanker queue statistics...68

4.3.3.1 Analysis of variance of time in the maintenance queue statistics...69

4.3.4.1 Analysis of variance of number of soldiers arrived to LZ statistics………70

4.3.5.1 Analysis of variance of number of helicopters shot statistics……….71

4.3.2.3 Analysis of normal P-P plot effects of time in the tanker queue statistics...74

4.3.3.3 Analysis of normal P-P plot effects of time in the maint. queue statistics...76

4.3.4.3 Analysis of normal P-P plot effects of number of soldiers arrived to LZ statistics………..78

4.3.5.2 Analysis of normal P-P plot effects of number of helicopters shot statistics…..80

4.4 Regression models of the performance measures………46

4.4.1 Residual analysis for time in the system statistics………...82

4.4.2 Residual analysis for time in the tanker queue statistics……….84

4.4.3 Residual analysis for time in the maintenance queue statistics………...86

4.4.4 Residual analysis for number of soldiers arrived to LZ statistics………88

4.4.5 Residual analysis for number of helicopters shot statistics……….90

4.5 Chi Square tests for residuals of the performance measures………...47

5.2.1 Scenarios of the AAOSM………50

5.3.1.1 The results of the Tukey test………52

(13)

5.3.1 Tukey test results for time in the system in Cold and sea level………...94 5.3.2 Tukey test results for time in the maintenance queue in Cold and sea level…...94 5.3.3 Tukey test results for time in the tanker queue in Cold and sea level………….95 5.3.4 Tukey test results for number of soldiers landed in Cold and sea level………..95 5.3.5 Tukey test results for time in the system in Hot and High………..96 5.3.6 Tukey test results for time in the maintenance queue in Hot and High………...96 5.3.7 Tukey test results for time in the tanker queue in Hot and High……….97 5.3.8 Tukey test results for number of soldiers landed in Hot and High………..97 5.3.9 Welch approach results for time in the system in Cold and sea level………….98 5.3.10 Welch approach results for time in the maint. queue in Cold and sea level……98 5.3.11 Welch approach results for time in the tanker queue in Cold and sea level……99 5.3.12 Welch approach results for number of soldiers landed in Cold and sea level….99 5.3.13 Welch approach results for time in the system in Hot and High……….99 5.3.14 Welch approach results for time in the maintenance queue in Hot and High...100 5.3.15 Welch approach results for time in the tanker queue in Hot and High………..100 5.3.16 Welch approach results for number of soldiers landed in Hot and High……...100 5.4.1.1 The best systems for particular performance measures...54 5.4.1 Results of D-D procedure for time in the system for Cold and Sea level...101 5.4.2 Results of D-D procedure for time in the maintenance queue for Cold and Sea

level...101 5.4.3 Results of D-D procedure for time in the tanker queue for Cold and Sea

level...102 5.4.4 Results of D-D procedure for number of soldiers landed for Cold and Sea

level...102 5.4.5 Results of D-D procedure for time in the system for Hot and High...103 5.4.6 Results of D-D procedure for time in the maintenence queue for Hot and

High...103 5.4.7 Results of D-D procedure for time in the tanker queue for Hot and High...104 5.4.8 Results of D-D procedure for number of soldiers landed for Hot and High...104 5.5.1.1 The subset of 4 containing the best of 16 systems for particular performance

(14)

xiv

5.5.1 Results of D-D procedure for time in the system for Cold and Sea level...105

5.5.2 Results of D-D procedure for time in the maintenance queue for Cold and Sea level...105

5.5.3 Results of D-D procedure for time in the tanker queue for Cold and Sea level...106

5.5.4 Results of D-D procedure for number of soldiers landed for Cold and Sea level...106

5.5.5 Results of D-D procedure for time in the system for Hot and High...107

5.5.6 Results of D-D procedure for time in the maintenence queue for Hot and High...107

5.5.7 Results of D-D procedure for time in the tanker queue for Hot and High...108

5.5.8 Results of D-D procedure for number of soldiers landed for Hot and High...108

5.6.1.1 The 4 best of 16 systems for particular performance measures...56

5.6.1 Results of D-D procedure for time in the system for Cold and Sea level...109

5.6.2 Results of D-D procedure for time in the maintenance queue for Cold and Sea level...109

5.6.3 Results of D-D procedure for time in the tanker queue for Cold and Sea level...110

5.6.4 Results of D-D procedure for number of soldiers landed for Cold and Sea level...110

5.6.5 Results of D-D procedure for time in the system for Hot and High...111

5.6.6 Results of D-D procedure for time in the maintenence queue for Hot and High...111

5.6.7 Results of D-D procedure for time in the tanker queue for Hot and High...112

5.6.8 Results of D-D procedure for number of soldiers landed for Hot and High...108

6.1 Factors efecting the performance measures...58

6.1.2.1 The best configurations according to Cold and Sea level...59

(15)

Chapter 1

Introduction

1.1 Air Assault Operations

Army aviation and infantry units can be fully integrated with other members of the combined arms team to form powerful and flexible air assault task forces that can project combat power throughout the entire depth, width, and breadth of the modern battlefield with little regard for terrain barriers. The unique versatility and strength of an air assault task force is achieved by combining the capabilities of modern rotary-wing aircraft - speed, agility, and firepower - with those of the infantry and other combat arms to form tactically tailored air assault task forces that can be employed in low-, mid-, and high-intensity environments.

Air assault operations are those in which assault forces (combat, combat support, and combat service support), using the firepower, mobility, and total integration of helicopter assets, maneuver on the battlefield under the control of the ground or air maneuver commander to engage and destroy enemy forces or to seize and hold key terrain. Air assault operations are not merely movements of soldiers, weapons, and materiel by Army aviation units. They are deliberate, precisely planned, and vigorously executed combat operations designed to allow friendly forces to strike over extended distances and terrain barriers to attack the enemy when and where he is most vulnerable.

An air assault task force provides commanders with truly unique capabilities. They can extend the battlefield, move, and rapidly concentrate combat power like no other available forces. Specifically, an air assault task force can attack enemy positions from any direction, conduct deep attacks and raids beyond the forward line of own troops using helicopters, rapidly place forces at tactically decisive points in the battle area, bypass enemy positions, conduct operations under adverse weather conditions and at night to facilitate deception and surprise.

(16)

There are some limitations for the air assault operations. An air assault task force relies on continuous helicopter support throughout any air assault operation. The helicopters may be limited by adverse weather, extreme heat and cold, and other environmental conditions such as blowing snow and sand that limit flight operations or helicopter lifting capability. Hostile aircraft, air defense, and electronic warfare action, availability of suitable landing zones (LZ) and pickup zones (PZ), high fuel and ammunition consumption rates are also limitations for the air assault operations.

An air assault task force uses the helicopter to move to and close with the enemy. Initial assault elements must be light and mobile. They are often separated from weapon systems, equipment, and materiel that provide protection and survivability on the battlefield. Thus, an air assault task force is particularly vulnerable to enemy attack by aircraft and air defense weapon systems.

1.2 Stages of The Air Assault Operation

Successful air assault execution is based on a careful analysis of (Mission, Enemy, Terrain, Troops Available-Time) METT-T and detailed, precise reverse planning. Five basic plans that comprise the reverse planning sequence are developed for each air assault operation. They are:

• The ground tactical plan. • The landing plan.

• The air movement plan. • The loading plan. • The staging plan.

These plans should not be developed independently. The ground tactical plan is normally developed first and is the basis from which the other plans are derived. Figure 1.2.1 describes the basic stages of the air assault operations schematically.

(17)

Loading

Loading

zone.

zone. Return Flight Route

Return Flight Route

OBJECTIVE

OBJECTIVE

Loading Loading zone zone Aviation unit Aviation unit Infantry unit Infantry unit Control Control point point Starting Starting point. point. Landing Landing zone zone Landing Landing zone zone Ground tactical Ground tactical plan phase plan phase Landing Landing phase

phase Air movementAir movementphasephase

Loading Loading phase phase Staging Staging phase phase

Figure 1.2.1:Stages of the Air Assault Operation

1.2.1 The Ground Tactical Plan

The foundation of a successful air assault operation is the commander's ground tactical plan, around which subsequent planning is based. The ground tactical plan specifies actions in the objective area to ultimately accomplish the mission and address subsequent operations.

1.2.2 The Landing Plan

The landing plan must support the ground tactical plan. This plan sequences elements into the area of operations, ensuring that units arrive at designated locations and times prepared to execute the ground tactical plan. The availability, location, and size of potential LZs are overriding factors. The air Assault task force is most vulnerable during landing. Elements must land with tactical integrity and be prepared to fight in any direction immediately.

(18)

1.2.3 The Air Movement Plan

The air movement plan is based on the ground tactical and landing plans. It specifies the schedule and provides instructions for air movement of troops, equipment, and supplies from PZs to LZs. It also provides coordinating instructions regarding air routes, air control points, and aircraft speeds, altitudes, and formations. When operations involve multiple lifts from the same PZ, a lift table is prepared to ensure lifts are properly organized. The staff prepares Air movement table which consists of:

• Aircraft allocations,

• Number and type of each aircraft in each serial,

• Departure point, route to and from the loading area, and loading, lift–off, and landing times.

It is a basic scheduling process that the infantry units and the aviation units come together to accomplish the air movement plan. It is also very important to achieve the ground tactical plan. If it is not punctual, the commander will have some mishaps and difficulties to get the objective.

1.2.4 The Loading Plan

The loading plan is based on the air movement plan. It ensures that troops, equipment, and supplies are loaded on the correct aircraft. Unit integrity is maintained when aircraft loads are planned. However, assault forces and equipment may be cross-loaded so that command and control assets, all types of combat power, and a mix of weapons arrive at the LZ ready to fight. The loading plan should receive command attention to ensure that it goes smoothly. It is imperative for mission success that loading operation must be well planned and properly executed.

1.2.5 The Staging Plan

The staging plan is based on the loading plan and prescribes the arrival time of ground units (troops, equipment, and supplies) at the PZ in the proper order for movement. Loads must be ready before aircraft arrive at the PZ; usually, ground units

(19)

are expected to be in PZ posture 15 minutes before aircraft arrive. The staging plan also restates the PZ organization, defines flight routes to the PZ, and provides instructions for linkup of all aviation elements.

1.3 Objective of the study

Air assault Operations are very important operations that the modern army commanders want to implement. The Turkish Army has a big and modern fleet of helicopters and capable of performing succesful Air Assault Operations. There are many ongoing projects about purchasing modern helicopters and changing the organizational structure of the Army to perform such kind of operations.

The exact planning, organization and the proper execution are the keywords to the success in Air assault operations. It is a fact that the combat area is not predictable and always has stochastic events. The use of helicopters gives a great initiative and power to the commander. However, it is a risky operation that when fails, may result in the loss of many soldiers and helicopters. By studying this subject, we want to show the capabilities and the bottlenecks of the preplanned operation to the commanders and make use of the simulation model a kind of a decisionmaking tool. We think the model will help the commanders to analyze their plans before conducting the real operation. By doing so, they will foresee the results of their plans and take some precautions accordingly. Next, we will explain the basic stages of the air assault operation.

1.4 Thesis Outline

The rest of the thesis is organized as follows. Chapter 2 presents the related literature with the simulation software and methods; the requirements of military simulation modeling; general applications that are being used in the United States Army. Chapter 3 describes the Air Assault Operations Simulation Model (AAOSM). Chapter 4 interprets design and analysis of experiments by showing the numerical results. Chapter 5 presents the output data analysis that evaluates and interprets the results of the simulation models related with ranking and selection. In this chapter, the results are shown numerically and graphically, and then the interpretations of these

(20)

results are given. Chapter 6 gives the concluding remarks; ideas and suggestions for future work are also listed. Appendices provide the computer codes, outputs and summary tables used in the thesis.

(21)

7

Chapter 2

Literature Review

During our literature survey we have not come up with any research that is directly related with this study. There are some studies in the U.S. but they are not open to public due to security reasons. Thus, we cannot get any detailed information about these researches. Instead, we present references about methodology and the military simulation related with our study in three groups. We mainly focus on how they deal with the subject, what types of pitfalls they face and what are the significant outcomes of their studies.

2.1. Simulation Software and Methodology

We used the basic principles, which are stated, in Banks (1998) throughout our study. The fundamentals of the modeling methodologies, brief information about the use of simulation and a stepwise logic for all phases of simulation are covered in this study.

ARENA software is selected as appropriate simulation software because of its flexibility and easiness. This software allowed us to animate the model and analyze the outputs effectively. Takus and Profozich (1997) explain the software and its capabilities in their tutorial.

Balci (1989), Law (1991), Banks (1996) and Sargent (1998) discuss how to assess the acceptability and credibility of simulation results, principles and techniques of simulation validation, verification and testing. After describing validation techniques they discuss conceptual model validity, model verification, operational validity, data validity. Shannon (1981) discusses and offers tests for the verification and validation of computer models. Whitner and Balci (1998), describes some guidelines for selecting and using simulation model verification techniques.

(22)

8

Kleijnen (1999) explains the statistical techniques to validate simulation models depending on the type of the data available. He explains three different cases as no data, only output data, both input and output data and gives some examples about them.

Kelton (1997), Centeno and Reyes (1998), Alexopoulos and Seila (1998) and Sanchez (1999) all study on the procedures, techniques about the simulation output analysis. Seila (1992) reviews some advanced aspects of methods for analyzing data produced by simulations.

Kelton (1999) introduces some of the ideas, issues, challenges, solutions and opportunities in deciding how to experiment with a simulation model to learn about its behavior. Hood and Welch (1992) discuss experimental design issues in simulation and give examples from semiconductor manufacturing. Montgomery (1992) thoroughly discusses the design and analysis of experiments in his book. He introduces factorial designs, regression analysis, response surface methods and designs and gives examples about them.

Goldsman and Nelson (1998) present screening, selection, and multiple comparison procedures that are used to compare systems design via computer simulation. They describe methods for three broad classes of problems: screening a large number of system designs, selecting the best system, and comparing all systems to a standard. Bechhofer, Santner and Goldsman (1995) discuss design and analysis of experiments for statistical selection, screening and multiple comparisons. Gray and Goldsman (1988) present a real world application of a ranking and selection procedure for selecting the best of a number of competing systems. Their example involves the selection of an airspace configuration, which minimizes airspace route delays. Swisher and Jacobson (1999) presents a survey of the literature for two widely-used statistical methods for selecting the best design from among of a finite set of k alternatives: ranking and selection and multiple comparison procedures. Boesel (2000) discusses a method that uses initial sample data to choose between statistical procedures for identifying the simulated system with the best (maximum or minimum) expected performance. The method chooses the procedure that minimizes the additional number of simulation replications required to return a pre-specified probability guarantee.

(23)

9

2.2. Military Simulation

In this study, we mainly focus on Air Assault operations. Our survey is limited with the papers and conference proceedings published in the scientific literature considering the confidentiality of this particular subject. The existing studies are classified as shown in Table 1. During this survey, we particularly focus on to how they use the input data, how they validate the model and how they implement the particular scenarios. In order to gain some insight about the future use of the model we also analyzed the impacts of the studies on the decision making process of the Armed forces.

Smith (1998) identifies the essential techniques necessary for modern military training simulations. A brief historical introduction; discussions of system architecture; multiple interactive training simulations; event and time management; distributed simulation; and verification, validation, and accreditation are provided.

Page and Smith (1998) provide an overview of military training simulation in the form of an introductory tutorial. Basic terminology is introduced, and current trends and researches focus in the military training simulation domain are described. Perla (1990) presents the art of war gaming discussing the backbones of the procedures and techniques.

Roland (1998) categorizes the military simulation as engineering models, analyses models and training models in the panel “The future of military simulation”. Today’s major modeling and simulation opportunities and challenges and major problems in the current state of modeling and simulation development and use are discussed in the panel. Hartley (1997) discusses the difficulties, ways and cost of the military simulation model validation and verification. He compares the other simulation models with the military ones in terms of validation, verification and accreditation.

2.3. Tactical and Combat Simulations

Krueger (1992) discusses the pitfalls in Combat simulations. He confines the discussion to staff training simulations, specifically two simulations within the family of

(24)

10

Table 1. Summary table of related literature

CLASSIFICATION PUBLICATION SUBJECT

Takus and Profozich

(1997) ARENA software tutorial

Balci (1989), Law (1991), Banks (1996), Sargent (1998)

Simulation Validation Verification and Testing

Simulation Shannon (1981) Tests for Verification and Validation of models

Software and

Methodology Klejinen (1999) Statistical techniques and data availability

Kelton (1997), Centeno & Reyes (1998), Alexopoulos & Seila (1998), Sanchez (1999)

Procedures, techniques about the simulation output analysis

Hood & Welch (1992),

Montgomery (1992) Design and Analysis of experiments

Goldsman & Nelson (1998) Bechhofer et. Al (1995), Swisher & Jacobson (1999), Boesel (2000)

Screening Selection and Multiple Comparison procedures

Smith (1998) Essential techniques for military modeling and

simulation

Page and Smith (1998) Overview of military simulation training

Military Roland et. al (1998) Panel: The future of military simulation

Simulation Perla (1990) Procedures and techniques of war gaming

Hartley (1997) Verification and validation in militarysimulations

Henry (1992) Corps Battle Simulation

Tactical & Combat

Simulations Blais (1994) Marine Tactical Warfare Simulation

Garrabrants (1998), Sawyers (1998), Martin (1999)

Tactical development systems of warfare Simulations

Krueger (1992) Pitfalls in Combat Simulations

Haeme et. al (1988) Airline performance modeling to support

schedule development Hurst and Flynn (1999)

ADVOCATE (Air Defense Verification of Options by Computer Analysis of Target Engagement)

Air Warfare

Simulations McKay Laube (1988)

Major techniques used in Search and Rescue (SAR) model

Rubin & Sowers (1988) Air Operations Modeling in a War gaming Environment

Litko & Carter (1991) A model to support decisions on employment of aircrews in Desert Storm Operations

Briggs et. al (1995) A model to plan mass tactical airborne Operations

(25)

11

simulation (FAMSIM); the Corps/Battle Simulation (CBS) and the Brigade/Battalion Simulation (BBS).

Henry (1994) describes the techniques use to transform Corps Battle Simulation. The U.S. Army as a standard tool for training commanders and their staff establishes the corps Battle Simulation during the mid 1980’s. The need for the training tools that support emerging missions such as Low Intensity Conflict, multi-factional scenarios, Operations Other Than War, and joint and combined training remodeled the model for new visions.

Blais (1994) provides an overview of the Marine Tactical Warfare Simulation (MTWS) system hardware and software, including basic design philosophy, exercise control concept, and combat modeling approach. This simulation is the next generation training system for the U.S Marine Corps. It is designed to support training of tactical commanders and their staffs in various exercises.

Garrabrants (1998) proposes “an expansion of simulation systems’ role to support all levels of command and control functioning, especially staff planning after receipt of orders and mission rehearsal” in his study. He explains how Marine Tactical Warfare Simulation (MTWS), an advanced simulation system, is used to model all aspects of combat (air, land, sea, and amphibious ship-to-shore activities) and gives detailed information about its usage.

Sawyers (1998) discusses the evolving analytic modeling capabilities of the Marine Corps. He describes the new Mission Area Analysis process to identify operational requirements and deficiencies.

Martin (1999) describes a concept for tactical development system that allows the analyst to study the tactics, to vary the order of steps without having to break open the model each time. This methodology for modeling tactics and procedures uses a component based system written in EXTEND TM from Imagine that Inc.

2.4. Air Warfare Simulations

Haeme, Huttinger and Shore (1988) provide Airline performance modeling to support schedule development. They study the problem of flight schedules, burden on air traffic control, airport facilities and develop a model for that problem.

(26)

12

Hurst and Flynn (1999) describe the ADVOCATE (Air Defense Verification of Options by Computer Analysis Of Target Engagement) land based air defense simulation program. The key features of the simulation program are given together with a description of how weapon systems and threats have been modeled.

McKay Laube (1988) gives a case study description of the major techniques used in the design of a Search and Rescue (SAR) model, how the methods contribute to the flexibility, and how these software engineering principles relate to a formal methodology that has been proposed specifically for simulation development.

Rubin and Sowers (1988) presents air operations modeling in a war-gaming environment. The Air Operations system compromises the user interface, models, and the data structures for representing the deployment and control of Naval air assets within the war game.

Litko and Carter (1991) describe a model, which was widely used to support decisions on employment of aircrews in Desert Storm Operation. They describe the Desert Storm scenario and define the components of the airlift system and the rules for its operation. Next they describe the model and its inputs and outputs. Then they discuss the application of the model to specific decisions and the validation of model results.

Zahn, Stute and Clark (1995) summarize a joint study by the U.S. air Force that models aerospace support equipment usage during a deployment of fighter aircraft. The model explains the present role of the equipment, and introduces a possible alternative.

Briggs, Mollaghasemi and Sepulveda (1995) develop a hybrid analytical/simulation model to plan for mass tactical airborne operations. This automated tool enables the user to properly load aircraft according to the mission and user specifications, so that the minimum amount of time is required to seize all assigned objectives.

(27)

Chapter 3

The Simulation Model

3.1. Formulation of the Problem and Planning the Study

It is a well-known fact that no other force can match Army aviations ability to rapidly project the force and build combat power in the battlefield. On the other hand, training and defense budgets are always constraints to military staff. It is a “must” to be well trained and well prepared for the combat while staying within the budget considerations. We think the use of the simulation and statistical procedures analyzing the operations will help these aspects.

The air assault operations simulation model is developed to:

• Allow planners to build models of air assault operations early in the decision process and refine those models as their decision process evolve.

• Permit accurate and efficient modeling of the capabilities, limitations and vulnerabilities of the air assault operations especially from the Army Aviations point of view.

• Perform “Bottleneck analysis” of the preplanned operation using statistical procedures.

• Perform “ Risk management” for the operations before conducting the real exercises.

By using this model; the commander and the staff officers can accurately and efficiently examine the behavior of the system, establish the nature of the relationships among one or more significant factors and the systems’ responses, analyze the results gotten from the software and perform “bottleneck analysis” for a given scenario. They can have the ability to select the best alternative by using the certain statistical procedures according to their performance measures and decision variables. This research is intended to have a positive effect on decision process of the staff that plans such kind of operations and affective risk management for the decision maker. By using this simulation model we try to answer the following questions:

(28)

• Does the system operate properly? (Do the troops arrive at the landing points on their schedule?) .

• If not, what are the critical factors to be examined, changed, added or omitted? • Is there a need to change the constructions of the facilities of the system? • Are the routes safe enough against effectiveness of enemy air defense weapons

according to planned scenario?

In order to answer above questions, the model is capable of evaluating a wide variety of performance measures. These are:

• Time in system for the helicopters • Time in queue in the refueling area

• Number of helicopters waiting in refueling area • Number of helicopters that failed during the operation

• Number of helicopters that needed maintenance during the operation • Time in queue in the maintenance area

• Number of helicopters waiting in maintenance area

• Number of helicopters that are hit by the enemy air defense weapons • Utilization of helicopters

• Utilization of refueling tankers • Utilization of maintenance facilities • Punctuality on the preplanned schedule • Utilization of flight route

• Utilization of return flight route

Since our system considers the war conditions, we had the difficulty of obtaining the data that fits into the real conditions. In the simulation model we need the following data:

• Velocity of the helicopters • Loading capacity of a helicopter • Loading time of a helicopter • Critical fuel level for a helicopter

• Critical weather conditions for an operation

• Critical ” mission abort “ or ” mission failed” level for the number of helicopters hit by the enemy air defense weapons

(29)

• Hitting percentages for particular enemy air defense weapons • Number of units to be air assaulted

• Number of control points in the flight routes • Unloading time of a helicopter

• Refueling capacity of a tanker • Refueling time of a tanker

• Maintenance capacities for particular breakdowns • Maintenance times for particular breakdowns • Pilot tiredness factors

The data used in the model is analyzed in the input data analysis section. The warfare related data are mostly taken from the publications of the army, which are the statistics gathered from the past experiences.

This study helps to see how the system operates, how the behavior of the system changes under certain conditions, and what are the bottleneck areas in the system. The end user of this study is the Turkish Army Aviation System. By using the model the user can make decisions and evaluations on the system by way of sensitivity analysis. The model can be easily adapted to model other scenarios with more details using the flexibility of adding and subtracting some of these modules of ARENA software to develop the model. The model enables the user to see the system behavior physically with the help of animation features. The limitations of the model mostly come from the size of the system. Due to the difficulty of gathering the quality data, time limitation the AAOSM only deals with the Loading, Air movement and the Landing phases of the operation and assumes that Staging phase is conducted properly beforehand.

The simulation procedure has stochastic in its nature just like the battlefield. It may help us to model the operations with almost all its features. There are several unpredictable and stochastic factors in the air assault operations. These are:

• Enemy disposition and capabilities • Enemy ground and air capabilities

• Hit rate of the guns for both enemy and the friendly troops • Punctuality of the troops

• Intelligence

(30)

• Reloading and refueling considerations of the helicopters • Terrain

• Weather conditions

3.2. Model Development

To be able to simulate the essence of the system, the conceptual model is first formed after the interviews with the experts of the real system and the users, then the logic model and the computer model are constructed. As a schematic view of model development is:

3.2.1. Conceptual Model

The AAOM is capable of implementing different scenarios under different: • Weather and terrain conditions

• Enemy air defense conditions

REAL WORLD SYSTEM SIMULATION MODEL ASSUMED SYSTEM CONCEPTUAL

(31)

You can see a screen shot of the AAOM below:

Figure 3.2.1: Screen shot of the Air Assault Operation Model

The assumptions of our model are:

• There is no escort mission by the friendly attack helicopters • The operation under consideration is offense.

• There is no hindrance by the enemy attack helicopters and jetfighters during the operation.

• The infantry units only consist of soldiers; there are no additional operational packages.

• There are no restrictions at the pick up and the landing zones. • There is no SAR (Search and Rescue) mission during the operation.

(32)

• There are no enemy electronic countermeasures to hinder the flight of the helicopters.

• There are no friendly, artillery, naval artillery and air force support for the operation.

• The pilots don’t make any pilotage mistakes throughout the operation

• All the helicopters taking part in the operation are S-70 Sikorsky type utility helicopters.

AAOSM is capable of collecting many different statistics but we concentrated on the main statistics according to the scenarios we tested. These are:

• Time in the system: the time of the soldiers from the pick up zone until they land at the landing zone.

• Time in the maintenance queue • Time in the tanker queue

• Number of the soldiers that are able to arrive to landing zone • Number of helicopters shot during the operation

It is a terminating system according to the criteria’s below: • If all the soldiers arrive to the landing zone

• If a total of 20 helicopters are shot by enemy

• If a total of 20 helicopters are withdrawn from the operation due to pilot fatigue

• If a total of 20 helicopters are out of operation due to 4th type of breakdown (that needs overall maintenance in the rear area)

These criteria’s can be changed according to the commander’s risk decisions. The input probability distributions and the variables change according to which scenario is under consideration.

Enemy air defense conditions:

We have 5 different checkpoints in the flight route and 5 different checkpoints in the return flight route. The user can input different air defense weapons on these check points according to the intelligence reports. We used typical intensity air weapons (infantry weapons, turrets and small rockets) and inputted them to 4th, 5th,

(33)

LZ, 6th and 7th control points with certain probabilities. The AAOSM first checks if there may be an enemy weapon on the control point or not then with certain probability it engages a weapon to the helicopter, which is checking the control point. Again with certain probability the engaged weapon hits the helicopter or misses it (PH –probability of hit). If the weapon hits the helicopter, with another probability (PK-probability of kill) it makes the helicopter down or not. If the helicopter is downed, we assume that all the soldiers are killed. If not the helicopter continues its flight. The probability distributions are taken from the database of the JANUS (http://www-leav.army.mil/nsc/famsim/janus/index.htm) software.

Weather and terrain conditions:

AAOSM consists of five different weather and terrain conditions, which are • Hot weather and High Terrain

• Hot weather and Sea level • Cold weather and High Terrain • Cold weather and Sea level

• Night flight with Night Vision Goggles (NVG)

These conditions affect the probabilities of breakdowns occurrence for helicopters, the repair times of these breakdowns. Furthermore user can apply the particular scenario in Night Vision Goggles conditions that effects of enemy air defense weapons. For example, in Hot and High condition the breakdown and the maintenance times are worse than the Cold and Sea level condition but they are better than Night Vision Goggles conditions.

Maintenance Facilities:

We have different number of maintenance stations in the AAOSM. In these stations the helicopter technicians try to repair the helicopters that need to be repaired. The model consists of 4 different types of breakdowns for the helicopters. They occur stochastically within the model and repaired according to their repair time.

Refueling tankers:

The helicopters can fly at most 2 hour and 15 minutes. Then they have to refuel in order to continue the operation. For this reason, the tankers are located in the

(34)

rear operation area. Tankers are capable of refueling at most 21 helicopters with full depot and then it takes a certain time for a tanker to go and refuel its depot. Furthermore, they are affected by certain breakdowns with some probability distribution.

Pilot tiredness:

A pilot can fly at most 8 hours according to Army regulations and flight manuals. After this period he must rest for a certain period of the time in order to fly again. In AAOSM, if a pilot exceeds 8 hours of flight limit, he and his helicopter is automatically withdrawn from the operation. This feature is included in the model to show the decision makers if any bottleneck occurs in the number of pilots or not. Furthermore, due to physical stress and hardness in the environmental conditions a pilot can fly at most 4 hours in the Night Vision Goggles (NVG) flight conditions.

Events:

The events that occur during the model are the followings: • Arrival of infantry unit to pick up zone

• Arrival of helicopters to pick up zone • Loading of units to the helicopters

• Departure of the helicopters from the pick up zone

• Hitting or missing of a helicopter by an enemy air defense weapon • Arrival of the helicopters to the landing zone (LZ)

• Deployement of the units from the helicopters • Returning of helicopters to the Pick up zone • Going for the refuelling

• Breakdown of a helicopter • Maintanence of a helicopter • Exceeding pilot tiredness factors

• Mission failure due to heavy air defense • Mission accomplishment

Entities:

(35)

Activities:

• The move of helicopters • Refuelling

• Breakdowns • Hittings • Maintenance

• Mission failure due to heavy air defense

Attributes:

• Helicopter flight hours for pilot tiredness considerations • Helicopter fuel level

• The beginning time of flight

Exogeneous Variables (Input Variables):

• Number of helicopters • Number of Infantry units

• Number of tankers at the refueling points

• Capacity of tankers (number of helicopters to be served at one time) • Number of maintenance units

• Capacity of maintenance units • Loading capacity of helicopters • Velocity of helicopters

• The distances between Pick up zone and the Landing zone • Hitting percentages of the enemy air defense weapons • Weather and terrain conditions

Endegenous Variables (Output Variables): State variables:

• Number of helicopters waiting in the refuelling queues • Number of helicopters waiting in the maintanence queues • State of the tanker units (busy or idle)

(36)

Starting and Stopping time:

Start at a scheduled time Stop when;

• All the infantry units are brought to the LZ

• Mission is failed due to heavy air defense (20 helicopters are shot by enemy air defense)

• Mission is failed due to pilot fatique (20 helicopters are withdrawn from the operation due to pilot fatique)

• Mission is failed due to breakdowns (20 helicopters need overall maintenance at the rear area)

Note that the commander according to his risk decisions can change the stopping criterias.

3.2.2 Flowchart of the system

We present flowchart of the model in Figure 3.2.2.1. The staging phase of the air assault operation is assumed to be implemented beforehand. The model performs several checks at the beginning. These checks are important for the change of the parameters and decision of the stopping criteria. According to the attributes and the variables the entities get at those checkpoints, they are sent to the other parts of the model.

In the Figure 3.2.2.2 effects of the weather and terrain conditions are presented. The model decides the breakdown ratio for helicopters, maintenance times for the particular breakdowns, and the information about the refueling tankers. The following figures are the flowcharts of the helicopter fuel consumption, breakdowns, pilot fatique and enemy air defense conditions. At last, the model checks for the accomplishment of the mission. If the mission is not over yet, the helicopters return to the LZ via return flight route for the next sortie.

(37)

Effects of weather and terrain conditions (A)

Helicopter fuel consumption (B)

Helicopter breakdown considerations (C) CHECK 1

Pilot tiredness considerations (D)

CHECK 2 Effects of Enemy Air Defense Weapons (E) CHECK 3 Mission accomplishment check (F)

Figure 3.2.2.1:The flowchart of the Logical Model Infantry Convoy rides to

Pick up zone

Helicopter Convoy rides to Pick up zone

Infantry units are loaded to helicopters

Infantry units dismount from the helicopters

Helicopters land at the Pick up zone Helicopters apply terrain flight procedures according to terrain and enemy weapons while flying in the flight route

Helicopters return to pick up zone via return flight route

(38)

CHECK 1

(A) Effects of weather and terrain conditions

YES NO YES NO YES NO YES NO YES

Figure 3.2.2.2:The flowchart of effects of Weather & Terrain Conditions

Differentiate the weather and terrrain conditions

Is it HOT and HIGH?

Soldiers loaded to the helicopters(SLH)=18 Helicopters Breakdown ratio(HBR)=HBR*1.6

Maintanence times for particular breakdowns(MTFH)=MTFH Refueling Tankers Breakdown ratio(TBR)=TBR*1.5

Refueling Tankers maintanence times for particular brekdowns(MTFT)=MTFT*1.5 Is it HOT and SEA LEVEL? Is it COLD and HIGH?

Soldiers loaded to the helicopters(SLH)=18 Helicopters Breakdown ratio(HBR)=HBR*1.6

Maintanence times for particular breakdowns(MTFH)=MTFH Refueling Tankers Breakdown ratio(TBR)=TBR*1.2

Refueling Tankers maintanence times for particular brekdowns(MTFT)=MTFT*1.2

Soldiers loaded to the helicopters(SLH)=18 Helicopters Breakdown ratio(HBR)=HBR*1.2

Maintanence times for particular breakdowns(MTFH)=MTFH*1.5 Refueling Tankers Breakdown ratio(TBR)=TBR*1..7

Refueling Tankers maintanence times for particular brekdowns(MTFT)=MTFT*1.3

Is it COLD and SEA LEVEL?

Soldiers loaded to the helicopters(SLH)=18 Helicopters Breakdown ratio(HBR)=HBR*1.2

Maintanence times for particular breakdowns(MTFH)=MTFH*1.2 Refueling Tankers Breakdown ratio(TBR)=TBR*1.7

Refueling Tankers maintanence times for particular brekdowns(MTFT)=MTFT*1.3 Is It a Night Operation? With Night Vision Goggles (NVG)

Soldiers loaded to the helicopters(SLH)=18 Pilot tiredness factor(PTF)=PTF*2.7

Helicopters Breakdown ratio(HBR)=HBR*1.3

Maintanence times for particular breakdowns(MTFH)=MTFH*3 Refueling Tankers Breakdown ratio(TBR)=TBR*1.5

Refueling Tankers maintanence times for particular brekdowns(MTFT)=MTFT*3

Effects of air defence weapons(EADW)=EADW*0.4 CHECK B

(39)

(B) Helicopter fuel consumption YES NO YES NO NO YES

Figure 3.2.2.3:The flowchart of Helicopter fuel Consumption

Helicopter flies to refuelling area

Helicopter is refueled

Wait in the queue until it’s idle.

CHECK C Is the fuel level of

helicopter enough for the next sortie

CHECK C Is there any other

helicopter being refueled?

Is the refueling tanker down?

Wait until the tanker gets repaired

(40)

(C) Helicopter breakdown considerations

NO

YES

NO

Figure 3.2.2.4:The flowchart of Helicopter breakdown considerations

Helicopter flies to maintenance area

Helicopter is repaired

Wait in the queue until it’s idle. Are there any kind of breakdowns at

the helicopter? CHECK D

Are there any other helicopters being repaired?

(41)

(D) Pilot tiredness considerations

NO

YES

Figure 3.2.2.5:The flowchart of pilot tiredness considerations

CHECK 2

( E) Effects of enemy air defence weapons

YES

NO

Figure 3.2.2.6:The flowchart of effects of enemy air defense weapons

Continue operation

Continue operation with one less number of helicopters

Continue operation

STOP!

(Operation failed due to heavy enemy air defence)

Does the pilot exceed daily flight hour limit?

Are the 20 helicopters destroyed by the enemy air defence weapons?

(42)

CHECK 3

(G) Mission accomplishment check

YES

NO

Figure 3.2.2.7: The flowchart of mission accomplishment

3.2.3. Simulation Model (Computer Code)

We use ARENA software (http://www.arenasimulation.com) since it is a flexible and powerful tool that allows us to create graphical and animated models easily and offers reasonably good simulation input and output process.

The computer codes occupy 4083 KB, 530 SIMAN lines, and one run takes approximately 30 seconds according to the stopping criteria we explained above. We present some parts of the computer code due to confidentiality of the subject studied. For the computer codes of model and experimental frame of the model, one can refer to Appendix A.

STOP!

(Mission acommplished)

Continue operation

Infantry units are loaded to helicopters Are there any

other infantry units left to fly?

(43)

3.3. Input Data Analysis

We consider the war conditions and have no opportunity to experience and collect data in real life. As Smith (1998) recommends we use triangular and uniform distributions in the absence of data. The parameters of the distributions are determined by interviewing with the personnel who are experienced pilots, technicians and maintenance chief pilots. Some of the data are taken from the army field manuals that are written according to the war experiences. Since the data taken from that manuals are not raw data and certain numbers we used them for the minimum, average and maximum values of the triangular distribution. In the future applications, as we gather new data, the input data analysis techniques discussed in Law and Kelton (1991) can be used to fit correct distribution functions to the data set. The input data is presented in Appendix I.

3.4. Model Verification and Validation

Considering the principles Balci (1989) stated we performed the Verification and Validation (V&V) techniques for all steps of our study from the beginning.

3.4.1. Verification

“Computerized model verification ensures that the computer programming and implementation of the conceptual model are correct.” We apply the techniques that Banks (1998) recommended. Specifically,

• We use ARENA debugger function with the logic flow together to see whether the events occur properly or not. It helps us to monitor the simulation as it progresses. • We test our model for the different and extreme conditions to observe whether the

model behaves reasonable.

• Since ARENA has the capability of collecting most of the statistics automatically we have the chance to observe the outputs easily. Besides, we use different output statistics that are verifying the other statistics (total time in system and partial time in some activities, queues and utilization etc.)

(44)

• Since we use animation in our models, we see the movements of the entities toward the system that ensures the model verification.

• We check our computer model by other analysts.

3.4.2. Validation

3.4.2.1. Face Validity

A model with face validity is the model that, on the surface, seems reasonable to people who are knowledgeable about the system under study. It includes conversations with system experts, observations of the system, experience and intuition. (Law and Kelton, 2000)

From the beginning of the study we include the users in the process of model development. Thus, we assure that the model behaves as expected in the real conditions. Since we have no opportunity to observe the real conditions we consulted with the instructor pilots of the Army Aviation School. The model, assumptions and the results are presented to them in a formal meeting. Moreover, two maintenance pilots from the 901 Army Aviation Depot are included to validate the maintenance parts of the model. In tactical considerations and the planning phase of the operation a staff officer who is both pilot and the planner of such kind of operations take a part. At last the commander of the Army Aviation School and his staff are included in face validity. They find the results reasonable and quite satisfactory.

3.4.2.2. Statistical Validation

We could not do the statistical validation because of a lack of data from actual war conditions.

(45)

31

Chapter 4

Design and Analysis of the Experiments

4.1. 2

5

Factorial Designs and Analysis of Experiments on the

AAOSM

One of the principal goals of experimental design is to estimate how changes in input factors affect the results, or responses, of the experiment. While these methods were developed with physical experiments in mind (like agricultural or industrial applications), they can easily be used in computer- simulation experiments as described in Law and Kelton (2000). In fact, using them in simulation presents several opportunities for improvement those are difficult or impossible to use in physical experiments. As a basic example of such techniques, suppose that we can identify just two values, or levels, of each of input factors. There is no general prescription on how to set these levels, but we should set them to be opposite in nature but not so extreme that they are unrealistic. If you have k input factors, there are thus 2 k different combinations of the input factors, each defining a different configuration of the model; this is called a 2 k factorial design.

Factorial designs are widely used in experiments involving several factors where it is necessary to study the joint effect of the factors on a response. By a factorial design we mean that in each complete trial or replication of experiment all possible combinations of the levels of the factors are investigated.

The most important of these special cases is that of k factors, each at only two levels. These levels may be qualitative, such as two values of temparature, pressure or queue discipline, or they may be quantitative such as two machines, the high and low values of a factor, or perhaps the precense or absence of a factor. A complete replicate of such a design requires 2k observations and is called 2k factorial design. In factorial design we assume that :

• the factors are fixed

• the designs are completely randomized • the usual normality assumptions are satisfied

(46)

32

In our study we will try to study the effects of the main factors in Air Assault Operation Model (AAOSM) according to our performance measures, and will attempt to find out the answer for the following question :

“What effects do the factors have on the performance measures?”

In our analysis we have 5 different factors with two different values which are:

Table 4.1:Factors effecting AAOSM

FACTOR

NUMBER FACTOR DESCRIPTION -1 +1

1 Number of tankers 2 4

2 Size of the maintenance facilities 3 5

3 Queue discipline for maintenance FIFO LVF 4 Weather and terrain conditions Cold and seal level Hot and High 5 Enemy air defense conditions Typical Severe

Note that the factors (1) and (2) are quantitative in nature but the factors (3), (4), (5) are qualitative factors. For example, for the factor (5) we increase the probability of the hit data of the enemy air defense weapons by 20 % and called it “severe air defense”. Our performance measures are as follows:

• Time in the system • Time in the tanker queue • Time in the maintenance queue

• Number of soldiers arrived to Landing Zone (LZ) • Number of helicopters that are shot during the operation

In order to achieve the assumptions above we replicated 32 design point 20 times using ARENA 3.0 software with different seeds.

(47)

33

4.2. Departures from Assumptions in Analyses of Variance

The assumption of homogeneity of variance may cause serious problems in ANOVA tests. The treatments may have different variances if they produce erratic effects, or if the data follows a nonnormal skewed distribution, because the variance in a skewed distribution is usually related to the mean. There are a number of statistical procedures that may be used to test for inequality of variance. Here we present Bartlett’s test (Montgomery 1992). Suppose that there are treatments, and we wish to test the hypothesis H0:σ = 12 2 2 σ =...= 2 a σ

H1: above not true for at least one σi2

The test procedure uses a statistic whose sampling distribution is approximated by the chi-square distribution with a-1 degrees of freedom when the random samples are from independent normal populations. Therefore, we should reject H0 if

2 1 , 2 0

χ

α a

χ

.

We applied the Bartlett’s test to see if our assumption of common variance is true or not. The results indicate that we cannot reject the null hypothesis that the sample variances are equal (Table 4.2). The scatter plots of the variances of the particular performance measures are also given in Appendix B.

Table 4.2:The results of Bartletts test according to performance measures PERFORMANCE MEASURES TIME IN THE SYSTEM TIME IN THE TANKER QUEUE TIME IN THE MAINTENANCE QUEUE SOLDIERS ARRIVED TO LZ NUMBER OF HELICOPTERS SHOT 2 0

χ

-2843,92 -538,300 -4032,684 -4771,104 -472,380 2 1 ,a− α

χ

14 14 14 14 14 DO NOT REJECT DO NOT REJECT DO NOT REJECT DO NOT REJECT DO NOT REJECT

(48)

34

After checking the validity of the ANOVA asumptions, we calculate the contrasts and the main and the interaction effects of the factors of the five different performance measures and performed ANOVA to find out which factor and the interactions are significant on that performance measure. In a design with 5 factors we have 5 main effects, 10 two-factor interactions and 10 tree-factor interactions. That for a 25 design the complete model would contain 31 effects. To estimate an effect or to compute the sum of squares for an effect, we must first determine the contrast associated with that effect. Once the contrast for the effects have been computed, we may easily estimate the effects and compute the sum of squares.

4.3. Evaluation of the Performance Measures

We begin evaluation of the performance measures by analyzing the ANOVA results. We validate the findings of the ANOVA by plotting effect estimates on the normal probability plot and by analyzing the scatter plot of the effects according to the factors. We give the methodology of our analysis in detail for only the first performance measure. The plots and details of other performance measures are given in Appendices C, D, and E. We now explain the results for each performance measure in the following sections.

4.3.1. Time in the System Statistics

Time in the system is the interval between the time a soldier arrives to the PZ and the time he lands on the LZ. In Table 4.3.1.1, we present the ANOVA results. The results indicate that factor 4 (weather and terrain conditions) is the only significant factor.

Şekil

Figure 3.2.2.1:The flowchart of the Logical ModelInfantry Convoy rides to
Figure 3.2.2.2:The flowchart of effects of Weather & Terrain Conditions
Figure 4.3.4: Main and Interaction effects of number of soldiers arrived to LZ statistics
Figure 4.3.5:Main and Interaction effects of number of helicopters shot during the operation statistics
+7

Referanslar

Benzer Belgeler

However, as discussed below, if one would assume that chances of new calls would vary according to some city-like 24-hour day pattern, a dispatching policy could send the idle

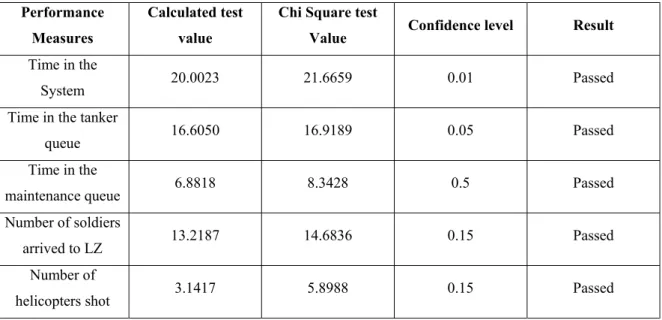
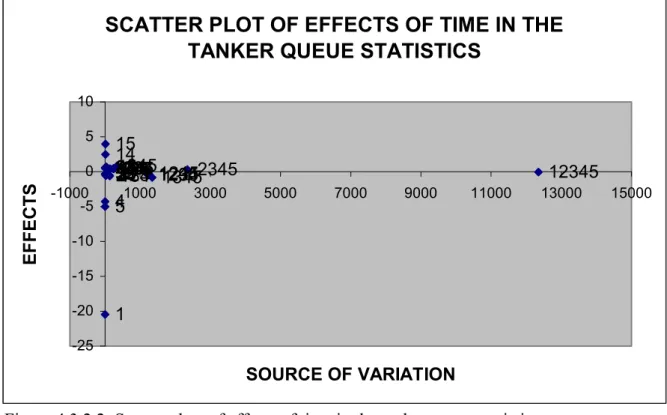
• When there are hostile aircrafts in the operation area, the number of expended missile does not change significantly for the same firing policy and missile kill probability,

so in that scenario, state A sovereignty is itself a limitation to state B powers to act , the concept is being limited by factors such as “globalisation”

You w ill have exciting relaxing hours afloat in Marmara waters by Kamera private luxiourous Yatch Tours... Engine ( twin )

Baig ile birlikte binlerce mil yol kat ederek İsmailiye, Port Said, Süveyş, Tanta, İskenderiye’yi ve ayrıca Hindistan birliklerinin kamplarını ziyaret eden Ağa Han’ın

Bazı adımlarda sonlu fark metodu daha iyi sonuçlar vermesine rağmen genel olarak bakıldığında adomian ayrışım metodu ve homotopi pertürbasyon metodu ile

example, a cheerful music for a murder scene, which may be indicating the character’s deviant feelings or may be it is put there just to make the audience feel

Ama erkek-kadın eşitliğinde yeşeren, erkeğin kadına bir meta gözüyle bakmadığı, sadece, onu kadını, çocuklannm annesi, yemeğini pişiren bir insan gözüyle