Molten Salt Assisted Self Assembly (MASA): Synthesis of Mesoporous
Metal Titanate (CoTiO
3
, MnTiO
3
, and Li
4
Ti
5
O
12
) Thin Films and
Monoliths
Civan Avcı,
†Aykut Aydın,
†Zeynep Tuna,
†Zelal Yavuz,
†Yusuke Yamauchi,
‡,§,∥Norihiro Suzuki,
⊥and Ömer Dag*
,††Department of Chemistry, Bilkent University, 06800 Ankara, Ankara, Turkey
‡World Premier International (WPI) Research Center for Materials Nanoarchitectonics (MANA), National Institute for Materials
Science (NIMS), 1-1 Namiki, Tsukuba, Ibaraki 305-0044, Japan
§Faculty of Science and Engineering, Waseda University, 3-4-1 Okubo, Shinjuku, Tokyo 169-8555, Japan
∥Institute for Superconducting and Electronic Materials (SEM), Australian Institute for Innovative Materials, University of
Wollongong, North Wollongong, NSW 2500, Australia
⊥International Center for Young Scientists (ICYS) National Institute for Materials Science (NIMS) 1-2-1 Sengen, Tsukuba, Ibaraki
305-0047, Japan
*
S Supporting InformationABSTRACT: Mesoporous metal titanates are very important class of materials for clean energy applications, specifically transition metal titanates and lithium titanates. The molten salt assisted self-assembly (MASA) process offers a new synthetic route to produce mesoporous metal titanate thin films. The process is conducted as follows: first a clear solution that contains two solvents (namely the hydrated salt (Co(NO3)2· 6H2O or Mn(NO3)2·6H2O, or LiNO3·xH2O, and ethanol), two surfactants (cethyltrimethylammonium bromide, CTAB, and 10-lauryl ether, C12EO10), an acid and titanium source
(titanium tetrabutoxide, TTB) is prepared and then spin or spray coated over a substrate to form a thin or thick lyotropic liquid crystalline (LLC)film, respectively. Finally, the films are converted into transparent spongy mesoporous metal titanates by a fast calcination step. Three mesoporous metal titanates (namely, CoTiO3, MnTiO3, and Li4Ti5O12) have been successfully synthesized and structurally/thermally characterized using microscopy, spectroscopy, diffraction, and thermal techniques. The mesoporous cobalt and manganese titanates are stable up to 500°C and collapse at around 550 °C into nanocrystalline Co3O4− TiO2and Mn2O3−TiO2; however, lithium titanate is stable up to 550°C and crystalline even at 350 °C. The crystallinity and pore size of these titanates can be adjusted by simply controlling the annealing and/or calcination temperatures.
■
INTRODUCTIONThe melting point of metal salts can be reduced significantly in a confined space - known as the confinement effect - such that they may act as solvents in a self-assembly process.1Organizing surfactants into lyotropic liquid crystalline (LLC) mesophases by using molten salts can be beneficial in the production of new materials for clean energy applications.2,3 Recently, we have demonstrated that the molten phase of salts can be used as a solvent in the synthesis of mesoporus metal oxide modified silica2as well as titania.3This process was introduced as molten salt assisted self-assembly (MASA).2,3 The MASA is a useful process in producing materials that are difficult to produce using known synthesis techniques, and it can be regarded as a new synthetic route. Two solvents and two surfactants are needed in this self-assembly process. Thefirst solvent is volatile and is used to homogenize the mixture of the ingredients to produce a clear solution,2,3 and the second solvent is a salt,
which organizes the mixture into an LLC mesophase upon evaporation of the first one.3 Simply, a clear solution of a mixture of all the ingredients (salt, surfactants, water (or ethanol), polymerizing agent) can be spin coated over a substrate to form a thin film. Further polymerization of the polymerizing component (silica or titania source) takes place in the self-assembled soft media. The MASA process allows for efficient and homogeneous contact between the polymerizing silica or titania and the salt ions. The spin coated fresh samples are usually stable and remain in their LLC phase for a short time; therefore, they need to be heat treated shortly after coating to convert them into mesoporous thinfilms. We also need two surfactants in this self-assembly process; one of the Received: August 16, 2014
Revised: September 26, 2014 Published: September 29, 2014
surfactants is a nonionic surfactant (usually oligo(ethylene oxide) surfactants) that forms the LLC phases of salt-surfactants,4 and the second surfactant is a charged surfactant that enhances the salt content and further stabilize the salt-surfactant LLC mesophases.5 By using the MASA route, we have already developed mesoporous silica coated metal oxides (such as CdO and ZnO that can be as thin as 1.6 nm)2 and metal titanates (such as Zn2TiO4 and CdTiO3)3 that can be effectively converted into sulfides and selenides for various purposes.3,6Note also that there are a limited number of works in the literature regarding the synthesis of mesoporous metal titanates3,7−16 by using soft-templating methods.17 The syn-thesis of metal oxides have been recently reviewed by several authors,17,18 including methods that use ionic liquids as solvents.19These materials need to be explored for new clean energy applications. For this reason, effective and easy processes are needed.
Note also that the soft-templating processes of metal titanates are limited to large surfactants (triblock or diblock copolymers) that usually produce mesoporous materials with thicker pore-walls with smaller surface area.16,17,20 No small surfactant soft-templating method exists for the synthesis of mesoporous metal titanates in the literature.16 Also note that the metal titanates form at high temperatures (250−350 °C). However, the mesostructure formation is usually a low temperature process (typical room temperature to tens of degree), and it is mostly applicable to metal precursors that can be hydrolyzed and polymerized at low temperatures, like metal alkoxides. Therefore, new approaches are needed to overcome these synthetic issues, where the MASA process2,3offers some advantages over the other methods and can be used for the synthesis of some of the metal titanates.
Lithium ions are also very important for applications such as ion conducting gel-electrolytes21−24 and lithium ion bat-teries.16,25−34The formation of LLC mesophases using lithium salts can also be beneficial in the development of liquid crystalline gel-electrolytes34 as well as in the development of lithium ion containing mesoporous metal oxides.16,29−34 Note that many lithium metal oxides have been used as anode or cathode materials in lithium ion batteries.16,25−34There are also few investigations regarding the synthesis of these materials as mesoporous powders.16,29−34 The major motivation, behind these investigations, is to increase the capacitance of these materials for better battery performances. However, inves-tigations of the porous versions of these materials are still limited, and as yet there are still no examples using thin films.16,29−34Designing lithium ion conducting solid hosts can
be beneficial in the developments of fast ion conductors in various clean energy applications.
In this work, we demonstrate that the MASA is a useful process that can be used to produce mesoporous thinfilms of CoTiO3, MnTiO3, and Li4Ti5O12. Thefilms were characterized, and their thermal and structural properties were investigated using PXRD, Raman, FT-IR, and UV−visible absorption spectroscopy, N2-sorption, SEM, and TEM techniques.
■
EXPERIMENTAL SECTIONMaterials. All the reagents used in this investigation were purchased from Aldrich and used as received.
Preparation of Clear Solutions of the Precursors of CoTiO3
and MnTiO3. Clear solutions of all the ingredients for 4 Co(II) (or 4
Mn(II)) to 4 Ti(IV) were prepared as follows (these ratios are per C12EO10): put 291 mg of CTAB and 931 mg of [Co(H2O)6](NO3)2
(or 803 mg of [Mn(H2O)6](NO3)2) in a 25 mL vial, then add 9 mL of
ethanol, and stir the mixture on a magnetic stirrer until the mixture becomes clear. Then add 500 mg of C12EO10drop by drop (melt the
surfactantfirst). Stir the mixture for another 5 min. Add 500 mg of 70% HNO3and stir for another 5 min to ensure a homogeneous clear
solution. Finally, to this clear solution, add 1090 mg of TTB and stir the mixture for an additional 15 min.
For the other compositions, we varied the amount of salts and TTB as follows: for the M(II)/Ti(IV) (M is Co or Mn) ratios of 2/7, 3/7, 4/7, 5/7, 6/7, and 7/7, the amount of TTB was increased to 1908 mg and the [Co(H2O)6](NO3)2 amount was 466, 698, 1164, 1397, and
1629 mg, respectively, and the [Mn(H2O)6](NO3)2amount was 402,
602, 803, 1004, 1205, and 1405 mg, respectively. The quantities of the surfactants, acid, and ethanol were the same as in the 4/4 M(II)/ Ti(IV) samples.
Preparation of Clear Solution of the Precursors of Li4Ti5O12.
Put 291 mg of CTAB, 221 mg of LiNO3, and 9 mL of ethanol in a 25
mL vial and stir it over a magnetic stirrer until the solution is clear. Then add 500 mg of C12EO10and stir the mixture for 5 min. To the
above solution 500 mg of 70% HNO3 was added and stirred for
another 5 min. Finally, 1360 mg of TTB was added, and the solution was stirred for another 15 min.
Preparation of CoTiO3, MnTiO3, and Li4Ti5O12Thin Films. Put
a few drops from each of the above solutions (separately) over a substrate that is already installed on a spin coater and spin the sample at 1500 rpm for 10 s. This produces gel-like thinfilms. Then insert the films straight into a preheated oven and carry out the calcination for 20 min. Once complete,first cool the oven to 200−300 °C and then remove the samples for analysis. Calcination has been performed at different temperatures between 350 and 600 °C using 50 °C increments.
Preparation of CoTiO3, MnTiO3, and Li4Ti5O12Powders by
Spray Coating. To produce large quantities of the samples, we also developed a spray coating method. The above clear solutions were separately spray coated over precleaned glass substrates using pressurized dry air until the glass slide was covered. Then thefilms were immediately inserted into a preheated oven and calcined for 30 min. The calcined samples were removed from the oven after cooling and scraped into a vial. Calcination was carried at a desired temperature, and some samples were calcined at 350 °C and then scraped from the glass slides and annealed at different temperature (at 400, 450, 500, and 550°C) for 2 h to evaluate the thermal properties of the samples.
Instrumentations. The micro-Raman spectra were recorded on a LabRam confocal Raman microscope with a 300 mm focal length. The spectrometer was equipped with a Ventus LP 532, 50 mW, diode pumped solid-state laser operator at 20 mW, with a polarization ratio of 100:1, a wavelength of 532.1 nm, and a 1024× 256 element CCD camera. The signal collected was transmitted via afiber optic cable into a spectrometer with 600 g/mm grating. The Raman spectra were collected by manually placing the probe tip on the desired point of the sample over the glass or silicon wafer. The FTIR spectra were recorded between 400 and 4000 cm−1using a Bruker Tensor 27 model FTIR spectrometer, equipped with a Digi Tect TM DLATGS detector and a resolution of 4.0 cm−1. The spectra were recorded using the samples coated over silicon wafers. The UV−vis absorption spectra were recorded on a Cary 5 UV−vis spectrophotometer using thin films, coated over quartz substrates. The XRD patterns were recorded on a Rigaku Miniflex diffractometer using a high power Cu−Kα source operating at 30 kV/15 mA. The samples were spin coated over microscope slides and measured before and after calcination. The powder samples were packed into glass sample holders, and the PXRD patterns were collected at small (1 to 5°) and wide angles (10 to 80°). The OM images were obtained in transmittance mode on a ZEISS Axio Scope A1 polarizing optical microscope. The SEM images were recorded using Hitachi HD-2000 STEM in SEM mode and ZEISS EVO 40. The high resolution transmittance electron microscope (HRTEM) images were recorded on a JEOL JEM 2100F at an operating voltage of 200 kV. The calcinedfilm samples were scraped and ground in a mortar using ethanol and then dispersed using a
sonicator for 10 min. One drop of the dispersed ethanol solution was put on a TEM grid and dried over a hot-plate. The N2 (77.4 K)
sorption measurements were performed with a TriStar 3000 automated gas adsorption analyzer (Micrometrics) in a relative pressure range, P/P0, from 0.01 to 0.99. To provide high accuracy
and precision in the determination of P/P0, the saturation pressure P0
was measured over 120 min intervals. The powder samples, which were obtained by scraping approximately 10 glass slides of the spray coated thickerfilms, were dehydrated under a (∼10−2Torr) vacuum for 3 h at 250°C before measuring in order to remove adsorbed water and volatile species in the pores.
■
RESULTS AND DISCUSSIONIn this work, we have synthesized 3 different mesoporous metal oxide thinfilms as well as powders using the MASA approach, namely CoTiO3, MnTiO3, and Li4Ti5O12. Each salt system has been optimizedfirst in the solution phase and then in the gel-phase (fresh spin or spray coated samples) andfinally in the solid (after calcination) phase. It is known that the nitrate salts of these metals (Co(II), Mn(II), and Li(I)) form LLC mesophases with nonionic surfactants.4,35,36 The clear solutions, prepared by dissolving the metal nitrate salts, nitric acid, CTAB, C12EO10, and TTB in ethanol, are either spin or spray coated over a substrate to prepare the fresh samples. We have investigated a broad range of metal ion to titanium ratios, but the detailed investigation was limited to 4:4 Co(II):Ti(IV) and Mn(II):Ti(IV) and 4:5 Li(I):Ti(IV) per C12EO10, where the mesophase is the most ordered. The freshly prepared thin films and spray coated thicker films were immediately calcined at a desired temperature; the coated samples were directly put into an oven at the calcination temperature and kept at that temperature for 10−30 min. The resulting films are highly transparent and show a sponge-like mesoporous network between 350 and 500°C, see schematic diagram in Scheme 1.
Mesoporous CoTiO3 Thin Films and Powders. The MASA process was optimized over a very broad range of [Co(H2O)6](NO3)2/C12EO10 mole ratio keeping all other ingredients constant. We also optimized the amount of acid and the stability of the solution using nitric acid. It was discovered that at low acid end of the mixture (up to 200 mg HNO3, corresponds to pH of >0.45), the spin coated samples formed worm-like features over the substrate surface, see Figure S1(a and b). These features remain after calcination and are quite mesoporous (pore volume of 0.4 cm3/g and surface area of 270 m2/g) with a relatively nonuniform pore size distribution, see Figure S1(c). However, the worm-like features disappeared, and smoothfilms were obtained when the amount of acid was
increased to 500 mg (pH = −0.10), Figure S1(d). We also recorded the small angle XRD patterns of the fresh samples, obtained using various acid amounts in the initial solution. The diffraction line is very broad at low acid concentration and becomes sharper at around 500 mg and above, see Figure S2(a). Even with quantities of nitric acid above 500 mg, the phase is stable and diffracts a sharp line at small angles (see Figure S2(a)), and their calcination produces Co3O4 species over the films, Figure S2(b). Figure S3(a and b) shows the SEM image of the samples prepared using 500 and 800 mg of concentrated HNO3. Both images shows a sponge-like porous structure, but the image of the sample prepared using 800 mg of HNO3 has small bright spots, which likely originate from impurities, namely the Co3O4 nanoparticles. Due to this, we limited our investigation to the samples prepared using 500 mg of acid. All observations and behaviors can be related to the TTB hydrolysis and condensation reaction of the titania species. On the low acid side, the titania formation dominates and controls the assembly; however, in very acidic media the mesostructures leach out some Co(II) salts, which undergo decomposition at higher temperatures to produce Co3O4 nanoparticles outside the mesostructure. Therefore, the process requires an optimum amount of acid, which is typically around 500 mg in our reaction conditions and compositions.
We have also investigated the role of salt in the assembly process and varied the cobalt nitrate and TTB amounts in the reaction solution. Figures 1(a) and 1(b) show a set of small
angle and wide angle XRD patterns of the freshly prepared films, prepared using various salt contents. The salt to surfactant ratio was varied from 1 to 7, keeping the Ti(IV):C12EO10 mole ratio fixed at 7. At low salt contents, the mesophase is stable, but calcination of the samples at 450 °C produced a bulk anatase phase of titania, see Figure 1(c). Scheme 1. Schematic Representations of the Synthesis Step
with Increasing TemperatureA
AGray regions are titania species, + salt species, spherical domains are
surfactant regions.
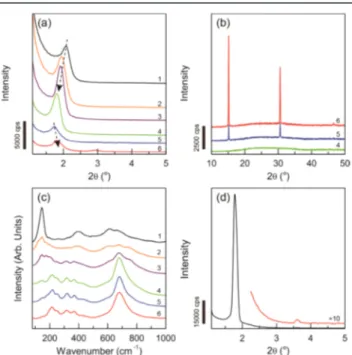
Figure 1.(a) Small angle XRD patterns of the fresh samples with a Co(II):Ti(IV):C12EO10 mole ratio of 1:7:1 to 6:7:1 (from top to
bottom), (b) wide angle XRD patterns of the fresh samples of 4:7:1, 5:7:1, and 6:7:1 Co(II):Ti)IV):C12EO10 mole ratios. (c) Raman
spectra calcined samples of set in panel (a). (d) Small angle XRD pattern of the fresh sample of Co(II):Ti(IV):C12EO10of 4:4:1.
However, by increasing the salt content of the media the titania formation gradually decreased, and at a salt/surfactant mole ratio above 4, the formation of the anatase phase was completely hindered and the CoTiO3 phase appeared, Figure 1(c). The Raman peaks at 156, 224, 258, 328, 377, 443, and 684 cm−1are due to the ilmenite phase of CoTiO3.
37
The wide angle XRD patterns of the fresh samples display sharp salt related lines at the 5 and 6 Co(II)/C12EO10 mole ratios, see Figure 1(b). Additionally, the small angle XRD lines of these samples shift to higher angles, also indicating the leaching of salt species from the mesophase, see Figure 1(a) and 1(b). This is a known phenomenon in a salt-surfactant LLC mesophase, where the unit cell expands to accommodate more salts, but with leaching of the excess salt species, the unit cell shrinks back to low salt values.5
We further optimized the synthesis media by playing with the TTB/C12EO10 mole ratio and discovered that the optimum TTB/C12EO10 mole ratio was also 4. Among all samples investigated, the fresh samples, prepared using a 4:4 Co(II)/ Ti(IV) mole ratio, displayed the most intense diffraction line, Figure 1(d). Therefore, this composition was used to further optimize the synthesis method and to characterize the fresh and calcinedfilms. The calcined samples were further characterized using EDS and various modes of TEM, see Figure S4. EDS data and Co and Ti mappings clearly show that the composition is preserved and homogeneous. For the synthesis of large quantities, we also developed a spray coating method. The spray coated samples displayed very similar Raman spectra to that of the thinfilms before and after calcination. The thermal behaviors of both thinfilms and powders (cracked monoliths) were investigated using Raman, XRD, and N2-sorption measurements to ensure a similar materials form by both methods.
The Raman spectra of the samples, calcined at 350 °C and annealed with 50°C increments up to 550 °C, are shown in Figure 2. Up to 500°C, the only phase observed is the CoTiO3 phase, but above 500 °C, peaks related to the rutile phase of TiO2 (at 267, 416, and 610 cm−1)38 together with Co3O4 (peaks at 466, 508, and 670 cm−1)39also emerge and intensify with annealing time at 550°C, compare Figure 2(e, f, and g).
Note also that the PXRD pattern of these samples also displays the rutile TiO2(ICDD PDF#00-021-1276) and Co3O4(ICDD PDF#00-009-0418) related diffraction lines above 500 °C, see Figure S5. Therefore, it is reasonable to propose that the mesoporous CoTiO3undergoes a phase separation into TiO2 and Co3O4over 500°C.
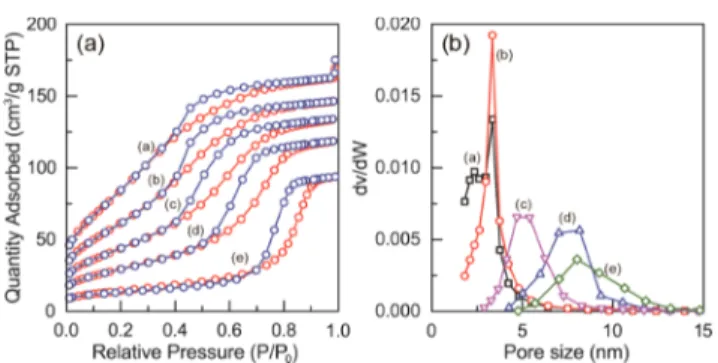
The N2-sorption isotherms were also collected using both thinfilms (which require multiple coating and scraping of the films from hundreds of glass slides) and samples from spray coating to further prove the above proposal and to elucidate the nature of the pores. Both samples, collected from the thinfilms and spray coated films, show very similar N2 sorption isotherms. Therefore, most of the data was collected using the spray coated samples, which are easier to prepare on a large scale. The N2 sorption data display type IV isotherms at all temperatures, characteristic of mesoporous materials, with a record high surface area (around 316 m2/g) and smaller pore size (3.1 nm) and pore volume (0.26 cm3/g) at 350°C. Figure 3(a) shows a set of N2 sorption isotherms of mesoporous
CoTiO3annealed at different temperatures. The samples have two pore systems at low temperature (350 to 450 °C) and merge into one pore, while the pores increase in size with an increasing annealing temperature, Figure 3(b). The pores are quite narrow and uniform but gradually increase from 3.1 to 8.7 nm with increasing the annealing temperature from 350 to 550 °C, respectively. As an expense, the large surface area is lost during annealing steps (surface area drops from 316 to 52 m2/ g), compare data in Table 1. Note also that the pore size expansion is gradual with increasing annealing temperature.
We also collected a series of TEM images of the samples and observed that the images also accord with the Raman, XRD, and N2 sorption data. The images display a sponge-like L3 phase of mesoporous materials40(see Figure S6(a, b, and c), but, at 550°C, one can also observe highly crystalline 20−30 nm nanoparticles in the samples, Figure S6(d). However, the sample annealed at 550 °C still provides type IV isotherm. These observations clearly indicate that the mesoporous CoTiO3is stable up to 500°C and undergoes phase separation into rutile TiO2and Co3O4nanocrystallites at around 550°C. Mesoporous MnTiO3Thin Films and Powders. We also investigated the Mn(II) system and found very similar behaviors to the Co(II) system. We have investigated 2−7 Mn(II) to 7 Ti(IV) and also 4 Mn(II) to 4 Ti(IV) mole ratios per C12EO10. The CTAB content of the sample was kept constant, at 1:1 CTAB:C12EO10 throughout the investigation. Figure S7(a) displays a series of FTIR spectra of the fresh samples with different Mn(II)/Ti(IV) mol ratio. The spectra Figure 2. Temperature dependent Raman spectral changes of the
mesoporous CoTiO3. (a) 350°C, (b) 400 °C, (c) 450 °C, (d) 500 °C,
and (e, f, and g) 550°C. * is rutile TiO2.
Figure 3. (a) N2 sorption isotherms (red adsorption and blue
desorption branches) and (b) the pore size distribution plots of the same sample of CoTiO3.
display peaks (at 1308, 1468, and 1564 cm−1) due to the nitrate species, coordinated to both Mn(II) and titania surface sites, indicating that while titania is forming in the gel-phase, the Mn(II) species remains unreacted at RT. The calcined samples, containing less Mn(II), produced transparent MnTiO3−TiO2, Figure S7(b), and the 7 to 7 and 4 to 4 samples produced only MnTiO3. At all compositions, the films are high quality and highly transparent with an increasing intensity of the brown color with and increasing Mn(II) content in the samples, see Figure S7(b). Thefilms absorbed both UV and visible region of the electromagnetic spectrum, where the absorption tails in the near IR region, Figure S7(c). By plotting their Tauc curves using an indirect gap relationship, we also found the band gap of the films that have a Mn(II) dependence; the band gap decreases from 1.92 to 1.77 to 1.63 and to 1.48 eV going from Mn(II)/C12EO10 mole ratios of 2 to 3 to 4 to 5 at 450 °C, respectively, see Figure S7(d). This trend shows that the MnTiO3 domains are growing in a titania matrix with an increasing Mn(II) content in the samples and accords with the model in Scheme 1. However, the main focus of this work was on the 4 Mn(II) and 4Ti(IV) samples to form a pure MnTiO3 phase.
The spray coating method was also optimized for the Mn(II) system to be able collect enough samples for the PXRD and N2-sorption measurements. The XRD pattern displays very broad and week features that can be related to the ilmenite phase of the MnTiO3 (ICDD PDF #00-002-0846) and the Mn2O3 (ICDD PDF #00-010-0069) and TiO2 related diffraction line starts emerging upon annealing the samples above 500 °C and dominates the PXRD pattern at higher temperatures, Figure S8. Due to strong X-ray absorption and emission of the samples, the XRD patterns are too week to elucidate the structural details. However, Raman spectroscopy is a powerful technique and display peaks due to the phase
separation related changes at around 500 °C. The spectra clearly display characteristic MnTiO3peaks,41at 158, 206, 224, 255, 326, 352, 426, 606, and 676 cm−1, between 350 and 500 °C, indicating a nanocrystalline nature of the pore wall content, Figure S9. However, at higher temperatures the phase segregation species are also visible in both the PXRD patterns and Raman spectra; see Figures S8 and S9, respectively. These two techniques collectively provide information about the crystallinity of the pore-walls.
We also collected N2sorption data starting from 350 up to 550°C using the same samples. The isotherms are type IV and characteristic of mesoporous materials, Figure S10(a). The surface area gradually decreases and the pore size increases with an increasing annealing temperature, see Figure S10 and Table 1 for the details. Similar to CoTiO3, the mesoporous MnTiO3 also collapse at around 500 °C and produce nanocrystalline Mn2O3−TiO2 phases. However, these materials are still very important for many applications, because it is a homogeneous assembly of Mn2O3−TiO2 nanoparticles in the form of thin films or monoliths.
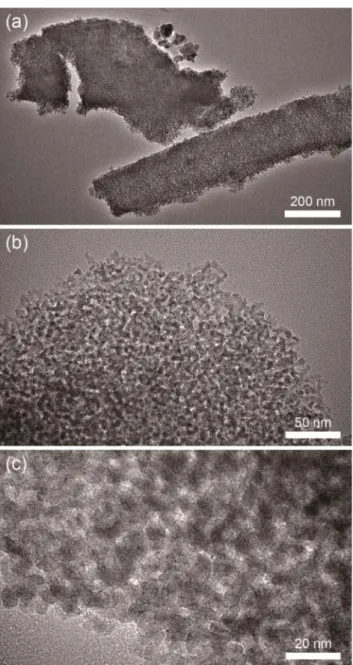
The samples were further analyzed using TEM measure-ments. The thinfilms were ground into fine particles that look alike and show sponge-like pore-systems, see Figure 4. The images show that the pores are uniform and homogeneous throughout thefilms. Since the pores are randomly organized, it is difficult to identify the pore-wall and its crystallinity from the TEM images.
Mesoporous Li4Ti5O12 Thin Films and Powders. The interest in mesoporous Li4Ti5O12as an anode material for the Li+ ion batteries has grown immensely over the past few years.16,28−32However, the current synthetic methods produce powders with relatively smaller surface areas and with much thicker pore-walls. Although, the wall thickness is usually near the diffusion limits of Li+ ions (typically around 10 nm), it is important to reduce it further to effectively charge and discharge these materials. One way to increase surface area and reduce the wall thickness is to produce Li4Ti5O12 using smaller surfactant molecules. So far the most commonly investigated surfactant, used to synthesize mesoporous Li4Ti5O12, is KLE (Karaton-liquid-b-poly(ethylene oxide, Mw of around 80000), which is a large copolymer and easy to assemble. Assembling the salt and polymerizing titania source with smaller surfactants is more difficult, especially for nonpolymerizing salts at room temperature, such as lithium salts. However, the MASA approach provides an effective solution to this problem, and the production of mesoporous Li4Ti5O12with a larger surface area and thinner pore-walls and adjustable pore size is possible using CTAB and C12EO1O surfactant couples. We also know that many lithium salts can be self-assembled into lyotropic liquid crystalline mesophases with nonionic surfactants.9A broad range of LiNO3 and TTB was used in this investigation, and the conditions required for a stoichiometric Li(I)/Ti(IV) ratio of 4/5 have been established. Note that these ratios are also the Li/C12EO10and Ti/C12EO10 mole ratios. The optimization for both spin coating (for thin films) and spray coating (thicker and large quantity samples) has been performed by using FT-IR, Raman, XRD, and N2 -sorption experiments and is similar to CoTiO3and MnTiO3; therefore, we will not discuss the steps again.
The samples, prepared using spray coating, were analyzed using PXRD, N2-sorption, and Raman spectroscopy techniques to elucidate the temperature dependent behavior of the samples. The freshly prepared spray coated samples werefirst Table 1. N2Sorption, Raman, and XRD Related Data of
Mesoporous CoTiO3, MnTiO3, and Li4Ti5O12 CoTiO3
temp (°C)
surface area
(m2/g) pore size(nm) pore volume(cm3/g) phase
350 316 3.1 0.26 CoTiO3 450 227 3.3 0.23 CoTiO3 450 161 4.0 0.21 CoTiO3 500 107 5.4 0.19 CoTiO3 550 52 8.7 0.15 Co3O4/ TiO2 MnTiO3 temp (°C) surface area
(m2/g) pore size(nm) pore volume(cm3/g) phase
350 445 3.1 0.40 MnTiO3 400 370 3.2 0.36 MnTiO3 450 270 3.4 0.31 MnTiO3 500 124 5.6 0.20 MnTiO3 550 33 15.6 0.16 Mn2O3/ TiO2 Li4Ti5Oi2 temp (°C) surface area
(m2/g) pore size(nm) pore volume(cm3/g) phase
350 193 4.3 0.25 Li4Ti5O12
400 152 5.2 0.27 Li4Ti5O12
450 75 7.3 0.19 Li4Ti5O12
500 65 9.9 0.21 Li4Ti5O12
fast calcined at 350°C and then scraped from the glass surface collected around 100−150 mg of powder for the N2sorption experiment. The same sample was used for the PXRD measurements and then further annealed at higher temper-atures to simultaneously collect both N2-sorption isotherms and PXRD patterns. The annealing steps were carried out by 50 °C increments. Figure 5 shows a series of N2-sorption and PXRD patterns from those samples. All the isotherms are type IV, clearly indicating that the samples are mesoporous. Similar to mesoporous CoTiO3 and MnTiO3, the Li4Ti5O12 also expands in pore size, while the surface area decreases with an increasing annealing temperature; see Figure 5 and Table 1 for the details. The pore size expansion with the annealing temperature is very gradual and uniform. Pore size is highly uniform at low temperatures, but with an increasing annealing temperature, the pore size distribution becomes highly nonuniform. The pore size can be tuned from 4.3 to 9.9 nm.
The surface area also gradually drops with an increasing annealing temperature, see Table 1.
The PXRD patterns display very broad diffraction lines, corresponding to a pure spinel Li4Ti5O12 phase (ICDD PDF #00-049-0207) even at 350 °C. The diffraction lines get more intense and sharpen slightly but remain almost the same with a similar fwhm up to 550 °C, and at around 550 °C a phase separation takes place and relatively larger Li4Ti5O12 nano-crystallites and an unknown LixTiyO2y+x/2 phase form. Up to 500°C, the pore-walls are nanocrystalline with a wall thickness of a few nanometers. Remember, these samples were annealed stepwise by 50°C increments. One can also calcine the films or spray coated samples at higher temperature (between 350 and 550°C). The samples heated straight at 550 °C, for example, differ from that of the samples annealed stepwise starting from 350 °C. The samples, heated straight at 550 °C, are still mesoporous with a relatively smaller pore size (4.7 nm and becomes 9.3 nm after 2 h annealing, compared with stepwise annealed sample 22 nm) and have larger surface area (63 m2/g compared to 21 m2/g), see Figure S11(a). These samples still diffract broadly, indicating nanocrystalline pore-walls. More-over, the PXRD lines are much stronger, and the two samples are shown in Figure S11(c). However, at 550°C, these samples also undergo phase separation; the phase separation is enhanced with increasing time, Figure S11(c). However, the samples calcined at higher temperature are more stable and resist high temperatures. The phase separation at 550°C leads to an anatase phase of TiO2with larger, dominant Li4Ti5O12 particles. Not only are the samples calcined at higher temperatures more stable but also the phase separation also proceeds differently and yields different products; compare the PXRD patterns in Figures 5(c) and S12. The elucidation of these mechanistic differences requires further study, and it is outside the scope of this investigation.
Figure 4.TEM images of mesoporous MnTiO3, calcined at 450°C,
with different magnifications, the scale bars are (a) 200 nm, (b) 50 nm, and (c) 20 nm.
Figure 5. Changes in the mesoporous Li4Ti5O12 with increasing
annealing temperatures in the (a) N2sorption isotherms (at 1) 350, 2)
400, 3) 450, 4) 500, and 5) 550°C), (b) pore size distribution plots (left to right, evaluated from the data in panel (a)), (c) PXRD patterns, and (d) Raman spectra, (the annealing temperatures are 1) 350, 2) 400, 3) 450, 4) 500, 5) 550, and 6) 600°C).
The annealing process was monitored using Raman spec-troscopy, Figure 5(d). The Li4Ti5O12related peaks
42,43
appear at as low as 350 °C and intensify by the increasing annealing temperature, and the new peaks start emerging at around 550 °C. The peak at 658 cm−1completely shifts to 633 cm−1; and a new shoulder appears at 480 cm−1, and the peak, at 221 cm−1, shifts or splits into two new peaks at 197 and 272 cm−1. Two new peaks, at 809 and 922 cm−1, appear and intensify by annealing at higher temperatures and are characteristic of surface peroxy species. These observations are consistent with the changes observed in the PXRD patterns. The origin of these changes is attributed to the crystallization of Li4Ti5O12and the phase change/separation at higher temperatures. The phase separation leads a new unidentified LixTiyOz, because the new peaks do not belong to any phase of pure titania.
We also analyzed these samples using TEM imaging. A set of TEM images of a sample annealed at 450 and 550°C is shown in Figure 6. The TEM images clearly show that the samples
have a uniform sponge-like porosity similar to the other two titanates. The flakes of the films are shown in Figure 6(a). Notice that theseflakes are scraped from the glass substrate and ground for sometime. Both TEM and SEM images display uniform flakes, and no particles with a different morphology were observed in any of the samples. Figure 6(b) shows the TEM images of the same sample at higher magnifications. As seen in the images, thefilm particles are sponge-like and highly porous with pore sizes similar to the ones evaluated from the N2sorption data. Careful analysis of Figure 6(b) indicates pore wall thickness of around 3−4 nm and pore size of 7−10 nm, which are similar to the results obtained from the PXRD (Scherer analysis) and N2sorption data (pore size distribution plots). Figure 6(c) is a TEM image of a sample calcined straight at 550°C. It displays a mesoporous structure with needle-like Li4Ti5O12 nanocrystallites (5−10 wide by 10−20 nm long) around the pores, see Figure S13.
It is clear from the above data that the calcination temperature and annealing steps are critical obtaining well crystalline mesoporous Li4Ti5O12. One of two different growth and separation mechanisms is effective, depending on the history of the samples. Definitely more stable walls can be formed if the samples are first calcined at high temperatures, and they show better resistance to high temperature annealing processes.
■
CONCLUSIONThe molten salt assisted self-assembly method has been adopted to synthesize mesoporous thin films and powders of three new titanates (CoTiO3, MnTiO3, and Li4Ti5O12). In this assembly process, a volatile solvent (ethanol) was used to homogeneously distribute all the ingredients and to allow for easy processing; spin or spray coatings are both possible. In the spin coating process, the spun solution immediately loses its volatile solvent and leaves behind salt (or hydrated salt) species that are in the liquid phase in the hydrophilic domains of the mesophase and which help the surfactants to assemblefirst into the LLC mesophase, then into a mesostructured semisolid with the condensation of the titania species over time. The spin or spray coated samples can be fast calcined straight at a desired temperature in 10−30 min. The fast calcination ensures complete burning of the surfactant species and the formation of metal titanates. All three examples investigated in this work are new in terms of pore structure, pore-wall composition, pore-wall thickness, and morphology as thin films as well as spongy porosity. Typical thickness of thefilms is around 400 nm, but it could be adjusted between a few tens and a few hundreds of nanometers by controlling the spin speed and ethanol content of the original solution. All titanates form at temperatures as low as 350°C and are stable up to 500−550 °C. The pore walls of mesoporous Li4Ti5O12 are nanocrystal-line even at 350°C and have thicker pore-walls with a smaller surface area. Simply, the low temperature crystallization results in a thicker pore-wall and smaller surface area in the Li4Ti5O12 compared to CoTiO3 and MnTiO3. This behavior is also evident in the samples heated at higher temperatures, such that the titanate domains grow in size and eventually undergo phase separation at higher temperatures and display smaller surface area. Moreover with annealing, the step by step or calcining at higher temperatures, one can produce larger pores with a better pore wall crystallinity at the expense of losing their surface area. In all three systems, the surface area, obtained from metal titanates, reaches a record high, as high as 445 m2/g. Surface Figure 6.TEM images of mesoporous Li4Ti5O12thinfilms (a and b)
area, pore-wall composition, pore-wall crystallinity, pore size, and pore volume can be adjusted by playing with the composition of the MASA ingredients and the annealing temperature. The MASA process is not limited to only these titanates; other binary, ternary, and also doping of titanates with different metal ions are also possible using this assembly process.
■
ASSOCIATED CONTENT*
S Supporting InformationAdditional spectra (UV−vis, Raman, FTIR), diffraction patterns, N2 sorption, TEM, and SEM images for all three sets of samples. This material is available free of charge via the Internet at http://pubs.acs.org.
■
AUTHOR INFORMATIONCorresponding Author
*E-mail: [email protected].
Author Contributions
The manuscript was written through contributions of all authors. All authors have given approval to thefinal version of the manuscript.
Funding
TÜBİTAK 113Z730.
Notes
The authors declare no competingfinancial interest.
■
ACKNOWLEDGMENTSThe authors thank TÜBİTAK under project number 113Z730 for financial support. Ö.D. is a member of the Science Academy, Istanbul, Turkey.
■
ABBREVIATIONSMASA, molten salt assisted self-assembly; TTB, titaniumte-trabutoixde; LLC, lyotropic liquid crystal
■
REFERENCES(1) Albayrak, C.; Özkan, N.; Dag, Ö. Langmuir 2011, 27, 870. (2) Karakaya, C.; Türker, Y.; Albayrak, C.; Dag, Ö. Chem. Mater. 2011, 23, 3062.
(3) Karakaya, C.; Türker, Y.; Dag, Ö. Adv. Funct. Mater. 2013, 23, 4002.
(4) Çelik, Ö.; Dag, Ö. Angew. Chem., Int. Ed. 2001, 40, 3800. (5) Albayrak, C.; Soylu, A. M.; Dag, Ö. Langmuir 2008, 24, 10592. (6) Türker, Y.; Karakaya, C.; Dag, Ö. Chem.Eur. J. 2012, 18, 3695. (7) Yang, P.; Zhao, D.; Margolese, D. L.; Chmelka, B. F.; Stucky, G. D. Nature 1998, 396, 152.
(8) Grosso, D.; Illia, G. J. A. A.; Crepaldi, E. L.; Charleux, B.; Sanchez, C. Adv. Funct. Mater. 2003, 13, 37.
(9) Grosso, D.; Boissiere, C.; Smarsly, B.; Brezensinski, T.; Pinna, N.; Albouy, P. A.; Amenitsch, H.; Antonietti, M.; Sanchez, C. Nat. Mater. 2004, 3, 787.
(10) Kong, L.; Chen, H.; Hua, W.; Zhang, S.; Chen, J. Chem. Commun. 2008, 4977.
(11) Lee, J.; Orilall, M. C.; Warren, S. C.; Kuperman, M.; Disalvo, F. J.; Wiesner, U. Nat. Mater. 2008, 7, 222.
(12) Li, G. S.; Zhang, D. Q.; Yu, J. C. Environ. Sci. Technol. 2009, 43, 7079.
(13) Fan, X.; Wang, Y.; Chen, X.; Gao, L.; Luo, W.; Yuan, Y.; Li, Z.; Yu, T.; Zhu, J.; Zou, Z. Chem. Mater. 2010, 22, 1276.
(14) Jo, C.; Kim, Y.; Hwang, J.; Shim, J.; Chun, J.; Lee, J. Chem. Mater. 2014, 26, 3508.
(15) Qu, Y.; Zhou, W.; Fu, H. ChemCatChem 2014, 6, 265.
(16) Kang, E.; Jung, Y. S.; Kim, G.-H.; Chun, J.; Weisner, U.; Dillon, A. C.; Kim, J. K.; Lee, J. Adv. Funct. Mater. 2011, 21, 4349.
(17) Gu, D.; Schüth, F. Chem. Soc. Rev. 2014, 43, 313.
(18) Fattakhova-Rholfing, D.; Zaleska, A.; Bein, T. Chem. Rev. 2014, DOI: 10.1021/cr500201c.
(19) Ma, Z.; Yu, J.; Dai, S. Adv. Mater. 2010, 22, 261.
(20) Poyraz, A. S.; Kuo, C. H.; Biswas, S.; King’ondu, C. K.; Suib, S. L. Nat. Commun. 2013, 4, 2952.
(21) Song, J. Y.; Wang, Y. Y.; Wan, C. C. J. Power Sources 1999, 77, 183.
(22) Shimura, H.; Yoshio, M.; Hoshino, K.; Mukai, T.; Ohno, H.; Kato, T. J. Am. Chem. Soc. 2008, 130, 1759.
(23) Kerr, R. L.; Miller, S. A.; Shoemaker, R. K.; Elliott, B. J.; Gin, D. L. J. Am. Chem. Soc. 2009, 131, 15972.
(24) Judeinstein, P.; Roussel, F. Adv. Mater. 2005, 17, 723. (25) Poizot, P.; Laruelle, S.; Grugeon, S.; Dupont, L.; Tarascon, J.-M. Nature 2000, 407, 496.
(26) Ren, Y.; Armstrong, R.; Jiao, F.; Bruce, P. G. J. Am. Chem. Soc. 2010, 132, 996.
(27) Choi, N.-S.; Chen, Z.; Freunberger, S. A.; Ji, X.; Sun, Y.-K.; Amine, K.; Yushin, G.; Nazar, L. F.; Chao, J.; Bruce, P. G. Angew. Chem., Int. Ed. 2012, 51, 9994.
(28) Ye, Y.; Jo, C.; Jeong, I.; Lee, J. Nanoscale 2013, 5, 4584. (29) Lee, J.; Jung, Y. S.; Warren, S. C.; Kamperman, M.; Oh, S. M.; Disalvo, F. J.; Wiesner, U. Macromol. Chem. Phys. 2011, 212, 383.
(30) Haetge, J.; Hartmann, P.; Brezensinski, K.; Janek, J.; Brezensinski, T. Chem. Mater. 2011, 23, 4384.
(31) Feckl, J. M.; Fominykh, K.; Döblinger, M.; Fattakhova-Rohlfing, D.; Bein, T. Angew. Chem., Int. Ed. 2012, 51, 7459.
(32) Yu, L.; Wea, H. B.; Lau, X. W. D. Adv. Mater. 2013, 25, 2296. (33) Lin, C.; Fan, X.; Xin, Y.; Cheng, F.; Lai, M. O.; Zhou, H.; Lu, L. Nanoscale 2014, 6, 6651.
(34) Zhao, Y.; Sun, J.; Chen, X.; Zhu, H.; Yang, W. New J. Chem. 2014, 38, 1173.
(35) Albayrak, C.; Cihaner, A.; Dag, Ö. Chem. - Eur. J. 2012, 18, 4190.
(36) Dag, Ö.; Alayoglu, S.; Uysal, I. J. Phys. Chem. B 2004, 108, 8439. (37) Zhou, G.-W.; Lee, D. K.; Kim, Y. H.; Kim, C. W.; Kang, Y. S. Bull. Korean Chem. Soc. 2006, 27, 368.
(38) Tompsett, G. A.; Bowmaker, G. A.; Cooney, R. P.; Metson, J. B.; Rodgers, K. A.; Seakins, J. M. J. Raman Spectrosc. 1995, 26, 57.
(39) Hadjiev, V. G.; Iliev, M. N.; Vergilov, I. V. J. Phys. C: Solid State Phys. 1988, 21, L199.
(40) McGrath, K. M.; Dabbs, D. M.; Yao, N.; Aksay, I. A.; Gruner, S. M. Science 1997, 277, 552.
(41) Zhou, G. W.; Kang, Y. S. Mater. Sci. Eng., C 2004, 24, 71. (42) Aldon, L.; Kubiak, P.; Womes, M.; Jumas, J. C.; Olivier-Fourcade, J.; Tirado, J. L.; Corredor, J. I.; Pérez Vicente, C. Chem. Mater. 2004, 16, 5721.