Service Quality of Web Information Systems
Yaşar Tonta1 and İrem Soydal21Department of Information Management, Hacettepe University, 06800 Beytepe,
Ankara, Turkey, [email protected]
2Hacettepe University Medical Library, Hacettepe University, 06100 Sıhiyye, Ankara,
Turkey, [email protected]
Abstract: It is essential that web designers understand what users expect of web services, how they perceive service quality dimensions such as security, usability and information quality, and which ones they value the most. In this study, the users’ service quality perceptions of two different web sites were investigated. Data were obtained from 1,900 users of web sites of a for-profit online bookstore and a not-for-profit national information center through the E-Qual Index that was administered online. Findings of the study indicate that users of both for-profit and not-for-profit web sites attach more importance to the “trust” and “quality of information” dimensions as web service quality indicators. Users’ expectations should therefore be regularly measured to review the design and information structures of both for-profit and non-profit web sites.
Keywords: web service quality, usability, information quality, trust, E-Qual Index.
1. Introduction
The web sites presenting information about a specific subject that appeals to a specific user group are called as web information systems. These systems may have commercial, information sharing or information presenting purposes, and they need to be designed by taking the user satisfaction into consideration. The level of user satisfaction is determined by the extent to which users’ expectations are met. Users often think that the quality of web information systems is closely related with the quality of information provided and the quality of the system design (Shih, 2004a; 2004b; Negash, Ryanb and Igbaria, 2003). Users’ expectations increase as the web functionality does. They become more demanding as they experience new web services and technologies (Piccoli, Brohman, Watson and Parasuraman, 2004). This shows that users’ expectations can change as fast as the Web itself does. Measuring the service quality in the Web environment is important in terms of increasing the usage rate of the systems. If the web service quality is perceived positively by the users, it significantly affects the users’ overall satisfaction, their eagerness to suggest the system to others and their tendencies to purchase/repurchase (Zeithaml, 2000).
This study aims to measure the service quality of web information systems by means of the E-Qual Index. Comprised of 22 Likert-type questions, the E-Qual Index tests the concepts of web site usability, information quality and interaction quality, in general. We applied it to one for-profit web site (Idefix, an online shopping site, www.idefix.com.tr) and one not-for-profit web site (the National Academic Network and Information Center, ULAKBIM, www.ulakbim.gov.tr). Findings were compared to see if users’ perceptions of web service dimensions differed in terms of types of web sites.
2. Literature Review
The concept of “traditional” service quality started to attract attention in 1980s (Parasuraman, Zeithaml and Berry, 1985). The SERVQUAL Index with 22 questions and five different dimensions (Tangibles, Reliability, Responsiveness, Assurance, and Empathy) has emerged as a tool to measure the traditional service quality. The dimensions measured by the SERVQUAL Index have since changed as more services and products have
increasingly been offered via the Web. Nevertheless, most studies measured the web service quality by using the dimensions of SERVQUAL Index (Van Iwaarden, Van der Wiele, Ball and Millen, 2004; Caruana, Ewing and Ramaseshan, 2000; Cook and Thompson, 2000; Negash, Ryan and Igbaria, 2003).
Several studies were carried out on the web service quality (Lindgaard and Dudek, 2003; Muylle, Moenaert and Despontin, 2004; Shih, 2004b; Yang, Cai, Zhou and Zhou, 2005; Garrity, Glassberg, Kim, Sanders and Shin, 2005). Factor analysis was used to identify the new web service quality dimensions. Among them are: usability, usefulness of content, the adequacy of information, accessibility, and interaction (Yang, Cai, Zhou and Zhou, 2005); responsiveness, competence, quality of information, empathy, web assistance, and callback systems (Li, Tan and Xie, 2002); and, effectiveness, system availability, fulfillment, compensation, and contact (Parasuraman Zeithaml and Malhotra, 2005). Also, the quality of information, the features of perceived usability and the ease of use are significant measures from the users’ point of view to evaluate the success of information systems (Shih, 2004a; 2004b).
The E-Qual Index was developed in the beginning of 2000s in order to measure the web service quality. It was based on the literature of information systems, marketing and human-computer interaction (Barnes and Vidgen, 2002). The first versions of E-Qual Index (named “WebQual Index” before 2003) were used to evaluate the web sites of various universities (Barnes and Vidgen, 2000), online auction web sites (Barnes and Vidgen 2001), the web sites of online bookstores (Barnes and Vidgen, 2002) and government institutions providing electronic services (Barnes and Vidgen 2003b; 2005). Using the factor analysis on the data, the dimensions of perceived service quality were identified as Usability, Design, Information Quality, Trust and Empathy. In a different study, an information presenting website of OECD’s Forum on Strategic Management Knowledge Exchange (FSMK) was explored by removing the questions on Trust (Barnes and Vidgen 2003a). The results of the study were similar except the Trust dimension. Users’ views on the Usability and Design dimensions were positively changed after the web site was redesigned. A similar study was carried out using the official website of the UK Inland Revenue Service in which users’ perceptions of service quality were compared. Users who utilized the website to carry out “interactive online transactions” attached more importance to the Usability dimension than those who used it to “gather information” (Barnes and Vidgen 2003b, 2005).
3. Methodology
Research questions addressed in this study are as follows:
• How do users perceive the service quality of web sites in terms of information quality, usability and service interaction?
• Which service dimensions do users value most?
The web sites of Idefix, a for-profit online bookstore, and ULAKBIM, a not-for-profit national information center, were used to collect data using the E-Qual Index (www.webqual.co.uk/instrument.htm). An online questionnaire with 22 questions was filled out by the users of both web sites. Questions addressed the aspects of usability (e.g., “I find the website easy to learn to operate”), information quality (e.g., “The web site provides accurate/timely/believable information”) and service interaction (e.g., “My
personal information feels secure”) of each web site. Users were asked to mark their scores of perception and importance for each question on a 5-point Likert scale (1: “I’m not pleased at all” / “It is not important for me at all” - 5: “I’m very pleased” / “It is very important for me”). The perception scores reveal the users’ evaluation of the website while the importance scores reveal their level of expectation for the concepts tested in terms of perceived web service quality.
Analyses were based on 1,782 questionnaires filled out for Idefix and 118 for ULAKBIM. The suitability of the data sets for the factor analysis was examined with the Kaiser-Meyer-Olkin (KMO) and Bartlett test. Factor analysis identifies different dimensions of web sites on the basis of users’ perception scores. The importance scores indicate the web site dimensions to which users attach more importance in general. The Principal Component Analysis method was used with varimax rotation. Findings were summarized in tables and radar graphs.
3. Findings and Discussion
Data sets for Idefix and ULAKBIM web sites were suitable for factor analysis (Idefix KMO=0.946, p<0.05; ULAKBIM KMO=0.930, p<0.05). The reliability of the E-Qual Index was high (Idefix α= 0.934; ULAKBIM α= 0.968).
The Eigen value was selected as 1 for the factor analysis for Idefix data. Five factors obtained after the rotation explained 71% of the total variance. They are as follows:
1. Quality of Information (question numbers 9 through 15); 2. Trust (question numbers 16, 17, 18 and 22);
3. Usability (question numbers 1 through 4); 4. Design (question numbers 5 through 8); and 5. Empathy (question numbers 19 through 21).
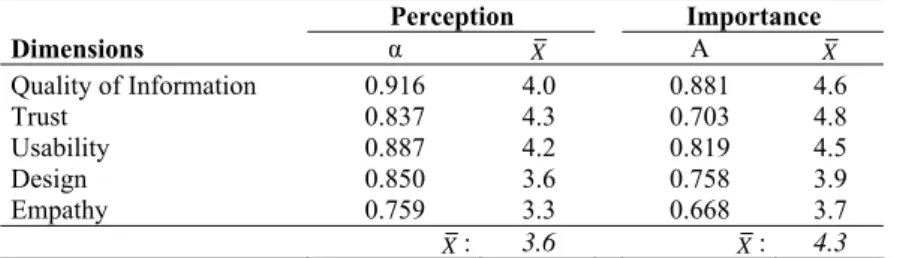
The highest factor loadings belonged to the first factor, the Quality of Information. Cronbach’s alpha (α) values revealed that perception and importance scores were highly reliable (Table 1). The mean perception score (3.9) was lower than the mean importance score (4.3). The mean scores for the factors Trust, Usability and Quality of Information were the highest (4 and above) while that for Design and Empathy were the lowest (3.6 and 3.3, respectively). As for the importance scores, the Trust factor’s mean score was very close to 5 while the mean scores for the Design and Empathy were, once again, the lowest (3.9 and 3.7, respectively).
Table 1. Reliability levels and the mean scores of factors (Idefix)
Perception Importance Dimensions α X Α X Quality of Information 0.916 4.0 0.881 4.6 Trust 0.837 4.3 0.703 4.8 Usability 0.887 4.2 0.819 4.5 Design 0.850 3.6 0.758 3.9 Empathy 0.759 3.3 0.668 3.7 : 3.6 X X: 4.3
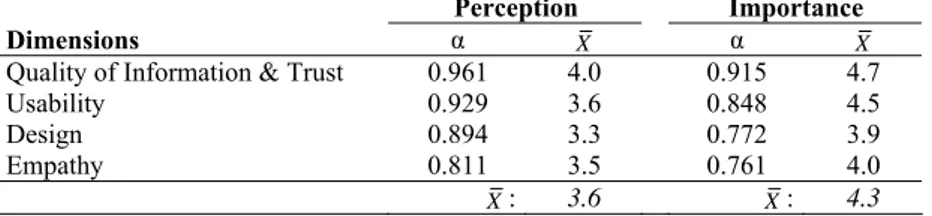
As for ULAKBIM, four factors explained 77% of the total variance. Identified as separate factors for Idefix, the Quality of Information and Trust factors merged and became a single factor while the remaining three factors (i.e., Usability, Design and Empathy) did not change (including the question numbers). It appears that users deemed the Trust (and the security of their personal information) and the Quality of Information in the same category,
thereby creating a joint factor with the highest loadings that explained a third of the overall variance in the ULAKBIM data. As in Idefix, the perception and importance scores were highly reliable (Table 2). The highest mean perception score belonged to the (combined) Quality of Information and Trust factor (4.0) while the Design factor had the lowest (3.3). The highest mean importance scores belonged to the factors of Quality of Information and Trust (combined) (4.7) and Usability (4.5). It should be noted that the difference between the means of perception and importance scores for the Usability factor was high, indicating that users seemed to be less pleased with ULAKBIM’s interface than they had expected.
Table 2. Reliability levels and the mean scores of the dimensions (ULAKBIM)
Perception Importance
Dimensions α X α X
Quality of Information & Trust 0.961 4.0 0.915 4.7
Usability 0.929 3.6 0.848 4.5
Design 0.894 3.3 0.772 3.9
Empathy 0.811 3.5 0.761 4.0
: 3.6
X X: 4.3
In order to better evaluate the perceived service quality of each web site, both the perception and the importance scores should be taken into account. While the perception scores indicate how much users like the web service quality dimensions of the web site they used at a certain time, the importance scores underline how important users find each dimension on the basis of their prior experience with the web in general.
The mean perception and importance scores of factors for Idefix are shown on a radar graph in Figure 1. The Quality of Information, Trust and Usability factors (with the highest mean scores) appear to be prominent, indicating that users graded them more heavily than the other factors. Factors’ mean perception and importance scores were close to each other. The expectations of users seemed to be met more satisfactorily for the Design and Usability factors.
Figure 1. Comparison of factors for Idefix web site according to mean perception and importance scores
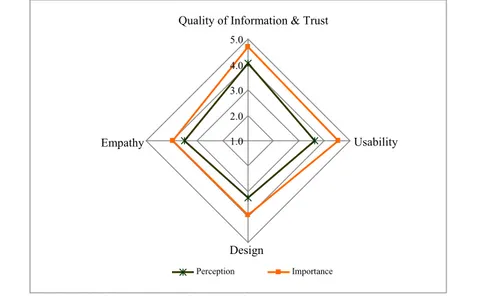
The radar graph in Figure 2 shows that ULAKBIM users thought of the Quality of Information and Trust (combined) and Usability factors as the most important. Differences between the mean perception and importance
5.0 Quality of Information 4.0 3.0 Empathy Trust 2.0 1.0 Design Usability Perception Importance
scores for Usability, Design, and the (combined) Quality of Information and Trust factors are noticeable, indicating that there appears to be a gap between the levels of how users perceived these service quality dimensions in ULAKBIM web site and how they expected them to be. In other words, the higher the gap, the less successful the web site in terms of delivering what users expected.
Figure 2. Comparison of factors for ULAKBIM website according to mean perception and importance scores
The results showed that the Usability, Design and Empathy factors (and the questions measuring these dimensions) were the same for both web sites. However, the Quality of Information and Trust factors differed, as ULAKBIM users perceived these two factors as one while the Idefix users differentiated them. The Quality of Information, Usability, Design, Trust and Empathy concepts were also deemed as different dimensions by the users of previous studies that used the E-Qual Index, which confirms our Idefix findings (Barnes and Vidgen, 2002; 2003b). The dimensions revealed in those studies (and question groups comprising these dimensions) were the same as ours except that ULAKBIM users evaluated the Quality of Information and Trust concepts jointly. This may be due to the fact that Idefix is a commercial company. Idefix users can carry out financial transactions by registering with the system and by supplying personal information. Therefore, Idefix users may have special concerns regarding the Trust issue. ULAKBIM, on the other hand, is an official web site of a government institution providing information to its users (both registered and unregistered). Unlike Idefix users, ULAKBIM users cannot perform online financial transactions through the ULAKBIM web site. ULAKBIM users generally use the web site to get access to information and they may perceive the questions measuring the Trust and the Quality of Information in the context of the presentation of information only. It may also be the case that the 22-question EQual Index was used for the first time in an information presenting web site used solely for academic purposes. In that sense, previous studies evaluating the information presenting web sites of OECD’s FSMKE and UK Inland Revenue Service might be similar to ULAKBIM (Barnes and Vidgen, 2003a; 2003b). However, the five factors emerged were the same as that of Idefix in one study while the questions measuring the Trust were removed from the E-Qual Index in the other.
The importance scores of factors for both web sites show the expectations
Quality of Information & Trust
5.0 4.0 3.0 2.0 Empathy 1.0 Usability Design Perception Importance
of users: they value Trust (combined with the Quality of Information in the case of ULAKBIM) as the most important. Non-profit web site users attach more importance to the concepts concerning the Quality of Information, which was also observed in earlier studies (Barnes and Vidgen 2003b; 2005). As indicated earlier, the concepts of Quality of Information and Trust are interwoven for ULAKBIM users. As for Idefix users, they differentiated the Trust factor from the Quality of Information factor, possibly due to their concerns about the security of their dealings with a commercial website. Interestingly, the users of both web sites rated the Usability as one of the least important factors. This may be either due to the fact that user interfaces of both Idefix and ULAKBIM are well designed or that the users do not seem to be terribly interested in the usability of web sites.
5. Conclusion
This study was carried out in order to compare two different web sites, one for-profit (Idefix) and the other not-for-profit (ULAKBIM) in terms of perceived service quality dimensions, and to determine the most important ones from the users’ point of view. The Quality of Information and Trust appear to be the two most important service quality dimensions of the for-profit web site. As for the users of the not-for-for-profit website, they considered the Quality of Information and Trust factors as a single dimension. The other three factors, namely Usability, Design and Empathy were similar for both web sites.
When the perception and importance scores were compared, it was observed that the user expectations were not fully met for both web sites, although users did not complain much, in general. The factors to which users attach the most importance were Trust for Idefix and the Quality of Information and Trust (combined) for ULAKBIM, indicating that for-profit web site users are more concerned with the security of web information systems while non-profit web site users value the quality and the reliability of information more highly.
Users’ expectations were met less satisfactorily for the factors of Quality of Information, Trust and Usability, suggesting that the perceived usability and design principles were not taken into consideration in designing the non-profit web site. As users attached importance to information and content, the design of the for-profit website seemed to ignore the fact that such web sites are used not only for online interactive transactions but also for finding information.
The importance scores of both web site users differ from each other in terms of service quality dimensions. Yet, our findings show that web users require “good quality information” both from a shopping web site and from an information presenting web site. Although the basic purpose of the existence of a for-profit web site such as that of Idefix may not be presenting information per se, they are an active source of information for books and other information-bearing objects, nevertheless. A non-commercial web site, on the other hand, may collect personal information from the users and require credit card information of users to compensate the costs of some services. This might explain why not-for-profit web site (ULAKBIM) users attached the highest importance to Trust (i.e., safety and security). It is likely that the difference in the perceived service quality dimensions for commercial and non-commercial web sites will disappear in the near future, as more web sites, including commercial ones, offer a wide variety of services. The results of the study show that users consider the web sites as a
valuable source of information no matter what their motivations are in using them. Therefore, designers of web sites should pay attention to the presentation and content of information regardless of their type (e.g., for-profit vs. not-for-for-profit web sites). Users’ expectations also vary, suggesting that studies similar to ours should be carried out regularly to detect the changing user expectations and redesign the web sites accordingly.
6. References
Barnes, S., & Vidgen, R. (2000). WebQual: An exploration of web-site quality. Proceedings of the Eighth European Conference on Information Systems. Retrieved March 25, 2009, from http://is.lse.ac.uk/asp/aspecis/20000052.pdf. Barnes, S., & Vidgen, R. (2001). Assessing the quality of auction web sites.
Proceedings of the Hawaii International Conference on Systems Sciences. Retrieved March 25, 2009, from http://www.webqual.co.uk/papers/auction.pdf. Barnes, S., & Vidgen, R. (2002). An integrative approach to the assessment of
ecommerce quality. The Journal of Electronic Commerce Research, 3(3), 114-127. Retrieved March 25, 2009, from http://www.webqual.co.uk/papers/bookstore.pdf. Barnes, S., & Vidgen, R. (2003a). Measuring web site quality improvements: a case
study of the forum on strategic management knowledge exchange. Industrial Management and Data Systems, 103(5), 297-309. Retrieved March 25, 2009, from http://www.webqual.co.uk/papers/webqualfsmke.pdf.
Barnes, S., & Vidgen, R. (2003b). Interactive e-government: evaluating the web site of the UK Inland Revenue. Journal of Electronic Commerce in Organizations, 2(1), 42-63. Retrieved March 25, 2009, from
http://www.webqual.co.uk/papers/inlandrevenue.pdf.
Barnes, S., & Vidgen, R. (2005). Data triangulation in action: using comment analysis to refine web quality metrics. Proceedings of the 13 th European Conference on Information Systems. Retrieved March 25, 2009, from http://www.webqual.co.uk/papers/comment.pdf.
Caruana, A., Ewing, M.T., & Ramaseshan, B. (2000). Assessment of the three-column format SERVQUAL: An experimental approach. Journal of Business Research, 49(1), 57-65.
Cook, C., & Thompson, B. (2000). Reliability and validity of SERVQUAL scores used to evaluate perceptions of library service quality. The Journal of Academic Librarianship, 26(4), 248-258.
Garrity, E.J., Glassberg, B., Kim, Y.J., Sanders, G.L., & Shin, S.K. (2005). An experimental investigation of web-based information systems success in the context of electronic commerce. Decision Support Systems, 39, 485-503. Li, Y.N., Tan, K.C., & Xie, M. (2002). Measuring web-based service quality. Total
Quality Management, 13(5), 685-700.
Lindgaard, G., & Dudek C. (2003). What is this evasive beast we call user satisfaction? Interacting with Computers, 15, 429-452.
Muylle, S., Moenaert, R., & Despontin, M. (2004). The conceptualization and empirical validation of web site user satisfaction. Information & Management, 41, 543-560.
Negash, S., Ryan, T., & Igbaria, M. (2003). Quality and effectiveness in web-based customer support systems. Information & Management, 40, 757-768.
Parasuraman, A., Zeithaml, V.A., & Malhotra, A. (2005). ESQUAL: A multiple item scale for assessing electronic service quality. Journal of Service Research, 7(3), 213-234.
Parasuraman, A., Zeithaml, V.A., & Berry, L.L. (1985). A conceptual model of service quality and its implications for future research. Journal of Marketing, 49(4), 41-50.
Piccoli, G., Brohman, M.K., Watson, R.T., & Parasuraman, A. (2004). Net-based customer service systems: Evolution and revolution in website functionalities. Decision Sciences Journal, 35(3), 423-455.
Shih, H.-P. (2004a). An empirical study on predicting user acceptance of e-shopping on the Web. Information & Management, 41, 351-368.
Shih, H.-P. (2004b). Extended technology acceptance model of Internet utilization behavior. Information & Management, 41, 719-729.
Van Iwaarden, J., Van der Wiele, T., Ball, L., & Millen, R. (2004). Perceptions about the quality of web sites: a survey amongst students at Northeastern University and Erasmus University. Information & Management, 41, 947-959.
Yang, Z., Cai, S., Zhou, Z., & Zhou N. (2005). Development and validation of an instrument to measure user perceived service quality of information presenting web portals. Information & Management, 42, 575-589.
Zeithaml, V.A. (2000). Service quality, profitability, and the economic worth of customers: What we know and what we need to learn. Journal of Academy of Marketing Science, 28, 67-85.