Doğuş Üniversitesi Dergisi, 19 (1) 2018, 59 - 68
(1)Piri Reis University, Faculty of Economics and Administrative Sciences, International Logistics and Transportation Dept.; [email protected]
(2)Piri Reis University, Faculty of Economics and Administrative Sciences, International Logistics and Transportation Dept.; [email protected]
(*) This paper was presented at the “The 15th International Logistics and Supply Chain Congress (LMSCM)” on October 19-20, 2017.
Geliş/Received: 06-12-2017, Kabul/Accepted: 24-01-2018
Employees Technology Usage Adaptation Impact on Companies’
Logistics Service Performance
(*)Çalışanların Teknoloji Kullanım Adaptasyonunun Firmaların Lojistik Servis Performansına Etkisi
A. Zafer ACAR
(1), Pınar GÜROL
(2)ABSTRACT: The information technology (IT) capability of companies is one of the determinants of their competitive power. However, IT outputs depend on employees intentions to use them. As a technological investment Port automation systems are widely used in container terminals. Therefore behavioral intention in the usage of various IT applications is one of the important factors that may affect logistics service performance. This study aims to explore the employees' technology usage adaptation impact on the logistics service performance of ports. In this context, the behavioral intentions of employees who use port automation systems are investigated using the Technological Acceptance Model.
Keywords: Competitive Power, Logistics Service Performance, Port Automation Systems, Technology Acceptance Model
ÖZ: Şirketlerin rekabet gücünü belirleyen faktörlerden biri de bilgi teknolojisi
yetenekleridir. Ancak, bu yetenek çalışanların bunları kullanma niyetiyle ilişkilidir. Liman otomasyon sistemlerini teknolojik yatırım olarak incelediğimizde konteyner terminallerinde yaygın olarak kullanılmaktadır. Bu sebepten bu teknolojilerin kullanımında davranışsal niyet lojistik servis performansını etkileyebilecek önemli faktörlerden biridir. Bu çalışma, çalışanların teknoloji kullanımındaki davranışsal niyetinin limanların lojistik servis performansı üzerindeki etkisini ortaya çıkartmayı amaçlamaktadır. Bu bağlamda, liman otomasyon sistemlerini kullanan çalışanların davranışsal niyeti, Teknolojik Adaptasyon Modeli ile incelenmiştir.
Anahtar Sözcükler: Rekabet Gücü, Lojistik Servis Performansı, Liman Otomasyon
Sistemleri, Teknolojik Adaptasyon Modeli
JEL Kodları: L25, M10, M15
1. Introduction
In today’s global business environment logistics services become a vital tool in gaining a competitive advantage. Transportation is one of the major functions of these logistics services. Today over 66% of world trade (value based) is transferred through maritime transportation (United Nations Conference on Trade and Development [UNCTAD], 2016: 6). According to the literature ports are an important complement
60 A. Zafer ACAR, Pınar GÜROL
to international trade and the global supply chain (Mangan and Lalwani, 2008: 30) and they are an integral part of maritime transportation due to the services they provide.
Today, like many other industries, competition in container port industry is more intense than before (Cullinane and Song, 2006: 86). So ports need to improve their performance and efficiency (Lee, Kuo, and Chou, 2005: 544) to gain a competitive advantage. Information technology (IT), as a competitive weapon, may contribute to a firm’s competitive advantage by providing cost leadership and product differentiation (Porter, 1985). In the global business environment the IT capabilities of companies are one of the determinants of their competitive power. While technological infrastructures need costly investments they also provide companies with the capabilities to exploit strategic opportunities.
As a critical IT capability port automation systems are a widely used technological investments in container terminals. On the other hand, generally, the efficient and effective outputs of these technologies depend on employees intention to use them. This study aims to explore employees technology usage adaptation impact on ports logistics service performance. In this context the behavioral intentions of employees to use port automation systems is investigated according to Technological Acceptance Model (TAM). In this research process a questionnaire was designed and all constructs were measured using existing scales from previous studies. The relationships between all variables were tested using factor, reliability, correlation and regression analyses by the SPSS 23 statistical package program.
In this context this study is organized as follows. A part literature review of the main concepts of the study is given after which the methodology of the study, including questionnaire design and sampling, is presented and data analyses and findings are given. Finally, the results are discussed in the conclusion.
2. Literature Review
Due to the logistics services shift from low-value basic to high value-added services, IT has had the greatest impact on the minimizing of risks, standardizing processes and reducing uncertainty (Lai, Li, Wang, and Zhao, 2008: 25), but it depends on employees intention to use IT.
2.1. Information Technology Capabilities (ITC)
Capability is an ability to accomplish organizational goals in a competitive environment (Teece, Pisano, and Shuen, 1997: 513). In a research-based view, IT is considered as a distinct capability for companies which provides a competitive advantage (Mata, Fuerst, and Barney, 1995: 487; Bharadwaj, 2000: 171; Acar and Zehir, 2009) and if a company combines IT related resources to a unique IT capability, it can create competitive power (Santhanam and Hartono, 2003: 126). IT investment adds value to companies by improving organizational efficiency and effectiveness (Bhatt and Grover, 2005: 255). According to the literature ITC has three dimensions; IT Infrastructure (ITCI), IT Qualifications (ITQ), and IT Operations (ITO) (Turulja and Bajgorić, 2016: 150; Karagoz and Akgun, 2015:25; Kmieciak, Michna, and
Employees Technology Usage Adaptation Impact on Companies … 61
Meczynska, 2012: 710; Lai et al., 2008; DeSarbo, Anthony Di Benedetto, and Sinha, 2005; Tippins and Sohi, 2003: 748).
2.2. Technology Acceptance Model
IT plays a critical role in a company’s performance, but, without users, it will be valueless in regard to competitiveness. Therefore individual’s behavioral intention to use a system has been measured by many researchers and models have been developed (Ajzen and Fishbein, 1980; Venkatesh, 1999: Davis, 1989; Davis, Bagozzi, and Warshaw, 1989; Venkatesh, and Davis, 2000). One of these models is TAM, which was created by Davis in 1989. According to this model “Perceived Usefulness (PU)” and “Perceived Ease of Use (PEOU)” are two dimensions of individual behavioral intention to use a technology (Davis, 1989: 320).
PU is a person’s degree of belief that using a technological system will increase his/her job performance, and PEOU is a person’s degree of belief that using a technological system requires no additional effort (Davis, 1989: 320).
3. Methodology
3.1. Conceptual Framework
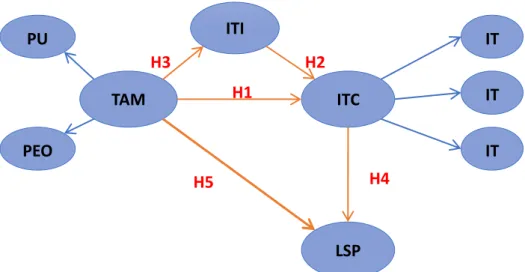
The main focus of current empirical study is to evaluate the effects of port automation systems capabilities on logistics service performance. In this context, behavioral intentions of employees to use port automation systems are exposed by Technological Acceptance Model (TAM). In this connection, the hypotheses which we use in our study are improved according to scientific paradigms and we construct a model that explains the relationship between TAM, ITC, and LSP (Figure 1), with support from the contemporary literature, these hypotheses are expanded in Table 1:
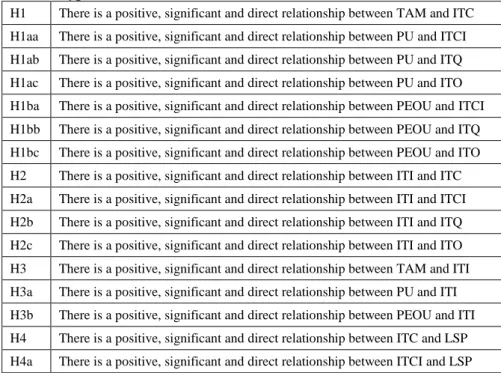
Table 1. Hypotheses
H1 There is a positive, significant and direct relationship between TAM and ITC H1aa There is a positive, significant and direct relationship between PU and ITCI H1ab There is a positive, significant and direct relationship between PU and ITQ H1ac There is a positive, significant and direct relationship between PU and ITO H1ba There is a positive, significant and direct relationship between PEOU and ITCI H1bb There is a positive, significant and direct relationship between PEOU and ITQ H1bc There is a positive, significant and direct relationship between PEOU and ITO H2 There is a positive, significant and direct relationship between ITI and ITC H2a There is a positive, significant and direct relationship between ITI and ITCI H2b There is a positive, significant and direct relationship between ITI and ITQ H2c There is a positive, significant and direct relationship between ITI and ITO H3 There is a positive, significant and direct relationship between TAM and ITI H3a There is a positive, significant and direct relationship between PU and ITI H3b There is a positive, significant and direct relationship between PEOU and ITI H4 There is a positive, significant and direct relationship between ITC and LSP H4a There is a positive, significant and direct relationship between ITCI and LSP
62 A. Zafer ACAR, Pınar GÜROL
H4b There is a positive, significant and direct relationship between ITQ and LSP H4c There is a positive, significant and direct relationship between ITO and LSP H5 There is a positive, significant and direct relationship between TAM and LSP H5a There is a positive, significant and direct relationship between PU and LSP H5b There is a positive, significant and direct relationship between PEOU and LSP
According to the generated hypotheses the preliminary research model is depicted in Figure 1.
Figure 1. Research Model
3.2. Questionnaire Design
All constructs are measured using existing scales from previous literature, and adapted for the port industry. The first of these scales is the Technology Acceptance Model (TAM), and the questionnaire is taken from recent studies (Hamid, Razak, Bakar, and Abdullah, 2016; Abdullah, and Ward, 2016; Fathema, Shannon, and Ross, 2015; Wallace, and Sheetz, 2014; Joo, and Sang, 2013) which were generated according to Davis’s study (1989). The second is Information Technology Investments (ITI), and the questionnaire was adapted from recent studies (González-Benito, 2007; Sriram, Stump, and Banerjee, 1997). The other scale is Information Technology Capability (ITC) and the questionnaire was adapted from recent studies (Turulja and Bajgorić, 2016; Karagoz and Akgun, 2015; Kmieciak, Michna, and Meczynska, 2012; Lai, Li, Wang, and Zhao, 2008; DeSarbo, Anthony Di Benedetto, and Sinha, 2005; Tippins and Sohi, 2003). Finally, the Logistics Service Performance measurement tool is taken from recent studies (Acar and Zehir, 2010; Richey, Daugherty, and Roath, 2007; Lu, and Yang, 2006; Lynch, Keller, and Ozment, 2000; Morash, 2001).
PU
PEO
U
TAM
ITI
ITC
IT
Q
IT
O
IT
CI
LSP
H1
H2
H3
H4
H5
Employees Technology Usage Adaptation Impact on Companies … 63
3.3. Sampling and Data Collecting
To perform the analyses valid data was collected from employees of Turkish Container Terminals. A total of 62 questionnaires were returned from more than 11 ports. The descriptive statistics of the respondents are shown in Table 2. All items are measured on the 5 points Likert type scale (1= strongly disagree and 5= strongly agree).The relationships between all variables are tested using factor, reliability, correlation and regression analyses via the SPSS 23 statistical package program. Table 2. Descriptive Statistics of the Sample
Hierarchical
Status Frequency Percent Education Frequency Percent
Owner/
Shareholder 1 1.61%
Primary
School 3 4.84% Top Level Man. 2 3.23% High School 13 20.97% Middle-Level Man. 15 24.19% Vocational School 10 16.13% Entry Level Man. 9 14.52% Graduate 23 37.10% Office Employee 12 19.35% Masters/ PhD 13 20.97% Fieldworker 23 37.10% TOTAL 62 100% TOTAL 62 100%
Tenure Current Company Total
Frequency Percent Frequency Percent
1-4 28 45.16% 10 16.13% 5-10 18 29.03% 18 29.03% 11-19 13 20.97% 26 41.94% 20 > 3 4.84% 8 12.90%
TOTAL 62 100% 62 100%
Department Frequency Percent
Operations 29 46.77%
IT 3 4.84%
Sales and Marketing 7 11.29% Administrative Services 7 11.29%
OTHER 16 25.81%
TOTAL 62 100%
3.4. Data Analyses and Findings
In this study all items and components are tested using comprehensive reliability analyses. The overall scale reliability test coefficient was determined as α= 0.790; this value is above the recommended 0,70 threshold (Nunnally, 1978: 245), in the correlation matrix PEOU showed no strong mutual relationship with each other, so this item was removed, and after that, the reliability test was done again and the coefficient was determined as α= 0.840; this value is significantly over the recommended 0.70 threshold. After removing PEOU the results of the correlation analysis reveal that all constructs which differed from each other as a factor also correlated each other positively and significantly.
64 A. Zafer ACAR, Pınar GÜROL
Table 3. Correlation Matrix
PU ITCI ITQ ITO ITI LSP
PU 1 ITCI ,409** 1 ITQ ,529** ,431** 1 ITO .208 ,413** ,540** 1 ITI ,443** ,605** ,672** ,658** 1 LSP ,280* ,299* ,574** ,528** ,416** 1
**. Correlation is significant at the 0.01 level (2-tailed). *. Correlation is significant at the 0.05 level (2-tailed).
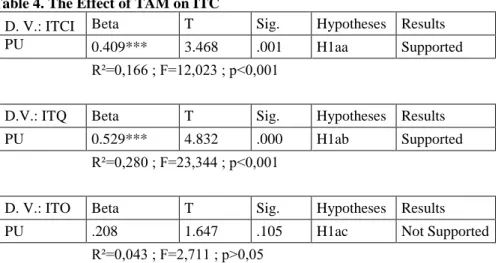
After correlation analysis the linear relationships are tested through regression analysis. According to the results given in Table 4 PU has statistically significant direct positive effects on the ITC dimensions of ITCI, and ITQ. Conversely, there is no significant proof of the effects of PU on ITO.
Table 4. The Effect of TAM on ITC
D. V.: ITCI Beta T Sig. Hypotheses Results
PU 0.409*** 3.468 .001 H1aa Supported
R²=0,166 ; F=12,023 ; p<0,001
D.V.: ITQ Beta T Sig. Hypotheses Results
PU 0.529*** 4.832 .000 H1ab Supported
R²=0,280 ; F=23,344 ; p<0,001
D. V.: ITO Beta T Sig. Hypotheses Results
PU .208 1.647 .105 H1ac Not Supported
R²=0,043 ; F=2,711 ; p>0,05
According to the results that are given in Table 5 ITI has statistically significant direct positive effects on all ITC dimensions.
Table 5. The Effect of ITI on ITC
D.V.: ITCI Beta T Sig. Hypotheses Results
ITI 0.605*** 5.886 .000 H2a Supported
R²=0,366 ; F=34,643 ; p<0,001
D.V.: ITQ Beta T Sig. Hypotheses Results
ITI 0.672*** 7.027 .000 H2b Supported
R²=0,451 ; F=49,375 ; p<0,001
Employees Technology Usage Adaptation Impact on Companies … 65
ITI 0.658*** 6.776 .000 H2c Supported
R²=0,433 ; F=45,915 ; p<0,001
According to the results that are given in Table 6 TAM has statistically significant direct positive effects on ITI.
Table 6. The Effect of TAM on ITI
D.V.: ITI Beta T Sig. Hypotheses Results
PU 0.443*** 3.824 .000 H3a Supported
R²=0,195 ; F=14,624 ; p<0,001
According to the results that are given in Table 7 the ITC dimensions of ITQ and ITO have statistically significant direct positive effects on LSP. Conversely, there is no significant proof of the effects of ITCI on LSP.
Table 7. The Effect of ITC on LSP
D.V.: LSP Beta T Sig. Hypotheses Results
ITCI -.005 -.046 0.963 H4a Not Supported
ITQ 0.410** 3.256 0.002 H4b Supported
ITO 0.309* 2.478 0.016 H4c Supported
R²=0,397 ; F=12,734 ; p<0,001
According to the results that are given in Table 8 TAM has statistically significant direct positive effects on LSP.
Table 8. The Effect of TAM on LSP
D.V.: LSP Beta t Sig. Hypotheses Results
PU 0.280* 2.263 .027 H5a Supported
R²=0,0786 ; F=5,121 ; p<0,05
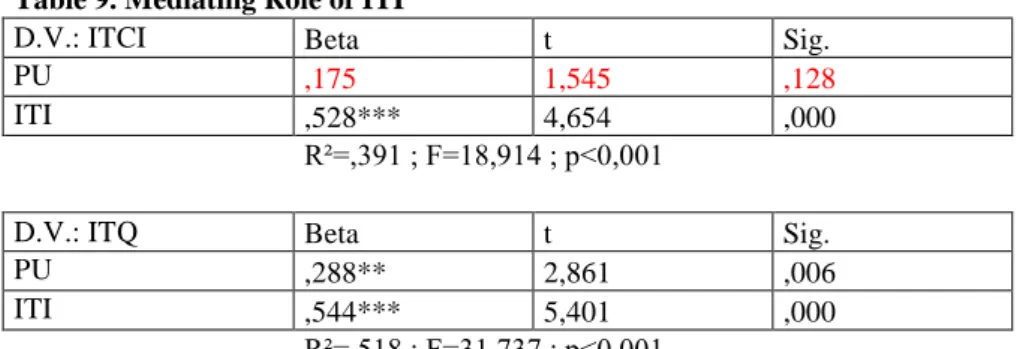
The results not only reveal the positive effect of ITIs and technologic acceptance on the ITCs but also exposed the mediating role of ITIs on this relationship.
According to the regression analysis ITI has a mediating effect between TAM and ITC.
Table 9. Mediating Role of ITI
D.V.: ITCI Beta t Sig.
PU ,175 1,545 ,128
ITI ,528*** 4,654 ,000
R²=,391 ; F=18,914 ; p<0,001
D.V.: ITQ Beta t Sig.
PU ,288** 2,861 ,006
ITI ,544*** 5,401 ,000
66 A. Zafer ACAR, Pınar GÜROL
According to the regression analysis ITC has a mediating effect between TAM and LSP.
Table 10. Mediating Role of ITC
D.V.: LSP Beta t Sig.
PU ,001 ,005 ,996
ITQ ,408* 2,903 ,005
ITO ,308* 2,525 ,014
R²=,397 ; F=12.733 ; p<0,001
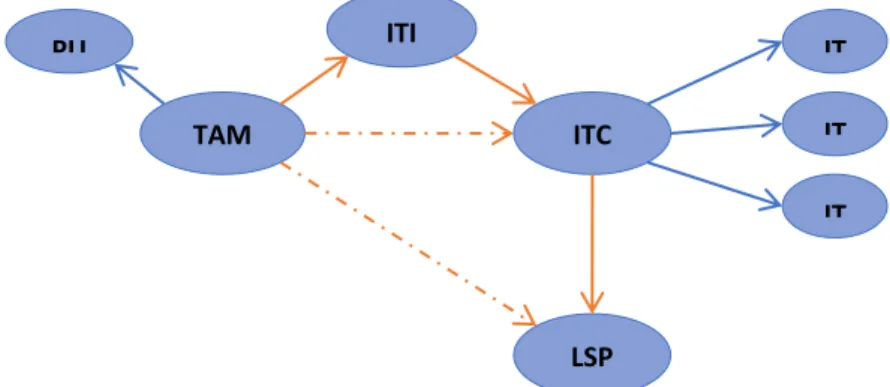
According to analysis the final research model is shown in Figure 2.
Figure 2. Final Model of the Research
4. Conclusion
This study explores the relationship between technologic acceptance, information technology capabilities and logistics service performance. Information technology capabilities and technology acceptance have a positive effect on logistics service performance. The results not only reveal the positive effect of information technology investments and technologic acceptance on information technology capabilities, but also exposed the mediating role of information technology investments in this relationship. Information technology capabilities and technology acceptance have a positive effect on logistics service performance and information technology capabilities have a mediating role in this relationship. 45% of emloyees in total worked less than 11 years and according to the literature the new generation has more ability in information technology usage. If information technology investments are supported by employee training, information technology capabilities and logistics service performances will be performed positively.
PU TAM ITI ITC IT IT IT LSP
Employees Technology Usage Adaptation Impact on Companies … 67
5. References
Abdullah, F., and Ward, R. (2016). Developing a General Extended Technology Acceptance Model for E-Learning (GETAMEL) by analysing commonly used external factors. Computers in Human Behavior, 56, 238-256.
Acar, A.Z., and Zehir, C. (2009). Development and validation of a multidimensional business capabilities measurement instrument. Journal of Transnational
Management, 14(3), 215-240.
Acar, A.Z., and Zehir, C. (2010). The harmonize effects of generic strategies and business capabilities on business performance. Journal of Business Economics
and Management, 11(4), 689-711.
Ajzen, I., and Fishbein, M. (1980). Understanding attitudes and predicting social behaviour.
Bharadwaj, A. S. (2000). A resource-based perspective on information technology capability and firm performance: an empirical investigation. MIS Quarterly, 169-196.
Bhatt, G. D., and Grover, V. (2005). Types of information technology capabilities and their role in competitive advantage: An empirical study. Journal of management
information systems, 22(2), 253-277.
Cullinane, K., and Song, D. W. (2006). Estimating the relative efficiency of European container ports: a stochastic frontier analysis. Research in Transportation
Economics, 16, 85-115.
Davis, F. D. (1989). Perceived usefulness, perceived ease of use, and user acceptance of information technology. MIS Quarterly, 319-340.
Davis, F. D., Bagozzi, R. P., and Warshaw, P. R. (1989). User acceptance of computer technology: a comparison of two theoretical models. Management
Science, 35(8), 982-1003.
DeSarbo, W. S., Anthony Di Benedetto, C., and Sinha, I. (2005). Revisiting the Miles and Snow strategic framework: uncovering interrelationships between strategic types, capabilities, environmental uncertainty, and firm performance. Strategic
Management Journal, 26(1), 47-74.
Fathema, N., Shannon, D., and Ross, M. (2015). Expanding the technology acceptance model (tam) to examine faculty use of learning management systems (LMSS) in higher education institutions. Journal of Online Learning and
Teaching, 11(2).
González-Benito, J. (2007). Information technology investment and operational performance in purchasing: The mediating role of supply chain management practices and strategic integration of purchasing. Industrial Management and
Data Systems, 107(2), 201-228.
Hamid, A. A., Razak, F. Z. A., Bakar, A. A., and Abdullah, W. S. W. (2016). The effects of perceived usefulness and perceived ease of use on continuance intention to use e-government. Procedia Economics and Finance, 35, 644-649. Joo, J., and Sang, Y. (2013). Exploring Koreans’ smartphone usage: An integrated
model of the technology acceptance model and uses and gratifications theory. Computers in Human Behavior, 29(6), 2512-2518.
Karagoz, I. B., and Akgun, A. E. (2015). The roles of it capability and organizational culture on logistics capability and firm performance. Journal of Business Studies
Quarterly, 7(2), 23-45.
Kmieciak, R., Michna, A., and Meczynska, A. (2012). Innovativeness, empowerment and IT capability: evidence from SMEs. Industrial Management and Data
68 A. Zafer ACAR, Pınar GÜROL
Lai, F., Li, D., Wang, Q., and Zhao, X. (2008). The information technology capability of third-party logistics providers: a resource-based view and empirical evidence from China. Journal of Supply Chain Management, 44(3), 22-38.
Lai, F., Li, D., Wang, Q., and Zhao, X. (2008). The information technology capability of third-party logistics providers: a resource-based view and empirical evidence from China. Journal of Supply Chain Management, 44(3), 22-38.
Lee, H. S., Chou, M. T., and Kuo, S. G. (2005). Evaluating port efficiency in Asia Pacific region with recursive data envelopment analysis. Journal of the Eastern
Asia Society for Transportation Studies, 6, 544-559.
Lu, C. S., and Yang, C. C. (2006). Comparison of investment preferences for international logistics zones in Kaohsiung, Hong Kong, and Shanghai ports from a Taiwanese manufacturer's perspective. Transportation Journal, 30-51. Lynch, D. F., Keller, S. B., and Ozment, J. (2000). The effects of logistics capabilities
and strategy on firm performance. Journal of Business Logistics, 21(2), 47-68. Mangan, J., Lalwani, C., and Fynes, B. (2008). Port-centric logistics. The
International Journal of Logistics Management, 19(1), 29-41.
Mata, F. J., Fuerst, W. L., and Barney, J. B. (1995). Information technology and sustained competitive advantage: A resource-based analysis. MIS Quarterly, 487-505.
Morash, E. A. (2001). Supply chain strategies, capabilities, and performance. Transportation Journal, 37-54.
Nunnally, J. (1978). Psychometric theory (2nd ed.). New York: McGraw Hill. Porter, M. E. (1985). Technology and competitive advantage. Journal of Business
Strategy, 5(3), 60-78.
Richey, R. G., Daugherty, P. J., and Roath, A. S. (2007). Firm technological readiness and complementarity: capabilities impacting logistics service competency and performance. Journal of Business Logistics, 28(1), 195-228.
Santhanam, R., and Hartono, E. (2003). Issues in linking information technology capability to firm performance. MIS Quarterly, 125-153.
Sriram, V., Stump, R. L., and Banerjee, S. (1997). Information technology investments in purchasing: an empirical study of dimensions and antecedents. Information and Management, 33(2), 59-72.
Teece, D. J., Pisano, G., and Shuen, A. (1997). Dynamic capabilities and strategic management. Strategic Management Journal, 509-533.
Tippins, M. J., and Sohi, R. S. (2003). IT competency and firm performance: is organizational learning a missing link?. Strategic Management Journal, 24(8), 745-761.
Turulja, L., and Bajgorić, N. (2016). Innovation and Information Technology Capability as Antecedents of Firms’ Success. Interdisciplinary Description of
Complex Systems: INDECS, 14(2), 148-156.
United Nations Conference on Trade and Development [UNCTAD]. (2016). Review
of Maritime Transport – 2016. United Nations Publication.
Venkatesh, V. (1999). Creation of favorable user perceptions: exploring the role of intrinsic motivation. MIS Quarterly, 239-260.
Venkatesh, V., and Davis, F. D. (2000). A theoretical extension of the technology acceptance model: Four longitudinal field studies. Management Science, 46(2), 186-204.
Wallace, L. G., and Sheetz, S. D. (2014). The adoption of software measures: A technology acceptance model (TAM) perspective. Information and Management, 51(2), 249-259.