USING AIRBORNE LIDAR DATA FOR ASSESSMENT OF FOREST FIRE FUEL LOAD
POTENTIAL
M. İnana *, E. Bilicib, A.E. Akayb
a Istanbul University, Faculty of Forestry, Department of Surveying and Cadastre, Istanbul, Turkey, [email protected]
b Bursa Technical University, Faculty of Forestry, 16310 Yıldırım, Bursa, Turkey, [email protected], [email protected]
KEY WORDS: LIDAR, Forestry, Voxel Point Cloud Segmentation, Forest Fire Risk, Fuel Load Potential
ABSTRACT:
Forest fire incidences are one of the most detrimental disasters that may cause long terms effects on forest ecosystems in many parts of the world. In order to minimize environmental damages of fires on forest ecosystems, the forested areas with high fire risk should be determined so that necessary precaution measurements can be implemented in those areas. Assessment of forest fire fuel load can be used to estimate forest fire risk. In order to estimate fuel load capacity, forestry parameters such as number of trees, tree height, tree diameter, crown diameter, and tree volume should be accurately measured. In recent years, with the advancements in remote sensing technology, it is possible to use airborne LIDAR for data estimation of forestry parameters. In this study, the capabilities of using LIDAR based point cloud data for assessment of the forest fuel load potential was investigated. The research area was chosen in the Istanbul Bentler series of Bahceköy Forest Enterprise Directorate that composed of mixed deciduous forest structure.
* Corresponding author
1. INTRODUCTION
Natural disasters such as forest fires are increasing due to climate change and human related factors. In Turkey, about 12,000 hectares of forested area has burned in more than 2,000 forest fires every year (Sivrikaya et al, 2014). The main factors that affect the forest fire risk are meteorological factors, topographical factors, and stand characteristics. Forest fuel loads, estimated based on stand characteristics, are considered to be another factor that differs from meteorological and topographic factors because fuel loads are variable and controllable (Küçük et al., 2005). Thus, estimation of fuel load capacity is critical for forest management studies.
Stand characteristic related fire risk factors are generally associated with many factors. These factors are fuel types, canopy closure, fuel characteristics over the stages of stand development, horizontal and vertical fuel (biomass) continuity, terrain structure and underlying landform, and the distribution of settlement and agricultural areas across the forest (Chuvieco, et al., 1989; Scott et al., 2001; Bilgili, et al., 2003; Sağlam et.al., 2008). The regression models can be developed to determine canopy fuel loading potential based on stand characteristics (Küçük et al, 2007). Remote sensing techniques and Geographic Information Systems (GIS) have been also used to determine fire risk (Chuvieco et al., 1989).
Arıcak et al., (2012) examined the availability and effectiveness of satellite imagery that is one of the remote sensing techniques in fighting forest fires. The fire potential mapping can be generated by assessing and mapping general vegetation complexes with the use of Landsat TM data and Geographic Information System (Durmaz et al., 2006). Sivrikaya et al. (2014) described and evaluated forest fire risk considering the most important factors affecting fire behaviour at fine scales by GIS. Yavuz et al. (2014) used remote sensing techniques to evaluate the fuel load potential based on fuel moisture, wind
speed, and slope in Bayam Forest District by means of remote sensing techniques.
In recent years, LiDAR technology has been used in the field of forestry for the determination of forest types, forest management, production planning, forest roads, and fire behaviour modelling (Coulter et al., 2001; Akay and Sessions, 2005; Akay et al., 2009; Gülci et al., 2015; (Hopkinson et al., 2016; Singh et al., 2016) indicated that LiDAR based forest structure data and high-resolution DEMs can be used in wide scale forestry activities such as stand characterizations, forest inventory and management, fire behavior modelling, and forest operations. Almeida et al., (2016) used a portable profiling LiDAR for fire susceptibility and contrasting fire damage in the Central Amazon. In this study, the use of LIDAR was evaluated in the calculation of the forest fuel load with respect to forest fire. The study was implemented in the Istanbul Bentler series of Bahceköy Forest Enterprise Directorate.
2. MATERIAL AND METHODS
2.1 Study Area
The study area is a portion of Istanbul Northern Forest, Bahceköy Forest Enterprise Directorate within the boarder of İstanbul Regional Directorate of Forestry located in Turkey. (Figure 1). In the Geographic Coordinate System, it is located between 41˚ 13’ 31” – 41˚ 08’ 54” the northern latitude and 28˚ 55' 59’’- 29 ˚ 01' 02" the east longitude.
ISPRS Annals of the Photogrammetry, Remote Sensing and Spatial Information Sciences, Volume IV-4/W4, 2017 4th International GeoAdvances Workshop, 14–15 October 2017, Safranbolu, Karabuk, Turkey
This contribution has been peer-reviewed. The double-blind peer-review was conducted on the basis of the full paper. https://doi.org/10.5194/isprs-annals-IV-4-W4-255-2017 | © Authors 2017. CC BY 4.0 License. 255
Figure 1. Study Area
In Bentler region, the forest area is 3094 ha. The major trees in the field are oak (Quercus spp.), beech (Fagus spp.), hornbeam (Carpinus spp.), chestnut (Castenea spp.), alder (Alnus spp.), ash (Fraxinus spp.), linden (Tilla spp.), Turkish red pine (Pinus brutia), black pine (Pinus nigra), yellow pine (Pinus sylvestris), nut pine (Pinus pinea), and maritime pine (Pinus pinaster). Cover types dominated by oak and maritime pine were chosen for this study because they are the dominant species and represents the Istanbul’s natural forest structure in general.
2.2 Remote Sensing Data
Two data set used for this research (1) LiDAR, in the form of LAS files that the data were collected in early October 2012; (2) Pleiades image, which was taken on May 12 2014.
LiDAR data were collected with a RIEGL Q680i airborne scanning system during leaf-on conditions by Bogaziçi Insaat Mühendislik A.Ş. (BİMTAŞ). The flight altitude was 500 m above ground level and the pulse density was 12 pulses per meter in urban places and was 18 pulses per meter in forested areas. The Pleiades image taken in 2014 that used to create a color point cloud and for visualization. The used Pleiades data were pansharpened with 4 bands (Blue: 0.422-0512 μm, Green: 0.5-0.584 μm, Red: 0.596-0.75 μm, NIR: 0.762-0894 μm) and 2.5 μm. In this study, LAStools ArcGis toolbox, ArcGIS 10.x, Erdas Imagine 2015, CloudCompare V2.6.x software and some codes which prepared in the Point Cloud Library software have been used to determine each individually tree from the color point cloud.
2.3 Field Data
The field data were collected in summer of 2012 and 2017. 286 plots measured randomly in 2012 and 100 plots measured in 2017.
Sampling in 2012 is traditional forest management measurements and only diameter, height and species measured. Additional work has been done in 2017 summer because the crown diameter and the number of trees in the plot are required for this study. There are 60 broad leaf forest type (oak and beech stand) and 40 for the coniferous forest type (maritime pine and black pine stand) in sampling of 2017. Plots in the study area were distributed according to the forest cover type and they were selected on purpose.
Oak stands cover 90% of study area. Topcon GRS1 DGPS system was used to collect the coordinates at center of the plot. Sampling areas were taken in 300 m2 size in accordance with the traditional construction management regulations in order to
make future comparisons. In each plot, the woody species with a diameter (DBH) ≥ 8 cm were measured using caliper (DBH) from 1.30 m height and the tree length was measured using Haglöf Vertex Laser. In addition, the number of trees and crown diameter was recorded for each plot (Figure 2)
Figure 2. Field Study
2.4 Methods
386 sample areas were taken in this research in 2012 and 2017, taking into account the tree type, age class. In this report, only 40 plot values were considered to determine the amount of fuel load in oak areas that is the dominant species of the Bentler series. In addition, volume parameters are taken as basis for fuel load and the results are presented.
SPSS 22 program and Microsoft Office Excel program were used for statistical analysis where average values and standard deviations were computed, the relation between diameter, crown and height was analysed by One-Way ANOVA at 0.05 confidence level. Pearson Correlation Test was used. Linear Regression Analysis was used to determine mathematical models for dependent and independent variables. Linear Regression Analysis was used to determine mathematical models for dependent and independent variables.
In this study, statistical relations between crown diameter, DBH and height were investigated using plot survey data to determine the amount of fire fuel load from the Lidar data. Because these data can be obtained using Lidar data with high accuracy.
3. RESULT
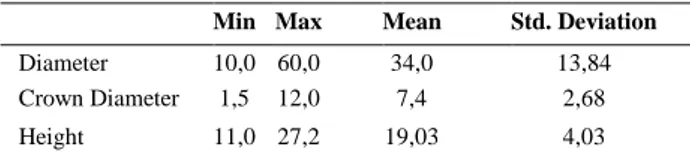
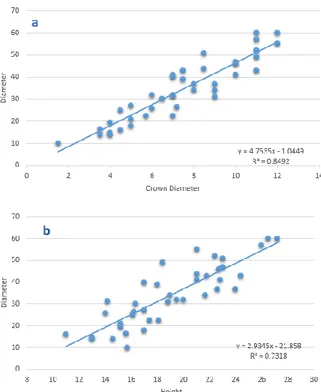
A statistical analysis of the data was made from the study area (Table 1). In the study, when measurements of diameter, height and crown diameter of oak stands were statistically evaluated, significant statistical relations were found between them (Figure 3). The formulas obtained as a result of the regression analysis are noted on the graphs.
Min Max Mean Std. Deviation Diameter 10,0 60,0 34,0 13,84 Crown Diameter 1,5 12,0 7,4 2,68
Height 11,0 27,2 19,03 4,03
Table 1. Descriptive Statistics ISPRS Annals of the Photogrammetry, Remote Sensing and Spatial Information Sciences, Volume IV-4/W4, 2017
4th International GeoAdvances Workshop, 14–15 October 2017, Safranbolu, Karabuk, Turkey
This contribution has been peer-reviewed. The double-blind peer-review was conducted on the basis of the full paper. https://doi.org/10.5194/isprs-annals-IV-4-W4-255-2017 | © Authors 2017. CC BY 4.0 License. 256
Figure 3. a) DBH-Crown Diameter, b) DBH-Height for Oak Aerial Lidar data and Pleiades image were combined in ERDAS software (RGB Encode) to obtain a colored point cloud. This data has been used in the elimination of tree shadows in the future segmentation process.
Digital terrain model (DEM) and numerical surface models (DSM) of the study area were obtained by using LasTools from the new Lidar data set. These two new data sets were extracted from each other to obtain a Canopy Height Model (CHM). The obtained normalized data set is segmented by the codes prepared in the PCL software and each detected tree treeID is assigned. TreeIDs in the new vectorized data set also include tabular data such as the tree height, crown diameter and crown area of the single tree (Figure 4).
Figure 4. a. DSM, b. DEM, c. CHM, d. nCHM Profile, e. Segmentation result with TreeID, f. Vectorize segmentation
result, g. Tabular data extract from LIDAR
Segmentation result is compared with the ground surveying data in the study area and the segmentation parameters are regulated until the highest accuracy is obtained. The highest accuracy achieved for broad-leaved species in this study was 78.3%. In order to estimate the volume of trees in the study area, the volume increment tables in the forest management plans were used. In the study area, the Crown diameter data generated from the LIDAR data was transferred to the GIS database and DBH was calculated for the trees with TreeID in the whole study area by using linear regression formula (yDBH = 4.7535xCrownDia1.0449, R2 = 0.8492).
In the tree inventory studies in forestry, single (diameter-volume) or double (diameter-height-(diameter-volume) entry body volume tables are generally used in the volume of sample areas (Carus et al., 2014). This tabular data is associated with the formula (yVol = 0,0002xDBH2,3884, R2 = 0,9994) generated from the table in the management plans and is estimated in terms of volume (m3) for each tree on the oak stand in the study area. After this step, in order to obtain the volume of trees accepted as fuel load throughout the study area, spatial analyses related to the positions of the trees in the GIS were applied and estimations were made for the areas between the two points. For this purpose, the IDW (Inverse Distance Weighted) technique was used to produce the thematic maps of the amount of fuel load per hectares.
Figure 5. Volume and DBH thematic mapping for F21c053c map sheet
The selected map sheet of F21c05c3c at 1/1000 scale located within the boundaries of study area are shown at Figure 5. In the figure, DBH and volume are produced in the thematic map by IDW method in ArcGIS for volume as m3/ha and for DBH as a cm/ha.
Finally, the thematic maps were evaluated for accuracy. For this purpose, it was checked that whether the volume and DBH values of randomly selected 250 trees were within the estimated ranges that were not used in the prediction map. The tree values of the verification points were taken from the prediction maps and the differences between the actual values and the errors of the smallest total of the black dots were calculated. The accuracy of the generated positional maps was calculated as RMSE 1.116.
ISPRS Annals of the Photogrammetry, Remote Sensing and Spatial Information Sciences, Volume IV-4/W4, 2017 4th International GeoAdvances Workshop, 14–15 October 2017, Safranbolu, Karabuk, Turkey
This contribution has been peer-reviewed. The double-blind peer-review was conducted on the basis of the full paper. https://doi.org/10.5194/isprs-annals-IV-4-W4-255-2017 | © Authors 2017. CC BY 4.0 License. 257
4. CONCLUSIONS
Although LIDAR technology has very high potential for different areas and commonly used in the world, it has very limited usage in Turkey because it needs high technology and equipment that brings high costs.
This technology, which has become more accessible in recent years, emerges as a necessity to accelerate in the fields of different uses in forestry studies. In this respect, it is important to carry out studies to determine the use potential of LIDAR data in forestry studies. In this study, the possibility of using LIDAR data was evaluated in determining the amount of fuel load in forest areas. It has been possible to produce spread maps of the spatial distribution of the tree mass, considered as fuel load, using the Aerial LIDAR data in oak area which is dominant tree species areas of the Istanbul Bentler series. The RMSE values of the thematic maps produced are found to be 1.116.
As a result, it is possible to estimate the dendrometric parameters of forest stands with high accuracy by using Lidar data alone or with a combination of different remote sensing data. While these parameters can be used as fundamental data in different forestry studies, it will be a preferable approach to develop suitable methodologies for country forestry taking into account other factors such as soil, growth environment, climate in different forest organizations
5. REFERENCES
Almeida, D. R., Nelson, B. W., Schietti, J., Gorgens, E. B., Resende, A. F., Stark, S. C., & Valbuena, R. 2016. Contrasting fire damage and fire susceptibility between seasonally flooded forest and upland forest in the Central Amazon using portable profiling LiDAR. Remote Sensing of Environment, 184, 153160.
Akay, A.E., Sessions, J. 2005. Applying the Decision Support System, TRACER, to Forest Road Design, Western Journal of Applied Forestry, 20(3): 184-191.
Akay, A.E.,Oguz, H., Karas, I.R., Aruga, K. 2009. Using LiDAR Technology in Forestry Activities, Environmental Monitoring and Assessment. 151(1):117–125.
Arıcak, B., Enez, K., Küçük, Ö., 2012.“Uydu Görüntüsü Kullanarak Yangın Potansiyelinin Belirlenmesi”, KSÜ Mühendislik Bilimleri Dergisi, Özel sayı, s. 220.
Bilgili, E.; Saglam, B. 2003. Fire Behavior in Maquis in Turkey. Forest Ecol. Manag., 184, 201- 207.
Carus, S., Su, Y., 2014. Antalya–Korkuteli Yöresi Kızılçam Ağaçlandırmaları İçin Tek ve Çift Girişli Ağaç Hacim Tablosunun Düzenlenmesi ve Mevcut Tablolar ile Kıyaslanması. II. Ulusal Akdeniz Orman ve Çevre Sempozyumu, 22-24 Ekim, Bildiriler Kitabı, Isparta, s. 574584. Chuvieco, E.; Congalton, R.G.1989. Application of remote sensing and geographic information systems to forest fire hazard mapping. Rem. Sens. Environ. 1989, 29, 147-159.
Coulter, E.,Chung, W., Akay, A.E., Sessions, J. 2001. Optimization of Forest Road Layout Using a High Resolution Digital Terrain Model Generated from LIDAR Data, First International Precision Forestry Symposium, 17-20 June. University of Washington, College of Forest Resources, Seattle, Washington, USA.
Durmaz, D. B.; Bilgili, E.; Kadiogullari, A.I.; Saglam, B.; Kuçuk, O.; Baskent, E.Z. 2006. Spatial fire potential analysis and mapping using Landsat satellite imagery and GIS. In Proc. International Conference on Forest Fire Research, Figueira da Foz, Portugal, 27-30 November.
Hopkinson, C., Chasmer, L., Barr, A. G., Kljun, N., Black, T. A., & McCaughey, J. H. 2016. Monitoring boreal forest biomass and carbon storage change by integrating airborne laser scanning, biometry and eddy covariance data. Remote Sensing of Environment, 181, 82-95.
Gülci N., Erdaş O. Akay, A.E., 2015. Üretim İşlerinde Hassas Ormancilik Yaklaşimi, Üretim İşlerinde Hassas Ormancılık Sempozyumu”, Proceeding book, 238-256p, 4-6 Haziran 2015, Ilgaz.
Küçük, Ö. 2005. Yangın Potansiyelinin Belirlenmesinde Yanıcı Madde Haritalarının Önemi, SDÜ Orman Fakültesi Dergisi, Seri:A, Sayı:1, Issn:1302-7085, S: 104-116
Küçük O., Saglam B., Bilgili E. 2007. Canopy Fuel Characteristics and Fuel Load in Young Black Pine Trees, Biotechnology & Biotechnological Equipment, 21:2, 235-240, DOI: 10.1080/13102818.2007.10817452
Sağlam B., Bilgili E., Durmaz B.D Kadioğullari A.İ., Küçük O., 2008. "Spatio-Temporal Analysis of Forest Fire Risk and Danger Using Landsat Imagery", SENSORS, vol.8, pp.39703987.
Scott, J. H.; Reinhardt, E.D.2001. Assessing crown fire potential by linking models of surface and crown fire behavior. USDA Forest Service Rocky Mountain Research Station, Research Paper, RP-29. p. 59.
Singh, K. K., Bianchetti, R. A., Chen, G., & Meentemeyer, R. K. 2016. Assessing effect of dominant land-cover types and pattern on urban forest biomass estimated using LiDAR metrics. Urban Ecosystems.
Sivrikaya, F.,Saglam, B., Akay, A.E., and Bozali. N. 2014. Evaluation of Forest Fire Risk with GIS. Pol. J. Environ. Stud. Vol. 23(1):187-194
Yavuz M., Saglam B., Küçük Ö. Tüfekçioğlu A., 2014. Assessing Fuel Load and Fireline Intensity in Bayam Forest District, TURKEY Using Flam Map Software and Remote Sensing Techniques, "International Forest Fire Conferance in Black Sea Region, Kastamonu, Turkey.
ISPRS Annals of the Photogrammetry, Remote Sensing and Spatial Information Sciences, Volume IV-4/W4, 2017 4th International GeoAdvances Workshop, 14–15 October 2017, Safranbolu, Karabuk, Turkey
This contribution has been peer-reviewed. The double-blind peer-review was conducted on the basis of the full paper. https://doi.org/10.5194/isprs-annals-IV-4-W4-255-2017 | © Authors 2017. CC BY 4.0 License. 258