Tar. Bil. Der. Dergi web sayfası: www.agri.ankara.edu.tr/dergi Journal homepage: www.agri.ankara.edu.tr/journal
Determination of Quality Parameters in Maize Grain
by NIR Reflectance Spectroscopy
Cem Ömer EGESELa, Fatih KAHRIMANb
a
Çanakkale Onsekiz Mart University, Faculty of Agriculture, Department of Agricultural Biotechnology, Çanakkale, TURKEY
b
Çanakkale Onsekiz Mart University, Faculty of Agriculture, Department of Field Crop, Çanakkale, TURKEY
ARTICLE INFO
Research Article Agricultural Technologies
Corresponding author: Cem Ömer EGESEL, e-mail: [email protected], Tel: +90(286) 218 00 18 /1907 Received: 28 February 2012, Received in revised form: 10 April 2012, Accepted: 24 April 2012
ABSTRACT
The objective of this study is to compare different calibration models that could be used in the analysis of protein, oil, carbohydrate and ash contents in maize flour by NIRS. A total of 138 samples were used from 115 hybrids and 23 inbreds in the study as material. Based on reference analysis results, different estimation models were developed using Partial Least Squares Regression (PLSR) and Multiple Linear Regression (MLR) methods. Validation procedure of these models (n=110) were accomplished using samples from different genotypes (n=28). In both of the developed models, the highest accuracy was attained for protein content (r=0.990 for MLR and r=0.987 for PLSR). For the other traits analyzed, although MLR model yielded better results based on mathematical evaluations (rMLR=0.801, rPLSR=0.755 for carbohydrate, rMLR=0.823, rPLSR=0.723 for oil, rMLR=0.926 and rPLSR=0.810 for ash), external validation suggested PLSR model provide a lower error rate than MLR. Results suggested that protein content could be successfully estimated, whereas, for some other traits, such as carbohydrate and oil ratios, it seems that there is still need for more studies before getting accurate measurements using NIR methods. Profile analysis regarding the wavelengths potent in the models showed that the estimation power declined when the regression coefficients of the wavelengths included in the model were low. Among the analyzed traits, ash and oil contents seemed to be related with more spectral regions within the scanned spectra than protein and carbohydrate.
Keywords: Protein; Oil; Zea mays; Carbohydrate; Regression
Mısır Danesinde Kalite Özelliklerinin NIR Yansıma
Spektroskopisi ile Belirlenmesi
ESER BİLGİSİ
Araştırma Makalesi Tarım Teknolojileri
Sorumlu Yazar: Cem Ömer EGESEL, e-posta: [email protected], Tel: +90(286) 218 00 18 /1907 Geliş tarihi: 28 Şubat 2012, Düzeltmelerin gelişi: 10 Nisan 2012, Kabul: 24 Nisan 2012
ÖZET
Bu çalışmada mısır ununda protein, yağ, karbonhidrat ve kül oranının NIRS ile tespitinde kullanılabilecek farklı kalibrasyon modellerinin karşılaştırılması amaçlanmıştır. Çalışmada 115 hibrit genotip ve 23 adet saf hatta ait
TARI M B İL İMLER İ DERG İS İ
JOUR
NAL
OF
AGRICULTURAL
SCIENCES
18 (2012 ) 31 ‐42
toplam 138 örnek materyal olarak kullanılmıştır. Referans analizlerden elde edilen sonuçlara göre Kısmi En Küçük Kareler Regresyonu (PLSR) ve Çoklu Doğrusal Regresyon (MLR) yöntemleri kullanılarak farklı tahmin modelleri oluşturulmuştur. Oluşturulan modellerin (n=110) validasyon işlemi farklı genotipler (n=28) kullanılarak gerçekleştirilmiştir. Oluşturulan modellerin her ikisinde de en yüksek doğruluk protein oranında (rMLR=0.990 ve rPLSR=0.987) tespit edilmiştir. Diğer özellikler için MLR modeli PLSR modelinden (karbonhidrat için rMLR=0.801, rPLSR=0.755; yağ için rMLR=0.823, rPLSR=0.723; kül için rMLR=0.926, rPLSR=0.810) matematiksel modellere göre daha iyi sonuç vermiş olmasına karşın, dış validasyon işleminde PLSR modelinde yapılan tahminlerin MLR modeline göre hata payının düşük olduğu görülmüştür. Sonuçlar, NIR yöntemi ile protein oranının başarılı şekilde tahminlenebileceğini, karbonhidrat ve yağ gibi diğer özellikler için ise daha fazla çalışmalara ihtiyaç olduğunu ortaya koymuştur. Modellerde etkili olan dalga boylarına ait profil analizi, modele dahil edilen dalga boylarının regresyon katsıyaları düşük olduğunda tahmin gücünün de zayıf olduğunu göstermiştir. Ayrıca, kül ve yağ oranının, protein ve karbonhidrat oranına göre tarama yapılan bölgede daha fazla sayıda spektral bölge ile ilişkili olduğu belirlenmiştir.
Anahtar sözcükler: Protein; Yağ; Zea mays; Karbonhidrat; Regresyon
© Ankara Üniversitesi Ziraat Fakültesi
1. Introduction
Maize ranks first among all other annual crops in terms of worldwide production, and has a great variety of end uses. Enhancing the quality traits of maize grain, therefore, concerns a broad range of parties. The standard laboratory methods used in quality evaluation are generally time consuming, laborious, and expensive. This necessitates alternative methods that can eliminate abovementioned disadvantages and could be used with ease in breeding programs or industry (Orman & Schuman 1991). NIR spectroscopy is a method that fulfills such expectations. In this respect, many studies have been carried out to investigate the usability of NIR instruments in the analyses of maize grain quality traits (e.g., dry matter (Welle et al 2005), protein, starch, fatty acid composition (Baye et al 2006), and carotenoid composition (Berardo et al 2004)). The scientific literature on NIR spectroscopy roots back to 1930’s. Number of the articles published in this area between 1930 and 1940 was only 3, while this number were more than 1000 between 1980-1990 (Burns & Maghoses 1992), and climbed over 15000 in 1998 (Pasquini 2003). In Turkey, NIR spectroscopy studies related to cereal grain quality have been mostly done on wheat (Başlar & Ertugay 2011, Kahrıman & Egesel 2011), and no information is available on the historical progress. As evident by the dates of the articles, domestic studies in this area are rather new; and no report has been found on the grain
quality of maize.
The possibility of doing an analysis in any NIR spectroscopy instrument is dependent on the presence of a “calibration”, created for the estimation of the trait of interest within that particular instrument. The mathematical models enabling us to predict the concentration of a substance in an unknown sample based on the differences in electromagnetic spectrum is referred to as calibration (Martens & Naes 1992). Basics of the studies to generate calibrations in spectroscopy are based on the interaction of the light and the matter (Deaville & Flinn 2000). This stems from the fact that different chemical bond structures (e.g., C-H, N-H, O-H, S-H) found in the composition of a matter have different reactions to electromagnetic spectrum (Sandorfy et al 2007). Although NIR spectroscopy is not considered to be a novel technique, a new method is developed almost every day to increase the accuracy of analysis results. Considerable effort has been exerted to develop calibrations based on new mathematical models to enhance the accuracy and efficiency of NIR estimations. Most of the current NIR instruments utilize calibrations generated using assorted statistical techniques, such as Multiple Linear Regression (MLR), Partial Least Squares Regression (PLSR), Principal Components Analysis (PCA), and Artificial Neural Network (ANN) (Fülöp & Hancsok 2009). One of the most popular methods of the calibrations developed based on such techniques
for quantitative trait analyses is PLSR model (Shao et al 2010). The most important difference of this model compared to MLR model is the computation of coefficients for each independent variable (Rasco et al 1991). In MLR, only the regression coefficients of the best wavelength combinations determined by stepwise regression analysis are computed (Osborne 2000).
Scientific literature contains studies investigating the evaluation of the effectiveness of NIR calibrations created by means of different statistical methods. Some of the studies comparing different calibration models of grain quality traits suggest MLR calibration model is more convenient than PLSR model (Wehling et al 1993), while some others indicate similar results from the both models (Orman & Schuman 1991). Studies in drug and food industries, on the other hand, favor PLSR-based calibrations over MLR model in terms of reliability (Rasco et al 1991; Buchanan et al 1996). Presence of such differences in literature is an indication of the fact that the material and the trait subjected to NIR analysis have important effects on the estimation power of the generated model. Therefore, there is need for research investigating the differences among calibration models for a variety of crops and their different traits.
The main objective of this study was to compare the robustness of PLSR and MLR models for important quality traits in maize flour, using 138 genotypes with a broad range of genetic variability. We also discussed the relationships of electromagnetic spectrum interval within 1200-2400 nm wavelengths with the traits subjected to calibration models.
2. Material and Methods
2.1. Material
Grain samples from a total of 138 maize genotypes were used, consisting of 115 hybrids and 23 inbred lines. Of these, randomly selected 110 samples were utilized to generate the models and remaining 28 for the validation processes. Ears of the hybrid genotypes were derived from a yield trial carried out in Karacabey, Bursa, while
the inbreds were from an ongoing maize breeding study in Field Crops Department of Çanakkale Onsekiz Mart University.
2.2. Reference analyses
All samples were grounded for NIR and reference analyses using a laboratory mill (Fritsch Pulverisitte 14, Germany) with 0.5 mm sieve. Dry matter contents of samples were determined by oven method on 50 g flour, and those data were used to calculate the final results of grain quality analyses on a dry matter basis. Total protein content was determined by Kjeldahl (Gerhardt, Germany) method (ICC 1980). A Soxhlet instrument (Elektromag, 6MX25, Turkey) was utilized for oil analysis (AOAC 1990). Ash content was found according to ICC (2000) method, using a high temperature muffle furnace (Nabotherm, Germany). Total carbohydrate content was determined based on Anthron method (Gerhardt et al 1994) with a UV-VIS spectrophotometer (PG Instruments, England).
2.3. Calibration and validation of the models
Before performing standard laboratory analyses (protein, oil, carbohydrate, ash), raw spectra were taken from the samples (n=110) used in the calibration set at every 1 nm within 1200-2400 nm range on approximately 100 g flour from each genotype. The spectra were taken using a SAS 2400D NIR reflectance spectroscopy instrument at 24 different points of each maize sample using a rotating cup and recorded into the DEFAULT folder of SpectraStar program. Then, they were combined into a single file by means of InfoStar data conversion program. The combined data were transferred into Sensologic Calibration Workshop (CWS) program to generate calibration models. The raw spectra were transformed to absorbance, and then first derivative and SNV (Standard Normal Variate) transformation were sequentially applied to these data (Figure 1). Afterwards, calibration models based on PLSR and MLR models were generated. To determine and eliminate possible outliers in calibration models, we used T (Set value=2.5), H (Set value=3), D (Set value=3) and SR (Set value=3) statistics. In MLR models the best 19 wavelength
Figure 1-Examples of absorbance values and transformed spectra by first derivative and SNV transformation
Şekil 1-Kalibrasyon setinden alından absorbans değerleri ile birinci türev ve SNV transformasyonundan sonraki durumuna örnekler
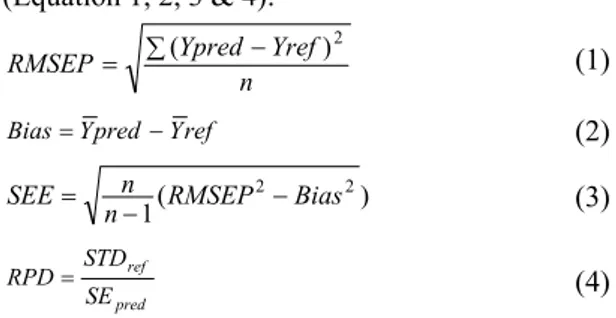
combination was pre-selected and the models were developed using those wavelengths. Because the highest number of wavelengths that could be selected for MLR models in CWS program is 19, and n/p (number of sample/number of wavelengths) ratio is preffered to be around 4, number of wavelengths included in the MLR model was set as 19. RMSEP, SEE, Bias (CWS Manual 2003) and RPD values (Bailleres et al., 2002) of the developed calibrations were calculated based on the following equations (Equation 1, 2, 3 & 4): n Yref Ypred RMSEP ( )2 (1) ref Y pred Y Bias (2) ) ( 1 2 2 Bias RMSEP nn SEE (3) pred ref SE STD RPD (4)
where; RMSEP is the root mean squares error of prediction; Ypred is the predicted value; Yref is the value measured by reference analysis; n is the number of samples; Bias is the difference between the predicted value and the value measured by
reference analysis; SEE is the standard of of estimation, STDref is the standard deviation of
reference analysis, and SEpred is the standard error
of predicted value. Other descriptive statistics and some calibration parameters were calculated by using SAS V8 statistical package program since they were not available in CWS program (SAS Institute 1999). To make the validation of the developed models, laboratory analyses were performed on the samples from 28 genotypes that were not used in the calibration set, and these samples were analyzed in NIR instrument. SEP and RMSEP values were determined according to the differences between NIRS predictions and reference analyses results.
3. Results and Discussion
3.1. General information
Robustness of a NIR calibration may be evaluated according to standard error of the estimate, and the correlation between the reference and predicted values (CWS Manual 2003). Additonally, optimum number of factors, a parameter used to evaluate PLSR models, should be neither too high nor too low. Another important parameter is RPD (Ratio of
Performance to Deviation), expressed as the ratio of standard deviation of the reference analysis of the investigated trait to the standard error of the estimate. If this value is below 2, the calibration is not suitable for use. Values in the range of 2-3 are considered good only for limited use, 3-5 are satisfactory, and values above 5 are reliable (Diller 2002). In addition to above mentioned parameters, the reliability of the calibration should be tested by means of external validation. That is, NIR measurements and reference analyses are carried out in a small set of samples, not used in the calibration set, and the differences between the predicted values and the results of the reference analyses are determined. Based on these differences, SEE and RMSEP values are calculated. These statistics ought to be as low as possible for the calibration to be accepted as reliable.
3.2. Comparison and evaluation of calibration models
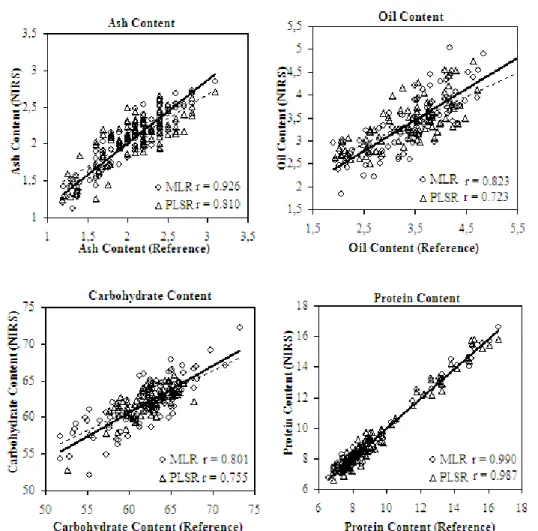
Descriptive statistics for the reference analyses of samples and the evaluation parameters for the developed calibration models were presented in Tables 1 & 2, respectively. The graphs showing the relationships between the NIR estimates calculated through calibration models and the reference analyses results were given in Figure 2.
Estimation of protein content by NIRS has emerged as an internationally accepted method and been used in many different crops/products. Since overtone and combination bands of amides and N-H bonds are clearly separated from other chemical compounds and do not overlap with each other (Siesler et al 2002) protein components in quantitative analyses can be effectively predicted by NIRS method. Therefore, the best results are generally obtained on protein ratio in calibration development studies. In this study, for both of the models regarding protein ratio, high levels of correlation (r=0.990) were detected between NIRS estimates and reference analyses results (Figure 1). Upon the comparison of MLR and PLSR models based on calibration evaluation parameters (RPD=6.3, SEE=0.42% for MLR, RPD=5.8, SEE=0.43% for PLSR) MLR model
appears to be more suitable for the estimation of protein ratio (Table 2). Studies about this subject in the literature show similar results (r=0.98 for PLSR, r=0.97 for MLR) with regards to the evaluation parameters of PLSR and MLR models for the estimation of protein content (Orman & Schumann 1991). Contemporary literature contains some reports regarding the estimation of protein ratio in maize grain by NIRS (Baye et al 2006; Jiang et al 2007; Spielbauer et al 2009; Tallada et al 2009). Our models had relatively higher estimation powers than the models in those studies; however, it would not be appropriate to make such a comparison because intact grain material were used there as opposed to ground material in our study, and the NIR instruments used were quite different.
In agricultural products, determination of oil content is probably the most tedious one, consuming a lot of time and chemicals, among the other reference analyses (Panford 1990). Therefore, estimation of oil content by means of NIRS method could be a potentially useful approach. In both models we developed here to estimate oil concentration, although the error values of estimation were small (RMSEP=0.47%, SEE=0.49% for PLS, RMSEP=0.45%, SEE=0.50% for ML), RPD values for both models were undesirably low (RDP=1.4 for PLSR, RPD=1.6 for MLR); thereby reducing the relationship between reference and NIRS analyses, and weakening the estimation power of the models (Table 2 & Figure 2). Our values are comparably higher than those (r=0.76 for both models) reported by Orman & Schumann (1991), who used ground maize kernels as we did. Despite the weak estimation power for both models, PLSR model seemed to have a higher chance of giving relatively better results in estimation of oil content. This is because a lot of spectral regions are needed for the estimation of oil content by NIRS, and PLSR model which can be established with more number of independent variables than MLR models, satisfies this requirement. Spielbauer et al (2009) reported a higher
Table 1-Descriptive statistics for the reference analyses of genotype sets used in calibration and validation procedures
Çizelge 1-Kalibrasyon ve validasyon işlemlerinde kullanılan genotip setlerinin referans analizlerle ilgili tanıtıcı istatistikleri
Calibration Set (n=110) Validation Set (n=28)
Trait Mean S.D Range Mean S.D Range
Protein Content (%) 9.29 2.45 6.57-19.60 8.49 1.09 7.03-11.29 Oil Content (%) 3.42 0.87 1.79-7.11 3.40 0.80 1.79-4.87 Carbohydrate Content (%) 61.9 4.5 49.7-75.0 62.9 5.3 49.7-75.0 Ash Content (%) 2.14 0.46 1.19-3.20 2.48 0.40 1.80-3.20
Table 2-Evaluation parameters for the developed calibration models
Çizelge 2-Oluşturulan kalibrasyon modelleri ile ilgili değerlendirme parametreleri
FS SEE RMSEP RPD Trait PLSR PLSR MLR PLSR MLR PLSR MLR Protein Content (%) 6 0.43 0.42 0.41 0.38 5.9 6.3 Oil Content (%) 7 0.49 0.50 0.47 0.45 1.4 1.6 Carbohydrate Content (%) 3 1.80 2.70 1.75 2.43 1.5 1.5 Ash Content (%) 8 0.25 0.18 0.24 0.16 1.6 2.3
SEE, standard error od estimation; FS, factor number used in regression model; RMSEP, root mean square error of prediction; RPD, relative performance to deviation, PLSR, partial least squares regression; MLR, multiple linear regression
estimation power (r=0.86) than our model for oil ratio. This may partly be due to the difference between the ranges of the variation for oil ratio existed in the two sets of samples (1.79-7.11% in this study vs. 0.7-19.1 in Spielbauer’s). However, as indicated above (for protein ratio), most of the difference probably comes from the use of different material (intact vs. ground seeds) and different instruments.
Carbohydrate constitutes the highest proportion in a typical cereal grain. Main components of carbohydrates are carbon, hydrogen and oxygen; and this may cause it to be related with several absorption regions on electromagnetic spectrum (Shenk et al 1992). This may, in turn, complicate the estimation of carbohydrates by NIR spectra. As a matter of fact, a comparison of the investigated traits indicated that both PLSR (FS=3, SEE=1.80, RMSEP=1.75, RPD=1.5) and MLR (SEE=2.70, RMSEP=2.43, RPD=1.5) models generated for carbohydrate had lower accuracy than the respective models for other traits in our study (Table 2). The correlation coefficient between the estimated values of
carbohydrate by the generated models and the reference analysis results was somewhat low in PLS model (r=0.755), while it was a little higher in MLR model (r=0.801). Orman & Schuman (1991) reported comparable values earlier. Higher figures were obtained in some other studies using spectra taken from a single seed (Baye et al 2006; Spielbauer et al 2009). However, in those studies, the models were created to estimate starch ratio rather than the total carbohydrates. This fact, coupled with different spectrum intervals of the instruments (900-1690 vs. 1200-2400 nm), may be the reasons for obtaining different results.
Ash content indicates total mineral matter in the grain. Minerals are generally rather low in biological compounds and theoretically they cannot be determined in NIR region. These factors limit the delicacy of NIRS analysis for ash content (Shenk et al 1992). The MLR model we developed was superior in terms of calibration evaluations (SEE=0.18%, RMSEP=0.16, RPD=2.3) over PLSR model (SEE=0.25%, RMSEP=0.24, RPD=1.6) (Table 2). Indeed, the correlation between the estimated and analyzed
Figure 2-Relationships between NIRS estimations and reference method results for the developed calibration methods
Şekil 2-Oluşturulan kalibrasyon modellerine göre NIRS tahminleri ve referans yöntemler arasındaki ilişkiler
values was r=0.810 in PLSR model, whereas r=0.926 in MLR model (Figure 2). For both of the models, the trait with the lowest error rate and a possibly high accuracy of estimation was ash ratio, among the other traits subjected to calibration.
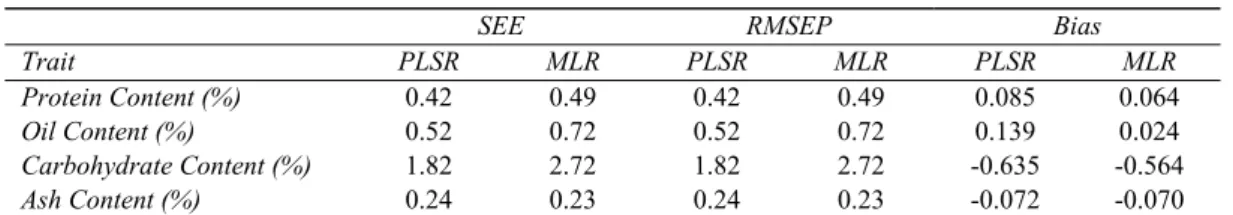
As a result of external validation process carried out to verify the prediction power of the generated models; error rates for protein, oil and ash were lower in the estimations based on PLSR
model (SEP values 0.24 for ash, 0.42 for protein, 0.70 for oil and 1.87 for carbohydrate) than those in MLR model (SEP values 0.23 for ash, 0.49 for protein, 0.72 for oil and 2.72 for carbohydrate) (Table 3). This may be interpreted as, despite being advantageous mathematically according to evaluation parameters, MLR model is unable to tolerate the effects caused by the instrument and some outer factors; and PLSR model has smaller error rate in NIRS estimations. External validation
Table 3-Evaluation parameters for the external validation of models
Çizelge 3-Modellerin dış validasyonu için değerlendirme parametreleri
SEE RMSEP Bias
Trait PLSR MLR PLSR MLR PLSR MLR
Protein Content (%) 0.42 0.49 0.42 0.49 0.085 0.064 Oil Content (%) 0.52 0.72 0.52 0.72 0.139 0.024 Carbohydrate Content (%) 1.82 2.72 1.82 2.72 -0.635 -0.564 Ash Content (%) 0.24 0.23 0.24 0.23 -0.072 -0.070
SEE, standard error of estimate; RMSEP, root mean square error of prediction, PLSR, partial least squares regression; MLR,
multiple linear regression
indicated error rates were higher for carbohydrate than those for the other traits of interest. Protein and oil estimates were positively biased, while carbohydrate and ash were negatively biased for both mathematical models (Table 3).
3.3. Relationships between the wavelengths and calibration parameters
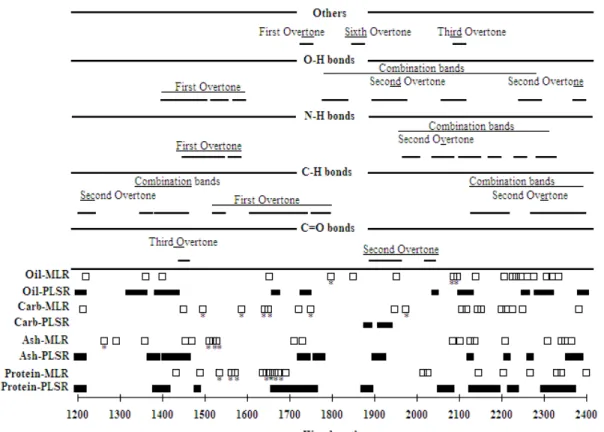
Figure 3 was composed to show the similarities of significant wavelengths affecting the estimation in the created models, with the NIR regions pointed out in the literature. In this graph, the effective wavelengths in our models were shown at the bottom, while the absorption regions of the chemical bonds found in biological substances were shown at the top based, based on the literature. The regions with 0.20 and higher regression coefficients in PLSR models were shown in the figure; while, in MLR models, the wavelengths with high regression coefficient among the 19 wavelengths included in the model were pointed out with an asterisk. By means of this graphic, we attempted to summarize the wavelengths matching up with the NIR absorption profiles reported as reference in the literature and existed in the model developed by us.
It was determined that the effective wavelengths for protein were located in the first overtone and combination band regions of C-H and N-H bonds (Figure 3). The wavelengths being effective in the models developed for ash were in the proximity of first overtone region of O-H and N-H bonds. There might be some relations between the ash content and some wavelengths in O-H, C-H and N-H combination band regions (Figure 3). Wavelengths in the regression models
developed to estimate carbohydrate content showed proximity with the first overtone region of C-H bonds and combination band regions of O-H bonds. In the models developed for oil, C-H and O-H bands were determined to be in the combination band vibration regions (Figure 3). The absorption regions in question for protein (Cozzolino et al 2006) and oil (Siesler et al 2002) tally with the wavelengths reported in the literature. Besides, it was seen that wavelengths with high regression coefficient were present outside of the reference absorption regions in the developed models. These wavelengths can be described as “indirect wavelengths” having no interaction with reference chemical bond structures, but are effective in the estimation of a trait.
Overlapping of band vibrations associated with different traits in NIR region (Rodriguez-Otero et al 1997) complicates explaining the relationships between the wavelengths and the calibrated trait. Along with this, low concentration of a trait subjected to calibration is another limiting factor. Such traits may have low NIR absorption band number and regression coefficient for wavelengths on these bands. Results of this study, too, show that estimation accuracy is low when a trait’s wavelengths in the model have low regression coefficient (e.g., carbohydrate) and/or when a trait has a low concentration (e.g., oil and ash). Having absorption bands on too many spectrum regions for a trait is another important problem which causes overlapping of band vibrations. This is one of the most important factors limiting the NIRS
Figure 3-Vibration regions of chemical bonds within NIR region and profiles of wavelengths influential on the developed calibration models
Şekil 3-Kimyasal bağların NIR bölgesinde titreşim bölgeleri ile oluşturulan kalibrasyon modellerinde etkili olan dalga boyu profilleri
analysis of biological matters with similar chemical bonds, or components with similar absorption regions despite having different structures. Indeed, the fact that O-H bonds have a wide absorption region around 2100 nm mask the energy changes caused by the absorption of amide bonds in the structure of proteins (Deaville & Flinn 2000). Such interactions may be a reason for the poor estimation power of the models for the traits having too many wavelengths.
4. Conclusions
The results of this study produced significant differences between the models in terms of estimation power. For the calibrations developed
for protein, the correlation coefficients between the NIRS estimation and reference analysis were very similar in both models (r=0.990 for MLR and r=0.987 for PLSR), while for all the other traits MLR model yielded better results in terms of calibration evaluation parameters. Carbohydrate and oil contents were the traits with the lowest estimation capacity in both models. Calibration evaluation parameters suggested that MLR model could offer more accurate results even with fewer wavelengths. Thus, using a higher number of wavelengths would not present an advantage in NIRS calibration models based on evaluation parameters. However, external validation procedure showed a decline of error rate in the
estimation through the inclusion of the entire scanned interval of spectra into the model. The wavelengths with the highest regression
coefficients within the scanned electromagnetic spectrum interval (1200-2400 nm) for the evaluated traits were different in PLSR and MLR models.
In conclusion, NIR spectroscopy method, replacing time consuming and tedious laboratory analyses, is capable of providing satisfactory estimations for some traits using both MLR and PLSR models, especially for protein ratio. For
some other traits, such as carbohydrate and oil ratios, it seems that there is still need for more studies before getting accurate measurements using NIRS methods.
Acknowledgements
The authors thank Scientific Research Commission of Çanakkale Onsekiz Mart University for the financial support through the project no. BAP 2009/28.
Nomenclature
NIRS near infrared spectroscopy
PCA principal component analysis
ANN artifical neural network
PLSR partial least square regression
MLR multiple linear regression
RMSEP root mean square of prediction
SEE standard error of estimate, %
SEP standard error of prediction
RPD relative performance to deviation
N number of samples
R correlation coefficient
Ypred predicted value
Yref result of reference analysis
SNV standard normal variate
References
AOAC (1990). Methods of the Association of Official Analytical Chemists, Vol. II. 15th ed. Method No. 920.85. Arlington Virginia USA AOAC p. 780 Bailleres H, Davrieux F & Ham-Pichavant F (2002).
Near infrared analysis as a tool for rapid screening of some major wood characteristics in an eucalyptus breeding program. Annals of Forest Science 59: 479–490
Başlar M & Ertugay M F (2011). Determination of protein and gluten quality-related parameters of wheat flour using near-infrared reflectance spectroscopy (NIRS). Turkish Journal of Agricultural and Forestry 35:139-144
Baye T M, Pearson T C & Mark Settles A (2006).
Development of a calibration to predict maize seed composition using single kernel near infrared spectroscopy. Journal of Cereal Science 43: 236– 243
Berardo N, Brenna O V, Amato A, Valotia P, Pisacanea V & Mottoa M (2004). Carotenoids concentration among maize genotypes measured by near infrared reflectance spectroscopy (NIRS). Innovative Food Science and Emerging Technologies 5: 393-398 Buchanan B R, Baxter M A, Chen T-S, Qin X-Z &
Robinson P A (1996). Use of Near-Infrared Spectroscopy to evaluate an active in a film coated tablet. Pharmaceutical Research 13: 616-621 Cozzolino D, Delucchi I, Kholi M & Vázquez D
(2006). Use of near infrared reflectance spectroscopy to evaluate quality characteristics in
whole-wheat grain. Agricultura Técnica 66: 370-375
CWS Manual (2003). Sensologic Calibration Workshop Version 2.02, Sensologic Gmbh, Germany
Deaville E R & Flinn P C (2000). (eds D.I. Givens, E. Owen, R.F.E. Axford and H.M. Omed) Near-Infrared (NIR) Spectroscopy: an Alternative Approach for the Estimation of Forage Quality and Voluntary Intake, Forage Evaluation in Ruminant Nutrition, 301-320
Diller M (2002). Investigations for the Development of a NIRS-method for Potatoes in Organic Farming with Special Reference to the Influence of the Year and the Potato Line (in German). PhD Thesis. Rheinische Friedrich-Wilhelms-Universitat, Bonn, Germany
Fülöp A & Hancsok J (2009). Comparison of calibration models based on near infrared spectroscopy data for the determination of plant oil properties. Chemical Engineering Transactions 17: 445-450
Gerhardt P, Murray R G E, Wood W A & Krieg N R (1994). Methods for General and Molecular Bacteriology, ASM, Washington DC. ISBN 1-55581-048-9, p 518
ICC (1980). ICC Standard No: 105/1. Method for the Determination of Crude Protein in Cereals and Cereal Products for Food and for Feed. Standard Methods of the International Association for Cereal Chemistry (ICC). Verlag Moritz Schafer. Detmold ICC (2000). Determination of Ash in Cereal and Cereal
Products. Standard Methods of the International Association for Cereal Chemistry (ICC), ICC Standard No: 104/1. Verlag Moritz Schafer. Detmold
Jiang H Y, Zhu Y J, Wei L M, Dai J R, Song T M, Yan Y L & Chen S J (2007). Analysis of protein, starch and oil content of single intact kernels by near infrared reflectance spectroscopy (NIRS) in maize (Zea mays L.). Plant Breeding 126:492-497 Kahrıman F & Egesel C Ö (2011). Development of a
calibration model to estimate quality traits in wheat flour using NIR (Near Infrared Reflectance) spectroscopy. Research Journal of Agricultural Sciences 43:392-400
Martens H & Naes T (1992). Multivariate Calibration. J. Wiley and Sons, Chichester, UK.pp:25
Orman B A & Schumann R A (1991). Comparison of near-infrared spectroscopy calibration methods for the prediction of protein, oil, and starch in maize
grain. Journal of Agricultural Food and Chemisty 39: 883-886
Osborne B G (2000). Near-infrared spectroscopy in food analysis, In: Encyclopedia in analystical Cehemistiry (Ed: R. A. Meyers), John Wiley Sons Pandorf J A & deMan J M (1990). Determination of oil
content of seeds by NIR: Influence of fatty acid composition on wavelength selection. Journal of American Oil Chemistry Society 67:473-482
Pasquini C (2003) Near infrared spectroscopy: Fundamentals, practical aspects and analytical applications Journal of the Brazilian Chemical Society 14:198–219.
Rasco B A, Miller C E & King T L (1991). Utilization of NIR spectroscopy to estimate the proximate composition of trout muscle with minimal sample pretreatment. Journal of Agricultural Food and Chemistry 39: 67-72
Rodriguez-Otero J L, Hermida M & Centeno J (1997). Analysis of dairy products by near-infrared spectroscopy: A review. Journal of Agricultural Food and Chemisty 45:2815-2819
Sandorfy C, Buchet R & Lachenal G (2007). Principles of molecular vibrations for near-infrared spectroscopy. In Near-Infrared Spectroscopy in Food Science and Technology; Ozaki, Y., McClure, W. F., Christy, A. A., Eds.; John Wiley and Sons, Inc.: Hoboken, NJ, pp 11-46
SAS Institute (1999). SAS V8 User Manual. SAS Institue Cary NC
Shenk J S, Workman J J & Westerhaus M O (1992). Application of NIR spectroscopy to agricultural products. In: Burns, D.A., Ciurczak, E.W. (Eds.), Handbook of Near-infrared Analysis, vol. 13. Practical Spectroscopy Series, Marcel Dekker, New York, pp. 383–431
Siesler H W, Ozaki Y, Kawata S & Heise H M (2002). Near-Infrared Spectroscopy. Principles, Instruments, Applications. Wiley-VCH, Weinheim Spielbauer G, Armstrong P, Baier J W, Allen W B,
Richardson K, Shen B & Settles A M (2009). High-throughput near-infrared reflectance spectroscopy for predicting quantitative and qualitative composition phenotypes of individual maize kernels. Cereal Chemistry 86(5): 556-564 Tallada J G, Palacios-Rojas N & Armstrong P R
(2009). Prediction of maize seed attributes using a rapid single kernel near infrared instrument. Journal of Cereal Science 50:381–387
R (1993). Prediction of wet-milling starch yield from corn by near-infrared spectroscopy. Cereal Chemisty 70:720-723
Welle R, Greten W, Müler T, Weber G & Wehrmann H (2005). Application of near infrared spectroscopy on-combine in corn grain breeding. Journal of Near Infrared Spectroscopy 13:69-75