ISSN: 2147-611X
www.ijemst.com
Mathematically
Gifted
High
School
Students’ Approaches to Developing
Visual Proofs (VP) and Preliminary Ideas
about VP
Isıkhan Ugurel1, H. Sevgi Morali1, Ozge Karahan1, Burcak
Boz2
1Dokuz Eylul University
2Mugla Sıtkı Koçman University
To cite this article:
Ugurel, I., Morali, H.S., Karahan, O., & Boz, B. (2016). Mathematically gifted high school
students‟ approaches to developing visual proofs (VP) and preliminary ideas about VP.
International Journal of Education in Mathematics, Science and Technology, 4(3), 174-197.
DOI:10.18404/ijemst.61686
This article may be used for research, teaching, and private study purposes.
Any substantial or systematic reproduction, redistribution, reselling, loan, sub-licensing,
systematic supply, or distribution in any form to anyone is expressly forbidden.
Authors alone are responsible for the contents of their articles. The journal owns the
copyright of the articles.
The publisher shall not be liable for any loss, actions, claims, proceedings, demand, or
costs or damages whatsoever or howsoever caused arising directly or indirectly in
connection with or arising out of the use of the research material.
Volume 4, Number 3, 2016
DOI:10.18404/ijemst.61686
Mathematically Gifted High School Students’ Approaches to Developing
Visual Proofs (VP) and Preliminary Ideas about VP
Isikhan Ugurel, H. Sevgi Morali, Ozge Karahan, Burcak Boz
Article Info
Abstract
Article History Received: 11 June 2015
The purpose of this study is to describe the procedure and examples of visual proofs (VP-or proof without words) developed by gifted mathematics secondary school students after their experiences. The participants of this study are three male 9th grade students enrolled in a private science high school. In the first stage of the research a briefing was given to the three selected students. Then, structure and examples of VPs are discussed by the participants. During this process the researchers and participants met once a week for five weeks. The participants developed VP examples stage-by-stage. The qualitative research method was used to analyze the data gathered from both the VPs developed by the participants and also from the participants‟ responses to a written questionnaire. According to analysis of the VPs, the examples were found to be in three categories. Examples of each category are presented in the study and discussed, along with participants‟ thoughts about each of them.
Accepted: 17 November 2015 Keyword Proof Visual proof Proof without words Mathematically gifted student
Modeling a proof
Introduction
Proof education has long been the focal point of comprehensive research studies in the literature of mathematics education, for more than 20 years (Chin & Lin, 2009; Hanna, 2008). The sheer volume of studies indicates the importance of proof as one of the vital building blocks of school mathematics. Proof ensures making mathematics, communicating in a mathematical way, and storing mathematical knowledge (Schoenfeld, 1994). According to Tall (1998), proof is the basis of mathematics. It is possible to put forward what proof is or what it means in various ways. Hanna, de Villiers, Arzarello, Dreyfus, Duran-Guerrier, Jahnke, Lin, Selden, Tall and Yerdokimov (2009) state that proof has different meanings in today‟s professional area of mathematics. Nolt, Rohatyn and Varzi (1998) define proof as deriving results from hypotheses using generally valid rules of inference. According to Knuth (2002b), a deductive argument shows why a statement is correct on the basis of other mathematical results and/or introspections towards mathematical structures in the said statement. No matter under which circumstances it is dealt with, proof plays a crucial role in the structure and development of mathematics (Hanna et al., 2009; Schoenfeld, 1994). A proof, in fact, is an important tool that encourages understanding in its own right (Ball, Hoyles, Jahnke & Movshovits-Hadar, 2002). Proof may assist learners to perceive integrity of mathematics and to reach its meaning in the deepest respect; hence, it is important in terms of providing learners with the unchangeable fundamentals of mathematics (Waring, 2008). The proving process requires several core skills such as supporting assumptions, reviewing given features or organizing logical deductions. Due to such skill requirements, many students experience problems in proving and with the processes of proving. Due to the increasing importance of proof in mathematics curricula, there have been several studies conducted by mathematics educators that deal with problems experienced by students regarding proof (Smith, 2006). Studies generally conclude that students have some negativity about proof. According to Segal (1999), students consider mathematical proof difficult for a number of reasons. Ball et al., (2002) states that proof seems a meaningless ritual for many students. Students therefore need help to understand the proof in order to remove such negative thoughts and feelings against the concept of proof. Understanding proof is an important skill, not only for students having problem with proof as a process, but also for all learners. One of the fundamental ways of helping students in understanding proof and proving process is to have them contend with a proof. Hanna (2000) states that it should be achievable to make a definition and to follow all valid connections for inductive reasoning in order for a student to be able to understand the proof, and claims that students should work on proofs and create new proofs in order to acknowledge this.
In addition to common approaches, it would be useful to make use of alternative approaches in understanding and creating proofs. Visualization is one such approach that may be used in order to understand proof as to help mathematical understanding. Besides general proof methods, using visual elements in order to increase the awareness of students may be beneficial, both for attracting the attention of and for assisting students to make connections among subject matters and concepts. Just like other scientific disciplines, mathematics education gives importance to demonstrations (Kadunz, 2006). It is generally accepted that visualization and exemplification play a vital role in mathematics (Casselman, 2000). For instance diagrams and charts play various roles in mathematical texts; if used properly, a diagram supports reasoning or may be considered as reasoning in itself (Maanen, 2006). From this perspective, combining visual elements with proof may assist students to get past any problems they may have about proofs; helping them to better understand.
According to Borwein and Jörgenson (1997), visual reasoning generally plays a greater role in mathematics and some visual representations can even constitute proofs. The discussion document of ICMI Study 19 (Hanna, et al., 2009) stated that verbal, visual or formal ways of proving may have an effect on understanding the proofs and learning about proofs in general. Hence, a review of studies conducted on visualization of mathematics and students‟ proof processes shows that there is a specific area that is called visual proof (or proof without words; PWW), embracing these two titles.
Visual Proofs
One of the most renowned resources about visual proofs (VPs) is Roger B. Nelsen‟s 1993 book titled “Proof Without Words: Exercises in Visual Thinking”. Nelsen defines nonverbal proofs in the introduction part as follows:
PWW are pictures or diagrams that help the observer see why a particular statement may be true, and also to see how one might begin to go about proving it true. In some, an equation or two may appear in order to guide the observer in this process. But the emphasis is clearly on providing visual clues to the observer to stimulate mathematical thought (Nelsen, 1993: p.VI).
Maanen (2006) describes VP as being comprised of a series of drawings that encourage thinking. Similar to the first definition, Alsina and Nelsen (2010) define nonverbal proofs as pictures and diagrams that show why a mathematical statement is true, and that help to assist in starting to prove its trueness. In the introduction part of his book, Nelsen (1993) states that VPs first emerged as a look-see diagram in Martin Gardner‟s column in
Scientific American in 1973, and then been published regularly in Mathematics Magazine and The College Mathematics Journal in 1975. Gardner sets forth that proof may generally be supported simply and correctly by
a geometrical analogue, and that it is possible to see the trueness of a proof at a single glance (cited in Nelsen, 1993). According to Maanen (2006), on the other hand, the first source with nonverbal proofs is the geometry book of an unbeknown author named Sybrandt Hansz Cardinael, estimated to be published in 1612. The original title of this Dutch writer‟s book is Hondert Geometrische Questien Met Hare Solutien. Maanen (2006) stated that Cardinael did not make any mathematical explanation besides visual elements in the proof, and exemplified it with the proof of the Pythagoras theorem. It was also stated that Cardinael provided nonverbal proofs not only related to geometry, but also to arithmetic. Bell (2011) also gives an example of the proof of Pythagorean Theorem drawings found in one of the oldest Chinese textbooks, titled “Arithmetic Classic of Gnomon and the Circular Paths of Heaven” (ca.300 BCE), and which was shaped into the last version of root calculation (Vijaganita) by the Indian mathematician Bhaskara (1114-85 CE).
VPs can be created using dots, squares, spheres, cubes and other similar easy and simple drawing tools. VPs may be used to prove theorems in geometry, number theory, trigonometry, analysis, inequalities, and other areas of mathematics (Alsina & Nelsen, 2010). Hence, visual elements are not only used to understand theorem and proof, but also to attract attention to the approach of the proof, as well as to ensure the proof for a long time (Hanna & Sidoli, 2007). From this perspective, compared to other traditional approaches to proof, nonverbal proofs allow for clear understanding of and reason about mathematical concepts (Waring, 2008).
There are few in-classroom studies about VPs in the literature (particularly in Turkey), yet it is similarly hard to find studies including analysis based on participant performance or instructional practices in Turkey. Hence, Maanen (2006) also pointed out the importance and necessity for more studies on VP. It is seen that studies on VP generally includes basic information of the subject matter as well as some historical or unique examples (e.g. Alsina & Nelson, 2010; Maanen, 2006; Casselman, 2000; Siu, 1993). Nonetheless, although limited, there are studies approaching the phenomenon from an instructional perspective. For instance Flores (1992) presents
VP samples used in his „problem solving and proof‟ classes. He uses VPs as an alternative approach for mathematical induction, and emphasizes the practicality of VPs for students to understand why mathematical reasoning formulas are true: “These diagrams have the advantage of being proofs that explain, giving students some insight into how these formulas can be derived …” (p.394). Despite not having conducted a classroom application, Knuth (2002a) uses VP to present examples of explanatory proof (that explains why a statement is true), which is one of the fundamental functions of proofs from an educational perspective. Describing the role of proofs based on such visual models as “fostering understanding of the underlying mathematics” (p.487), Knuth emphasizes that these models can help teachers create more functional learning environments for teaching proofs within the frame of reform movements in mathematics education. Another study that provides significant data parallel to our objective in instructional terms was conducted by Bardelle (2009). This is a study on the use of VPs in mathematics education where Bardelle studied with 13 mathematics students at higher education level in Italy and gave them two tasks including VPs (Pythagoras theorem and Geometric Series). The researcher then wanted the participants, who were unfamiliar with such visual proofs, to describe them and reviewed their responses. It was seen that the participants were not able to succeed in understanding, describing and reconstructing the proof. In another study, Bell (2011), also a mathematics teacher, used VP in her classroom through online class discussion. She claimed that use of technology encouraged class discussions about VP and also allowed for peer learning, and helped to improve students‟ written communication of mathematical ideas. On the other hand, Dickerson and Doerr (2015) tried to understand mathematics teachers‟ perception on proof in mathematics classes. The researchers concluded that the more experienced teachers satisfied by less formal arguments and proof based on concrete or visual features (VP), whereas less experienced ones stressed the importance of details in proof writing and standard language.
A review of Turkish literature on mathematics education found only one research study based on the instructional application of VPs. Doruk, Kıymaz and Horzum (2012) conducted a study with 32 pre-service teachers at a school of education to develop a concrete, visual model for (a+b)3 = a3+3a2b+3ab2+b3 identity and for constructing a proof accordingly. The study concluded that the participants provided positive views, and were successful in constructing the proof for the given identity as well as understanding it. The authors recommended to conduct similar studies on visualization of proofs and using concrete models.
In the rich literature on proof and proving, there are many studies on visual proof and examples of its use, hence, there is a general tendency for interest in VPs (Bardelle, 2009). However, it has been observed that there are insufficient studies on the role and function of VPs in proof education or on classroom applications or other instructional activities related to understanding and creating VPs. There is a need for more research in this area. This study aims to contribute to fill the gap in this area of instructional applications by describing the examples developed by mathematically gifted secondary education students following a short experience with VPs, and at determining their general thoughts towards VPs. The research question in this study is therefore: “What is the structure of VP examples developed by mathematically gifted secondary education students, and what are their thoughts about VPs in this regard?”
Method
This study is a descriptive qualitative research. Descriptive qualitative research design helps to understand the concept investigated throughout the study in detail.
Participants
Three 9th grade male students are the participants of the study who are all enrolled at a Science High School in a metropolitan city of western Turkey. The reason for choosing a science high school is the teaching of proofs at this type of high school. According to the researchers‟ experiences and observations, apart from some Anatolian High Schools and Science High Schools, other high schools only cover proof in their geometry courses or a limited version of proofs on mathematics courses. According to researchers, the most important reason for this picture is the exams held in the country and the national university entrance exam which involves only a few proof-related questions. In addition, the other important reason is that the way of serving the proof and proof techniques in previous curricula. However, as a result of the aim of the Science High Schools‟ foundation and the teaching principles of these schools, the value and place of the proofs and proving in mathematics curricula are relatively more prominent. Because of this, the researchers thought it would be more useful for the VP research to work with Science High Schools students who have experiences with proof and proof concept. Six students were selected as candidate participants for the research, according to the math and geometry teachers‟
opinions among the high achievers who volunteered for the study. During the selection procedure, one-to-one interviews were conducted and some explanations given about the study. In the interviews, participants were asked about their thoughts on proofs. In doing this, the aim was not to construct formal conclusions about proof, but just to obtain some views about the thought patterns of the participants in order to help select participants who are both keen to take part in the research study and who possess the most knowledge about proofs. The participants were given pseudonyms as Burak, Mustafa and Erdem. These students are high achievers both in their mathematics and geometry courses and all received scholarships from the schoolwhich is a private school. During selection of the participants, the following criteria were considered; that they all volunteered for the study, received very high scores from their geometry and mathematics courses and have not seen VPs before.
Data Handling
In the first part of the study, a three hour briefing is given about VPs to the three selected students at the end of the spring semester. After a short introduction, the researchers and students discussed the structure of VPs and some examples. Discussions were conducted as out-of-class activities in a separate classroom. Three students and two researchers agreed on a specific time for this joint study. Researchers kept direct information provision at a minimum level in these sessions, and preferred to mostly apply question-answer technique to discuss the structure of the VPs, whether this structure could be changed, how the VPs could be produced, whether the visual models were understandable easily by the students. This process was conducted in two one-and-half-hour sessions in a day. Later, the 10 VP examples selected from the literature are given to students to study them outside of school. It is considered that the selected examples are not complex, but that they are different to each other, and suitable for the participants‟ level of understanding.
Students were asked to study on 10 VPs individually. After they completed the individual studies, they were allowed to share their ideas with each other if they wished. Above figure shows four examples among 10 VPs given to the students. The other VP examples involved the following mathematical statements:
5th statement: Pythogorean Theorem (a2+b2=c2) [Nelsen, 1993:7] 6th statement: a2-b2= (a-b).(a+b) [Tall, 1995:6]
7th statement: n2-1=4.((n-1)/2)).((n+1)/2)) [Landauer, 1985:203]
8th statement: The area of a triangle equals the product of its semi-perimeter and the radius of the inscribed circle. [Alsina & Nelsen, 2006:110]
9th statement: 1/4+ (1/4)2+(1/4)3+ … = 1/3 [Alsina & Nelson, 2006:74].
While studying with 10 VPs, additional clarifications were needed only for the 3rd and the 8th statements (measurement of the angle seeing the diameter and the concept of semi-perimeter) for students to recall the subject, and other statements did not require any explanation or clarification. Over the following week, the three participants and the first author gathered to discuss the 10 VPs through visual modeling of the proofs. In this session, students‟ procedures of constructing the meaning of VPs are considered and for some examples, the group worked together to construct the meaning and modeling of VPs. In the next step, they were asked to construct their own VP either working by themselves or together. During this time, the two authors and the participants met once a week for five weeks to discuss the examples produced by the participants. These sessions were conducted in a high school out of the school time. This process helped students to share their opinion with the other participants and the researchers. The participants were allowed to criticize the others‟ VPs as well. On the other hand, the researchers participated passively (listening, observing, asking short questions just to trigger discussion) in the procedure. They did not make any subjective comments on the constructed VPs like „true‟, „not true‟ or „very good‟. During the last week of the study, participants gave their final shape of the constructed VPs and they finished off the visual models by using a virtual tool. Right after this procedure, participants were given 40 minutes and asked to fill out a five question written form about their opinion on VP. The VP examples and written interview forms represent the data of this study.
The Process
At the beginning of the study, in the first session in which the researchers and participants worked together, it is realized that the participants had no idea about VPs and had not seen any examples before. The very first reaction of the participants about VPs is that they are very different from the usual proofs. The researchers explained that the VPs are not formal proof techniques - in the literature, some researchers accepted them as proofs on some levels or the alternative tools to help understand the proofs. After this explanation, the participants concentrated on not only examining the VPs, but also to discover them. In the second week, the participants‟ interests increased readily and the adaptation of working on VPs was obtained. This progress was beyond the researchers expectations. During the process of investigating the 10 given VP examples, the participants became interrogative and worked in cooperation with each other; making their work very productive. One of the indicators of this situation was that the participants were very eager to develop their own VPs and they created a competitive environment. The other indicator is that although the researchers did not make any manipulation or restriction during the developing of a model until the fourth week, the participants stated their own requests. The first request was for some resources about inequalities, identities and formulas that could not be found in the school textbooks, or from their school mathematics. After this request, the researchers made a list and presented it to the participants. The participants were free to select any of them and create visualizations of them. Although a list was prepared for the participants, it was mentioned that they were not restricted to just that list, and that they could pick any mathematical statement to visualize. The other request from the participants was the use of computer software rather than paper-pencil for modeling the VPs. The participants were told that they could use MS PowerPoint and Flash programs. All three participants were capable of using MS PowerPoint efficiently and one of them could also use Flash. After accepting their request, they transported their drafts across to the virtual environment in a very short time.
Although Mustafa worked individually most of the time during the developing of the VPs, Burak and Erdem worked together, as was observed during the discussion sessions where they were interacting with each other. By the third week of the study, discussion about whether the VP developed on the suggestion of the first author can be categorized is considered by the participants and the researchers together. After this discussion, all the VPs were reexamined and the researchers agreed that the developed visual proofs could be categorized into three types. After this, the participants were told about the categories, which they agreed, and then they reorganized their developed VPs and also produced new VPs according to these categories. Before this point, the participants already had models in each category, developed from their own desires knowledge. After the categories were set, VPs continued to be developed by the participants based on their own wishes and knowledge, however, now there was a general framework and some boundaries of categorization set for the developing of VPs.
The first category involved the unrestricted VP models produced at the beginning or middle of the study; the participants had developed proofs without words to different mathematical statements. The second category in the visual models were developed more than once and different to each other for one given mathematical statement. The examples from the third category represent VPs that show mathematical statement of a visual generalization. According to the literature, examples from the third category are seen infrequently, and because
of this, these examples could be accepted as more authentic (original). The examples from the second and third categories were developed from the middle to the end of the study.
Data Analysis
Literature indicates no accepted framework or coding system for analysis of VPs. A study of Borwein and Jörgenson (2001) is the only study, which roughly mentions an investigation system/criteria that could be useful while examining VPs. Here, the researchers discuss there are three requirements to accept a visual proof: 1-reliability, 2-consistency, and 3-repeatability (Borwein & Jörgenson, 2001).
“Reliability [is] the underlying means of arriving at the proof are reliable and that the results is unvarying with each inspection. Consistency [is] the means and end of the proof are consistent with other known facts, beliefs, and proof. Repeatability [is] the proof may be confirmed by or demonstrated to others (p.899)”.
On the other hand, Hanna and Sidoli (2007) claim that these criteria cannot be completely applicable either to visual proof or to proof in general. It is particularly due to the „reliability‟ criteria, which is not expressed clear enough to show or decide whether a visual proof is reliable or not (Hanna & Sidoli, 2007; Hanna, 2000). Therefore, since there is no valid framework to analyze VPs and the only existing study (Borwein & Jörgenson, 2001) is criticized in some respects, the authors have decided to produce their own coding system. The researchers examined the proofs together at the beginning. After that, each researcher examined the participants‟ examples based on two criteria: “reasoning involved” and “appropriate visual models”. Based on the findings from these examination, it was decided to use two codes to evaluate VPs: “correction of the model” and “visual structure”. By using these codes, three authors analyzed each VPs individually, and then compared the assigned codes.
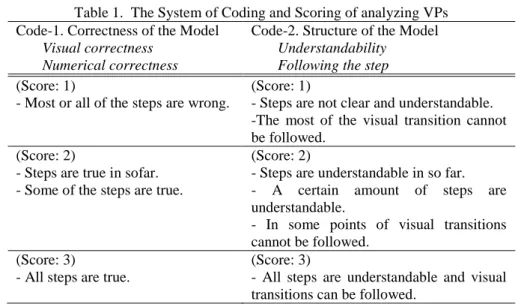
Table 1. The System of Coding and Scoring of analyzing VPs Code-1. Correctness of the Model
Visual correctness Numerical correctness
Code-2. Structure of the Model
Understandability Following the step
(Score: 1)
- Most or all of the steps are wrong.
(Score: 1)
- Steps are not clear and understandable. -The most of the visual transition cannot be followed.
(Score: 2)
- Steps are true in sofar. - Some of the steps are true.
(Score: 2)
- Steps are understandable in so far. - A certain amount of steps are understandable.
- In some points of visual transitions cannot be followed.
(Score: 3)
- All steps are true.
(Score: 3)
- All steps are understandable and visual transitions can be followed.
During the analysis, each developed VP was labeled as “insufficient”, “acceptable” or “sufficient”. The score and labels given under two codes of the each VPs are given in Table 2. The researchers met to compare codes and analysis. The examination was completed when the researchers agreed on the analysis conducted on the VPs based on the agreed criteria. During this process, two of the VPs were eliminated from the study because they were incomplete. One of the examples selected for the study had some problems for conducting an appropriate visual model, however, it was decided that this example should remain in the study because it shows the students‟ thought processes and approach to visual modeling.
Table 2. The codes and labels used in VPs‟ analysis
Score Score Score Score Score Score Score
Code-1 1 1 2 2 2 3 3
Code-2 1 2 1 2 3 2 3
Results
It should be underlined that most of the VPs developed by the participants are considered by the researchers to be successful (sufficient & acceptable). After researchers‟ individual examinations, the intercoder reliability was calculated as 80%, obtained from the codes, excluding the two eliminated and one mismodeled VPs. In this chapter, the VPs from the three categories previously mentioned are described and the results from the participants‟ written expressions are presented. The VPs developed by the participants are presented in progressive 2-4 steps so that the participants‟ reasoning processes can be observed in detail.
First Category
This category involves the very initial proofs of the students, obtained right after they started to produce VPs. In the first category, there are six different VPs constructed as shown below:
(VP-1). Mathematical statement: a² + b² = c² (Pythagorean Theorem)
Figure 1. [C1.VP-1: Category 1, Visual Proof 1]
The first proof was developed by Erdem. He constructed a visual model of Pythagorean Theorem. He started to construct three squares for each sides of the right triangle. Then he showed the proof of the theorem by dividing each square on the sides of the right triangle appropriately to place them into the big square lying on the c side. After placing two squares with side a (green square) and side b (yellow square) into the other square with side c, there occurred an area that intersected those two squares. Erdem accepted that this area was the same with the area which was located in the square with side c, and also located outside of the other two squares with side a and b; so, he revealed that the sum of the area of squares with sides a and b was equal to the area of the square with side c. The process is shown in Figure-2.
Figure 2. C1.VP-1 Equality of area
It is possible to see the correctness of the visual model by using a Dynamic Mathematics Software like GeoGebra and/or by using squared paper for the squares constructed by different a, b, c values (the areas numbered with 1, 2, 3, and 4 in Figure-2) (see Appendix-1). In drawings that use squared or scaled papers, where sides of right triangles are taken as 3-4-5 or 6-8-10, the constructed model would be as seen in Figure-1. However, when sides of the right triangle are taken as 7-24-25, areas numbered 1 and 2 are produced as same but areas numbered 3 and 4 become different than shown in the Figure-2 (see Appendix-1). This is not a problem for the correctness of the visual proof, but considered as a limitation for the visual model. On the other
hand, in Erdem‟s model, squares and intersection areas are colored so as to help to follow and improve the visual model. From this point of view, this VP-1 is given three points from Code-1, and 2 points from Code-2; and it is labeled as acceptable.
(VP-2). Mathematical statement: a(x+a)(x+b)=x 2 +(a+b)x+ab
Figure 3. [C1.VP-2]
In this proof, a basic form depending on the dividing-shape technique, Mustafa set a rectangle with the sides of x+a, and x+b. Later, he constructed quadrilaterals with sides x, a, and b inside of the main shape. In the next step, he divided these quadrilaterals into three pieces. The first piece was with sides x and a+b, the second piece‟s sides were a and b, and the last piece was a square with side x. He, then, showed how it could be obtained from the left side of the equation by constructing three terms on the right side. The correctness of the visual model (in figure base) can be easily seen in the new models constructed by different x, a, and b values. Equality of the areas represented in each sides can be observed using GeoGebra or other types of software for numerical correctness. Mustafa colored quadrilaterals, and placed them one under another to represent left and right sides of the equality. Because of this, there is no difficulty in understanding the visual process conducted at each step, and transition from one step to another. The VP-2 is given three points from each Code, and labeled as sufficient.
(VP-3). Mathematical statement: (n+1)!-1= n.n!+(n-1).(n-1)!+ … + 3.3!+2.2!+1.1!
Figure 4. [C1.VP-3]
In this next proof from Burak and Erdem, they made use of the first three terms to model equality consisting of factorization. The participants used different colors (from the left side) for the first (for n=1) term (1+1)!=1.1!+1, the second (for n=2) term (2+1)!=1.1!+2.2!+1, and the third (for n=3) term (3+1)!=1.1!+2.2!+3.3!+1; and then, they constructed the whole model for n=3 where each of three blocks consisted of six circles to model 3.3!. The (n+1)! placed on the left side of the mathematical statement can be rewritten as (n+1).n! By using this equality, Burak and Erdem showed constructed quadrilateral‟s sides as n! and n+1. In this way, the area of the outer quadrilateral enclosing all circles shows the left side of the equality, and the number of grouped circles inside the quadrilateral represents each term of the right side (i.e. 1.1!, 2.2! and 3.3!) of the equality. In the last step of the model, by reducing one unit from the part of the rectangular shape, they finished the visual proof by showing how they achieved the left side of the given equation ((n+1)!-1). In the visual modeling process, Burak and Erdem associate the number of the circles with the area of the quadrilateral while representing terms with the small circles. The used model shows that the equality is valid for n=1, n=2 and n=3 both in numerically and visually. However, in the process of constructing the model, there are some restrictions regarding the visual perspectives. Among these restrictions, the first one is in step n=2 (the second step from left in Figure-4). The base and side length of all quadrilaterals in the model are represented by n! and n+1. However, this representation cannot be applied to quadrilateral with n=2. Although the base is 2!, the side will be 3; yet, the placement is vice versa. Another limitation of the model appears when n=4. This is related to n=2 situation. When the model in Figure-4 is expanded for n=4, 24 small circles in four rectangles
should be placed around the shape, which is obtained by n=3 in an appropriate way. When this placement is conducted to produce a visual pattern, the base becomes n!, and the side becomes n+1. Yet, if we start to construct primarily considering base and side while producing the model, then a visual pattern cannot be composed. This situation does not constitute a problem for the correctness of the model, however it causes a small limitation for the visuality (see Appendix-2). This limitation can be removed easily by relocating the small circles in n=2 step. In Figure-5, the researchers show how the circles can be arranged in an appropriate way, and how model for n=4 step is constructed. In this new drawing, both sides can be showed by using n! and n+1, and the visual arrangement is also more appropriate. By using these findings, it is possible to say that there is no problem in terms of the correctness of the model for VP-3 from an arrangement perspective, but there are some limitations in terms of understandability and traceability of the steps. So, VP-3 is given three points from Code-1 and two points from Code-2, and considered as acceptable.
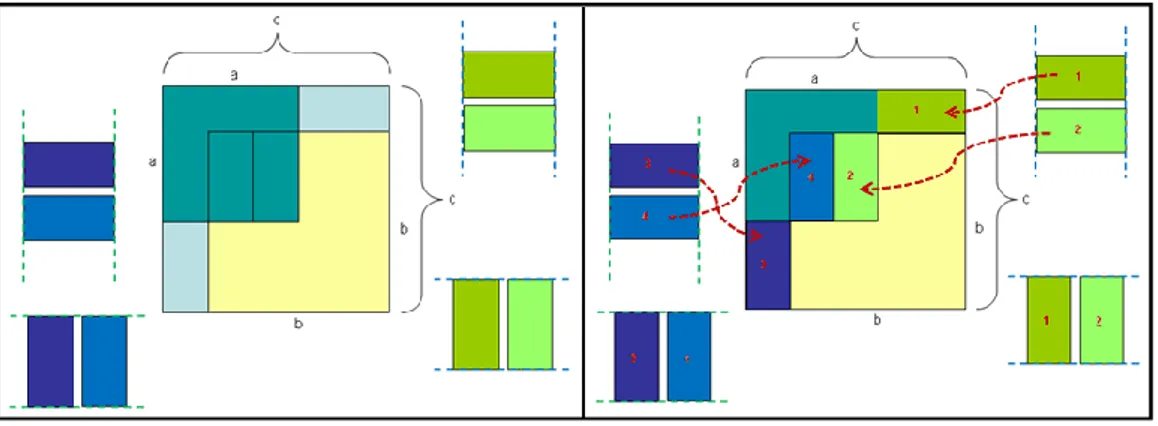
Figure 5. [C1.VP-3] The Correct way of showing the Model (VP-4). Mathematical statement: x2-(a+b)x+ab=(x-a).(x-b)
Figure 6. [C1.VP-4]
In this proof modeled by Mustafa, both shapes are used properly. Mustafa, instead of dividing a whole quadrilateral in suitable shapes like he had done before, he chose to start by already divided shapes. In the beginning, the first and third terms [(x2+ab) → (x2: red+orange+light green)+(ab: dark green)] in the equation are shown with the first shape, and the second term [(a+b)x: (red+blue)] is shown by the second shape. Mustafa, then, disassembled the first shape and re-assembled it by appropriately translocating the pieces. So, he produced a shape congruent to the first one (middle part in Figure-6) and he used this for the next step. After modeling the left part of the equation using these two (first and second) shapes, the subtraction is modeled by removing some pieces from the figures and then the visualization is completed by reordering the figures. Consequently, it is proven that the remaining pieces represent the right side of the equation. It can be seen that Mustafa‟s reasoning in VP-2 continues in VP-4 with slight changes. In VP-2, Mustafa divides the model in appropriate shapes and reassembles it. In VP-4, he continues to apply this method in a different way to construct the congruent shape. His way of coloring the visual model makes it easy to understand disassembly and arrangement. VP-5 is given three points from both Codes, and labeled as sufficient.
(VP-5). Mathematical statement: (x+y)2 = (x-y)2+4xy
The fifth proof belongs to Mustafa again. For visualization of the equation (x+y)2=(x-y)2+4xy, he preferred to use the same technique which he applied in VP-2, by dividing the main shape into appropriate pieces and then combining them to get the expected result. In the beginning, he started with one square. Later, he constructed appropriate fragmentation to the square with x+y side in two steps, and in second step, he divided a side of the square into 3 segments as y, y and x-y.
Figure 7. [C1.VP-5]
Immediately after, he drew the appropriate quadrilateral on these sides and used algebraic and colorful properties to show their areas. In the last step, the right side of the equality is modelled by dividing the shape into two parts. Figure-7 shows the four steps Mustafa modelled to have the right side of the equality by starting the left part of the equality, appropriately. This proof is given three points in both Codes, and labeled as sufficient.
(VP-6). Mathematical statement: (a+b)2-c2 = (a+b+c).(a+b-c)
Figure 8. [C1.VP-6]
Mustafa constructed the final proof of the first category. He continues to use the same reasoning structure for VP-6 as he used for VP2, 4 and 5 models. In this proof, Mustafa picked an equation that helps to construct the difference of the squares, with a minor distinction where the first term consisted of two terms and the other involves one term, and then he built his VP. Mustafa started to developed his VP by constructing a square with sides a+b, then he redesigned the square with a side (a+b-c)+c and the other side a+b. After that, in the third step, he eliminated the square with sides c which is placed on the right side of the constructed large square. He divided the figure into appropriate blocks and then reconstructed them to get visualization of the right side of the equation. VP-6 is given three points, and labeled as sufficient.
Second Category
In the second category, it is shown how a visual proof can be constructed in different ways for one mathematical statement. For this category 1² + 2² + 3² + … + n² = 1/6.n.(n+1).(2n+1) was selected. For the visualization of this equality, participants used the same reasoning patterns to develop three VPs.
(VP-7). Mathematical statement: 12+22+ ... +n2=1/6.(2n2+n).(n+1)
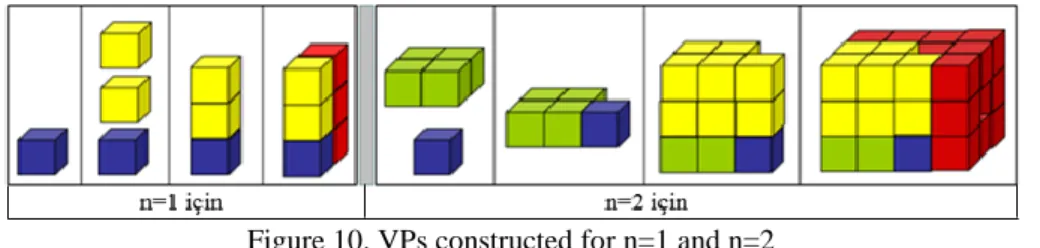
In the visual proof produced by Burak and Erdem, they started to model squares of 1, 2 and 3 by using cubes. The dark blue cube represents square of 1, the green cubes represent square of 2 and the grey ones represent square of 3. In each figure, there are as many cubes as the squares of given numbers. Then, three figures are combined together and put on top of each other to make a three dimensional half piece (Figure-9, step-3). The corresponding red blocks (42 cubes) complete that half piece into a whole, and one-sixth of the whole figure becomes equal to the left part of the equation. So, the layer comprised of 14 cubes (combination of dark blue, green and grey cubes) constructed in the second step constitutes one-sixth of the whole shape. This visual model is true and valid for n=3. The right side of the mathematical statement corresponds to the width (n+1=4), length (2n+1=7) and height (n=3) of the three dimensional shape. Hence, it can clearly be seen that the one-sixth of the volume corresponds to the left side of the equality. Burak and Erdem did not write length and height depending on n in their visual model. On the other hand, VP-3 was also constructed by Burak and Erdem, and they had expressed the sides depending on n in that proof. This situation makes it a little difficult to comprehend VP-7. In this stage, that is n=3, VP-7 is given as 3 points from Code-1, and 3 points from Code-2, and labeled as sufficient. However, when the same model is tried with n=1, n=2 and n=4, it is seen that it is not possible to have the same model all the time (Appendix-3). The logic of the model can be applied for n=1 and n=3, and for both these values the correctness is obvious. Yet, models constructed for n=2, n=4 and even for n=5 do not verify the mathematical statement. Figure-10 shows the VPs constructed for n=1 and n=2. As seen on the left side, the one-sixth of the fourth step of the model constructed for n=1 (constituted of one dark blue, two yellow and three red cubes) gives the very first step, which is the dark blue cube. However, on the right side, the one-sixth of the model constructed for n=2 (one dark blue, four green, 10 yellow and 21 red cubes) in the fourth step does not provide the correct figure (one dark blue and four green) in the second step.
Figure 10. VPs constructed for n=1 and n=2
Therefore, it can be concluded that the model produced by Burak and Erdem is applicable for only n=1 and n=3. From this point of view, VP-7 is given two points from both Code-1 and Code-2, considered as acceptable. (VP-8). Mathematical statement: 12+22+ ... +n2=1/6.(2n2+n).(n+1)
Figure 11. [C2.VP-8]
In the other visual proof produced by Burak and Erdem, a rectangle is selected with sides of appropriate length. They continue with this figure in a more simple presentation of the proof, 12+22+32+42 shown by colorful squares placed on the side 2n+1, which is completed with 25 light blue squares into a rectangle. So that the visual proof the addition of square of the sequential numbers started from 1 is modeled by showing the one over sixth area of the rectangle with n=5. There can also be a VP constructed where n is picked for 1, 2, 3 or 4 in the equation with the same reasoning pattern, but with different shapes. The participants picked n=5 because it is the most convenient, smallest number for representing the visual proof. The proof is presented in a very simple form with appropriate coloring, which VP-8 is sufficient by 3 points from each code. However, like in VP-7 when it is tried to confirm numerical and visual correctness, it comes with some limitations. Figure-11 shows a model for n=5 (12+22+32+42+52), where the first four terms are given with colored blocks (the sides are 2, 3 and 4 in order) constructing four different squares, and the fifth term is represented by light blue blocks surrounding the other three squares from top and left side. The sides of the rectangle constructed with the first five terms are
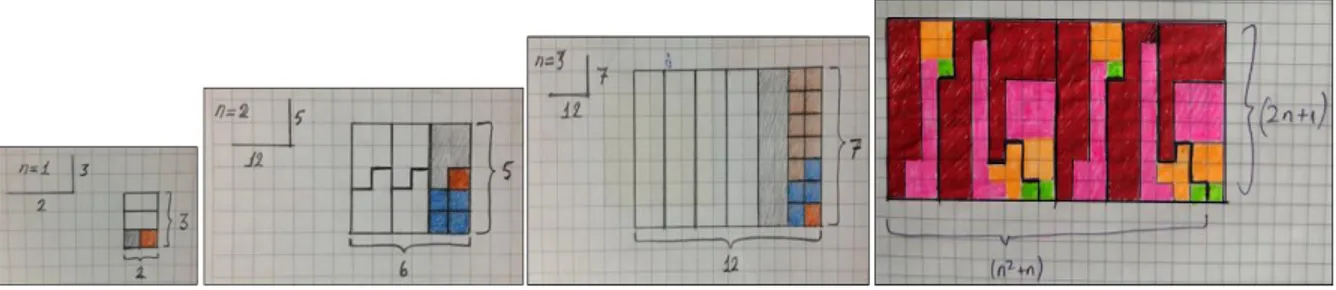
n=5 and 2n+1=11. By adding five more rectangles in the same form to the left side of the original rectangle, we can have the big rectangle in the left side of the Figure-11. The one-sixth area of this rectangle represents the area of the rectangle (55 small squares), which represents the sum of the first five terms. There are two important criteria to construct this model. The first one is the length of the sides (n2+n and 2n+1), and the second is surrounding the squares that may not be viable depending on the number of blocks. On the other hand, it is possible to construct a visual model by applying the first criteria only. In this case, the appearance of VPs is quite different than the VP-8 in Figure-11. This can be seen in Figure-12 for n=1, 2, 3, and 4 in the models produced by the researchers.
Figure 12. The VPs constructed for n=1, 2, 3 and 4 This VP-8 is given two points from each two Codes and labeled as acceptable. (VP-9). Mathematical statement: 12+22+ ... +n2=1/6.(2n2+n).(n+1)
Figure 13. [C2.VP-9]
VP-9, produced by Burak, is a different design of the previous proof (VP-8). Approach of transition from VP-8 to VP-9 is different from transition of VP-7 to VP-8. The first transition reveals how to transit from three dimensional model to two dimensional model. The second transition includes how to construct two different versions from a plenary model. In VP-9, Burak consists of three main pieces, each consisting of two equal sub pieces which are formed with 14 (yellow+ green+red) small squares. It is shown how these figures represent addition of the sequential numbers‟ squares by using the colorful squares in the first 14 blocks part. These colorful pieces represent addition of the first three terms‟ squares. In the whole shape there are six of the colorful pieces placed, so that the area of the large rectangle shown by the six smaller parts represents the addition of the first three terms‟ square, and then by this figure the proof became obvious. In Figure-13, although it is not shown apparently, sides of the outer big rectangle are n+1 (the short one) and 2n2+n (the long one). In Figure-11, it is shown that the short side is 2n+1 and the long side is n2+n for VP-8. In C2 (Category 2), students use different sides in the three models, which shows that they can use different algebraic forms of the right side of the equality (1/6.(2n2+n).(n+1)= 1/6.n.(n+1).(2n+1)=1/6.(n2+n).(2n+1)).
Figure 14. The constructed version of VP-9 for n=4
It can be seen that the model in VP-9 for n=3 (and also the other n values, see Appendix-4 to n=1 and n=2) is valid for both visual and numerical correctness, and all steps are traceable. The researchers show that it is possible to produce a VP for n=4 depending on the logic that is used to produce VP-9 in Figure-14. From this point of view, VP-9 is given three points from Code-1 and Code-2, labeled as sufficient.
Third Category
In the first proof of the third category (a+b)2, (a+b)3 and (a+b)4 are modeled with three figures. After that, in the second proof, some component parts of the visual proofs are constructed to the term of (a+b+c+… +t+k)3 which
is the generalized version of (a+b)3, (a+b+c)3, (a+b+c+d)3 and (a+b+c+d+e)3 kinds of terms. While investigating the VPs in this category, the accentuated point is whether the reasoning of the visual models are constructed in a connected way or not. That is, it is examined that the approach and techniques used in a one VP from a sequence (for example the VPs constructed for (a+b)2, (a+b)3 ve (a+b)4 can be taken as a sequence) can be continued to use in the second and third and the others in correct and understandable way. By using this point of view, VPs in VP-10 are considered and evaluated as a whole. In this category, while investigating VP-10 and VP-11, each visual model should be correct and understandable as a whole in a visual sequence. Also, the conducted reasoning while constructing the visual structure should be considered whether it is applied correctly to each model in the sequence.
(VP-10). Mathematical statements: (a+b)2, (a+b)3 ve (a+b)4
Figure 15. [C3.VP-10]
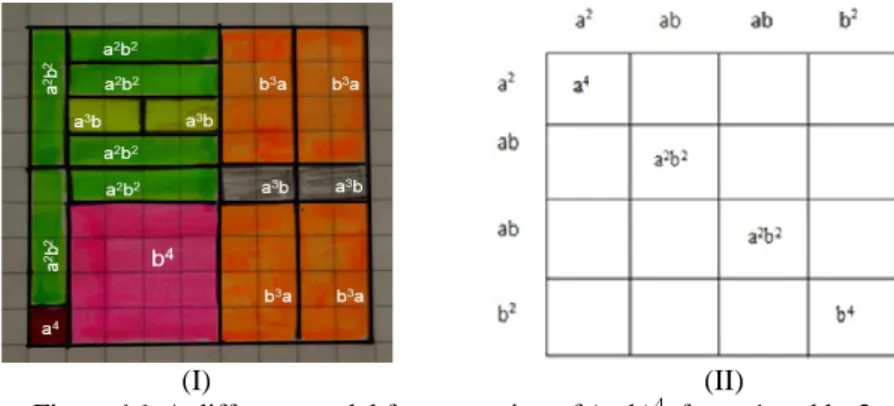
The generalization idea was reemphasized with three models which involve the addition of two terms with some powers constructed by Burak and Erdem together. The first shape ((a+b)2=a2+2ab+b2) is constructed easily because it is a model that can be found in textbooks and mathematics curriculum. The participants produced the second shape that shows (a+b)3 withthenecessary reasoning pattern after the first step. In the second shape, after deciding the sides of the large rectangle (the whole picture) as a+b and a2+2ab+b2, the whole, when (a+b)3 is extracted, is placed into the rectangle with colored squares. In Figure-15, while constructing the second shape a=1 and b=3 are taken. Burak and Erdem constructed a small square for a and three squares for b, and they modelled all terms in the expansion of (a+b)3 with these small squares. They implanted the models of the whole terms in the expansion into a rectangle with the sides a+b (4 small squares) and a2+2ab+b2 (16 small squares); and they confirmed the mathematical statement by helping the formation of the area for the big rectangle. In the third shape which is far more complex, by further advancing their way of thinking, the term (a+b)4 is modeled in very different structure.
Although this shape seems successful at first glance, there are some problems with it. Firstly, it is model that is difficult to understand and the truthfulness is valid for only a few numbers. The participants constructed this model for a=2 and b=3, and for these numbers the model is correct, but for different numbers the shape is found to be not true. If the area of the square which is placed on the bottom left is represented by a4 and also a2 for the dark blue one, then after redesigning the rest of the parts, it can be discernible that the side of the rectangle placed in the top right corner (orange) with area a2b2, should not be a.b/2. For the area of the whole shape, the multiplication of the base, which is (a+b)2,and the right side with (a2+2b2+a.b/2) is not equal to the participant‟s answer (a+b)2.(a+b)2.. The participants used the numbers a=2 and b=3 to produce the visual model and make the model convenient for the chosen numbers. The important point in this model is that Burak and Erdem did not use a scaled drawing while constructing their model. Yet, same students constructed VPs by using small squares in Figure-11, 13 and even in the second step of Figure-15. If they applied this approach to the expansion of (a+b)4 it would be possible to draw the visual model in a more correct shape. It is possible to construct a decent and understandable model when some trials are conducted by using different a and b couples with scaled or squared papers. We have demonstrated for a=1 and b=2 on squared paper how VP can be constructed with depending on Burak and Erdem‟s reasoning style on Figure-16.I. In the Figure-16.I it can easily be seen the terms of the expansion with the values of a=1 and b=2. It is also possible to see the area, (1+2)4 , of the big
square constructed by nine small squares as a side is equal the addition of the all small squares (that is the right side of the equality) placed. While constructing the visual proof without using scaled or squared paper, it is possible to construct a simple model as in Figure-16.II, like Burak and Erdem‟s model, by showing only the area. The model in Figure-16.II has a simple and easily understandable structure, where the corresponded mathematical statement is given correctly. However, based on the higher values of a and b, model which involved more visual details in the Figure-16.I is clearly more useful.
(I) (II)
Figure 16. A different model for expansion of (a+b)4 for a=1 and b=2
In this proof, the first and the second steps are true. However, the third step ((a+b)4) is true only for a couple of numbers, which is not therefore generalizable. When VP-10 is looked as a whole, it can be seen that three VPs inside of it are constructed with similar reasoning. This reasoning depends on the equality of the whole area, the area of division of a regular quadrilateral in an appropriate way, and the sum of the consisted areas. In this sense we can say that VP-10 involves three VPs in a coherent and consisted structure. In the light of individual and holistic evaluation of VP-10, it is given two points from Code-1 and Code-2 and it is labeled as acceptable. (VP-11.a). Mathematical statements: a3, (a+b)3, (a+b+c)3
Figure 17. [C3.VP-11.a]
(VP-11.b). Mathematical statements: (a+b+c+d)3, (a+b+c+d+e)3 ve (a+b+c+… +t+k)3
Figure 18. [C3.VP-11.b]
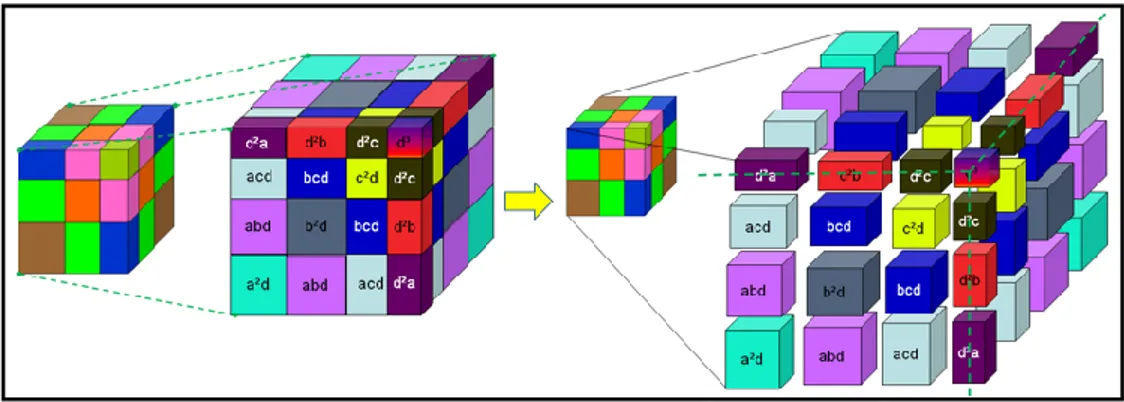
This model produced by Burak, is an elegant example which showed how some sequential statements can be generalizable by VPs. In this proof, in which three dimensional modeling is produced, it is revealed how the
visual model is constructed and how it is embedded successively. In the modeling‟s process, the reasoning started with simple presentations (a3 and (a+b)3), then it progressively reached the top level on the extraction of the third power of the four and five terms‟ addition so that in this level, by using the colorful representations, it appeared to be a good model for proof. Since the structure was becoming complicated, Burak produced his own way to increase its understandability. In each step he used the shape produced in the previous one, and he showed this by adding to the end of the algebraic statement e.g. (a+b+c)3 = ... +(a+b)3 or (a+b+c+d+e)3 = … + (a+b+c+d)3. To comprehend this stage, it is helpful to separate and show each piece in the model, produced by Burak, using MS PowerPoint. Figure-19 and Figure-20 show how Burak constructed the model and how he did the transitions.
Figure 19. The transition from (a+b+c)3 to (a+b+c+d)3
Figure-19 shows the transition from (a+b+c)3 to (a+b+c+d)3, and Figure-20 shows the transition from (a+b+c+d)3 to (a+b+c+d+e)3. In Burak‟s models, lots of colors are used and this makes difficult to understand the model at first glance. However, when the open version of the models is examined in detail, it is seen that coloring is in fact helpful to understand the transition among the steps.
Figure 20. Transition from (a+b+c+d)3 to (a+b+c+d+e)3
He explained his thought process by giving further models until the addition of the five terms, and then he presented a model with layers for the addition of the k-many terms. In the layer model, it is revealed how the addition of the k-many terms on one corner can be obtained by using layers produced by reused models, constructed at the beginning of the second step. Besides, in this visual proof it is obviously presented that the next step is constructed based on the previous one, and the reasoning process could be observed as visual chaining. Burak predicted the visualization for k-terms would be very complicated, so he chose to show the expansion on one corner and he managed to present his idea in a very simple way. The approach in the VP-11 involves the way used for unscaled presentation in the third step of VP-10. On the same unit cube, there are some different terms coming from expansion of the 3, 4, and 5 terms cubic summation. In reality, when a drawing is performed with different numerical values given to a, b, c, d, and e, it is not possible to obtain identical unit cubes. However, it is harder to construct a visual proof with such choice. Because of this, accepting this kind of approach in VP-11 (on the contrary to expansion of (a+b)4 in VP-10) can be regarded as more useful. The six steps (three steps in Figure-17 and three steps in Figure-18) in Figure-11 are investigated both individually and as a whole, which indicate no problems in transition for both correctness and visual structure. At the same time, it is obviously seen that these six steps are constructed around the same reasoning perspective. From this point of view, VP-11 is given three points from Code-1 and also Code-2, and labelled as sufficient. The Table-3 below is presented a summary of categories for each participants produced during the study.
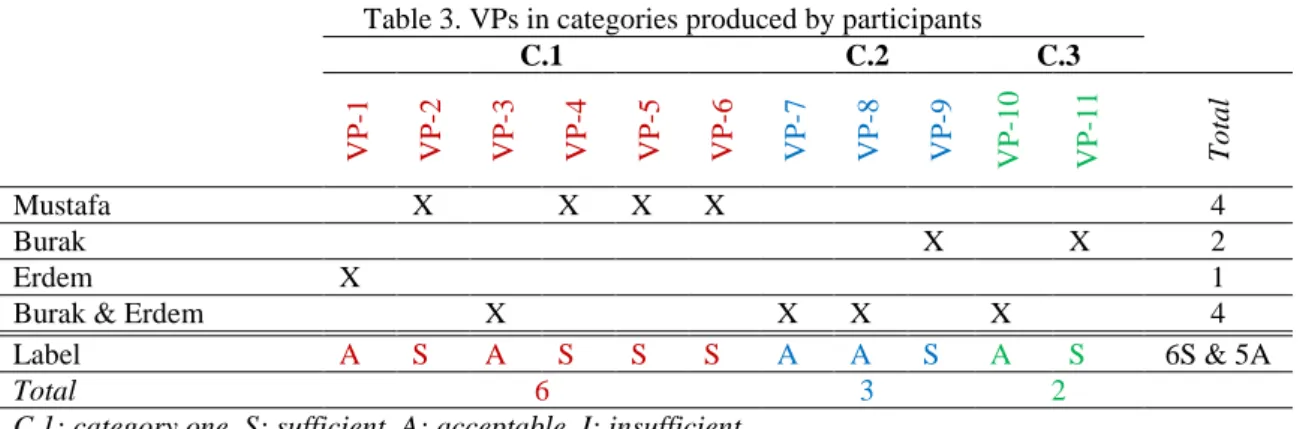
Table 3. VPs in categories produced by participants C.1 C.2 C.3 VP -1 VP -2 VP -3 VP -4 VP -5 VP -6 VP -7 VP -8 VP -9 VP -10 VP -11 To ta l Mustafa X X X X 4 Burak X X 2 Erdem X 1
Burak & Erdem X X X X 4
Label A S A S S S A A S A S 6S & 5A
Total 6 3 2
C.1: category one, S: sufficient, A: acceptable, I: insufficient
Written Discourse
The aim of the written survey given at the end of the exercise was to identify the participants‟ thoughts on their experience. When the written answers were investigated, all three participants preferred to give short answers, therefore the answers given are presented here in full.
The first question was “In your opinion, could VPs be helpful for learning mathematics?” The answers given for this question were as follows;
Burak: Yes, to me it is absolutely true, because the identities that can be explained by complicated mathematical terms, computations and formulas are reduced to a visual and simple version.
Mustafa: Yes, it is. When investigating the proofs without words or when proving the idea in your mind by visual proof, it helps to inculcate the formula, equation etc. which you are trying to prove at the same time. In geometry, it expands your horizon so that we can look at the shapes and questions in different perspectives.
Erdem: The aim of the visual proofs is to use them when the proving is difficult to explain using mathematical operations. It is useful in this perspective.
All three participants agreed that while learning mathematics VPs are helpful. Burak found them helpful in the visualization and simplification of mathematical terms, computations and formulas. Mustafa pointed out the contribution of VPs on permanent learning, and Erdem underlined that the proofs can be more easily explained through visualization.
The other question was; “What did you feel when you were dealing with the visual proofs?”, for which the following answers were given;
Burak: We realized that we could visualize the mathematics and that was enjoyable.
Mustafa: I have to say that at the beginning I did not understand much. After that, I started working on basic proofs and began to target more difficult ones. During this time we thought about different versions of the proved formula. However, when we found unproven formula it was difficult to find a figure to interpret it, but there was great delight once we found it.
Erdem: When dealing with the visual proofs we were constantly engaged with both mathematics and geometry. Because of this, our visualization and problem solving skills improved.
When asked what they feel when dealing with the visual proofs, all the participants were positive. Burak explained his enjoyment while dealing with visualization of mathematics; on the other hand, Mustafa implied becoming clearer when he had gained more experience with visual proofs, so that he had great pleasure when he achieved the things which seemed very difficult at the beginning. However, Erdem indirectly expressed his positive feelings as he explained the acquisitions (visualization and problem solving).
In the third question “What is your reasoning when constructing the visual proofs?” the answers given were; Burak: We used our geometric ability. We used the reasoning pattern depending on the power of the identities in which geometric figures can be used to make it more correct and visual so that it can be expressed.
Mustafa: At the beginning I was searching for a statement that has not been proven by visual means. After that I was thinking which geometric structure can be combined and interpreted. After that discovery, I started to construct it.
Erdem: When constructing the visual proofs, we tried to produce geometrical shapes for coefficients and powers.
When the participants were asked what reasoning processes were used when constructing their visual proofs, two main points were expressed. The first was the coefficients and powers of the mathematical structures, and the second was constructing an appropriate geometrical shape. The participants took into account the interrelation of these two points.
In the fourth question, they were asked “For what concept or topic the visual proofs could be produced?” with these answers;
Burak: It can be used for a whole expression that can be visualized in solid form in mathematics, and it can be truly expressed by using an object geometrically. The visual proofs can be used in mathematics when you can visualize something with your eyes in solid form and geometrically by using a solid when you express the properties truly, the visual proofs can be used.
Mustafa: It can be produced more in exponential statements. For example, for (a+b)2 =a2+2ab+b2 the proof is easy but for (a+b)1=a+b the consecutive powers are difficult. For a mathematical statement like (a+b)6= a6+… +b6, it can be produced as a generalization type of visual proof. For instance, it can be generalized like (a+b)n =an+an-1b+… +abn-1+bn and expressed as a geometric shape.
Erdem: Visual proofs can be used for all mathematical proofs.
According to the answers given by the participants, it is understood that they have an idea of the VPs broad area of usage. Burak and Erdem especially expressed that the VPs can be used for all mathematical properties that can be correlated with geometrical shapes, whereas Mustafa stated that they can be used for (a+b)2, (a+b)6 types of statements and for their generalizations.
In the final question, it was asked “Which is the one VP you produced that you liked best?” for which the answers are presented below;
Burak: I like the generalization that I produced like (a+b)3, (a+b+c)3, (a+b+c+d)3, (a+b+c+…+k)3, because It is absolutely practical and a sophisticated proof.
Mustafa: I found better that expressing a statement in different, original and elegant ways. For example, in the expression (a+b)2 =a2+b2+2ab there could be more than five proofs. And this improves the diversity of mathematics.
Erdem: Among the visual proofs that were produced by us, I preferred the more difficult ones, because I believe they improved our creativity.
After the VP experiences of the participants, when asked which one they like more amongst those produced, Burak stated the proofs in C3, Mustafa picked proofs from C2 and Erdem expressed that he liked the most difficult ones. Burak specifically picked C3-VP2 and gave the reason as it was very practical and sophisticated. On the other hand, Mustafa stated that he liked the proofs from Category C2 because these proofs can be expressed more than one way like the expression (a+b)2, which can be shown in five different ways according to him, this improves the diversity of the mathematics. However, Erdem put a different perspective on it and said that the criteria for appreciating a proof are the level of difficulty for him. In the sessions where the researchers were with the participants, it was observed that the difficult examples are mostly in Category C3. It could be concluded that because of this, Erdem, who is similar to Burak, also likes the proofs in Category C3, but the
reason that he liked the proofs in this category according to him, was that these proofs improved his creativity “more” than others.
Discussion
With regard to the VPs constructed by the students, it was seen that each of the three students constructed at least one VP on his own. In total, Mustafa participated in the construction of four VPs, five for Erdem, and six for Burak. All Mustafa‟s proofs were in Category one (C1), and all (VP-2, 4, 5, 6) were constructed by himself. Erdem constructed one VP on his own (C1.VP-1), and another four (C1.VP-3, C2.VP-7, 8, and C3.VP-10) in collaboration with Burak. Burak, on the other hand, constructed two VPs (C2.VP-9 and C3.VP-11) on his own, and other four with Erdem. By the end of the study, the students constructed six C1 VPs, three from C2, and two from C3, making a total of 11 VPs. However, in recognition that C3, VPs contained more than one modelling to show transition within, this number is in fact more than eleven. We believe that students‟ free reasoning and free activity conduct during the construction of the VPs improved their efficiency. Despite being undetermined at the beginning of the study, interestingly, the constructed proofs were self-categorized, and more than one visual proof was included under each category. All VPs produced by participants are considered acceptable and sufficient. For example, all proofs by Mustafa in C1.VP-2, 4, 5, 6, and all VPs by Burak himself (C2. VP-9 and C3. VP-11) are labelled as sufficient with top points from the each code category. Moreover, the VP-1 in C1 produced by Erdem himself is labelled as acceptable, with two points from one of the Codes and three points from the other one. Burak and Erdem‟s proofs are all labelled as acceptable. There are no insufficient labelled proofs, which is given one point from one of the codes and two points from the other one. This shows that all produced visual proofs are successful. Moreover, researchers expected students to construct some independent examples, whereas students constructed unique proofs under three categories, each of which required advanced levels of analytical and geometrical reasoning. It is possible to explain this as follows.
VPs under the first category included Pythagorean Theorem, second degree identities, and factorial equality. As seen, mathematical subjects included in the proofs are not based on a single subject and/or concept, yet vary. A closer look at the process of modelling proofs under this category shows that students benefitted from various techniques. We determined that three techniques used for C1.
The first technique was based on creating a shape and modifying it within itself. The initially constructed shape visualizes a statement on the basis of relevant parts in a connected manner [we can call this “basic modification
(step: change)”] (C1.VP-1). The second technique starts with taking a complete shape, and breaking it into
pieces and then bringing all pieces back together in a desired form [we can call this “further modification (steps:
break up-change-arrange-reunite)”] (C1.VP-2,4,5,6). The third technique includes going from parts to the
whole using inductive reasoning, where a formal unit is selected (e.g. point, circle, cube, sphere) and planar structure is constructed using this unit. Then a visual model is constructed with the help of the relation between this unit and the structure (border-area relation) [we can call this “inductive basic construction”] (C1.VP-3). The goal of naming these techniques is merely for the purposes of formalization, summarizing the technique. Coverage of the given names is limited to the VP examples given in this study, and does not have any purpose for generalization or conceptualization since further studies should be conducted for such an effort. Considering the diversity of subject/concept for C1 as well as diversity in modelling technique, it is possible to say that examples under this category are successful (4 sufficient and 2 acceptable) proofs that require advanced geometrical reasoning.
All VPs under the second category (C2) are products of an approach on how one statement may be proved visually in different manners. The first proof under this category is similar to the VP structure in Nelsen‟s book and the other examples found in the literature. The first VP (C2.VP-7) was constructed by forming a shape for certain numbers (first three or four terms), creating a whole 3D shape by using the first shape, and then achieving the desired statement through volume of the latter shape (one sixth). The second proof in the category keeps the reasoning used in the first one, and aims at visual modelling within a simpler planar shape. Following the construction of the first VP, some students continued to think about the given mathematical statement. They discussed alternative modelling ways by keeping their approach, and realized that they could construct a simpler model. Burak played a more active role in this process. In our opinion, their preference for simplification and a simpler visualization is an indicator of their advancement in mathematical thinking. Despite being 9th graders, their cognitive capacities allowed for flexible transitions. In the third VP, the situation became more advanced in its simplest form. C2.VP-9 is a proof constructed by Burak. Burak‟s continuance on a mathematical statement and on sharing information with Erdem and other group members in the process led to a deeper visual perspective, and exemplified how it is possible to achieve a better visual model (in terms of simplicity) by using