FOREIGN EXCHANGE DENOMINATED BORROWINGS AND
CORPORATE PROFITS: EVIDENCE FROM TURKEY
Deniz PARLAK, Ph.d
Doğuş University, Department of Management, Assist. Prof. Zeamet Sok, K204, 34718, Acıbadem, Kadıköy, İstanbul, Turkey
E-Mail: [email protected]
ABSTRACT
In modern finance literature, value maximization is accepted as the primary goal of corporations. To attain this goal, firms try to decrease their cost of capital as much as possible, since firm value is calculated by discounting expected cash flows at cost of capital.
Borrowing in foreign currencies is one of the tools used by firms to decrease their cost of capital. However, although firms are able to realize large spread gains in times of relative purchasing power disparity, foreign exchange risks are difficult to cover in periods of crisis where local currency depreciates. Thus, foreign exchange risks are considered one of the most important reasons of the financial fragility in times of crisis.
The purpose of this study was to investigate the magnitude of foreign exchange denominated financial borrowings of Turkish manufacturing companies and the impact of these borrowings on company profits and corporate risks. It was hypothesized that companies with low operating profits and low operating risks tend to borrow in foreign currency to decrease their cost of capital and increase their after tax return in times of purchasing power disparity. However, this creates an important source of financial fragility.
1. Introduction
The President of the Central Bank of Turkey stated in a conference announcement that “In many emerging markets, high dollarization is identified as an important factor that adds to the challenges related to international capital flows. On the other hand, dollarization is seen as a symptom of some underlying causes such as macroeconomic imbalances and inflation. Clearly, there is a long way ahead for both policy makers and academics in assessing the causes and consequences of dollarization” (International Conference on Dollarization, "Consequences and Policy Options," December 14-15, 2006). As stated in the conference announcement, macroeconomic imbalances may be an underlying cause of the high dollarization attitude. One of the main sources of macroeconomic imbalance is the deviation from relative purchasing power parity. Relative purchasing power parity is a well known economic theory which predicts that the change in the exchange rate is determined by price level changes in two countries. In the time period studied, the Turkish economy witnessed deviations from relative purchasing power parity in the form of local currency overvaluation with respect to foreign currencies. There exists numerous ways of opening position; one of them is borrowing in foreign exchange denominated debt instruments. Especially in countries where stock market capitalization rate is low, borrowing becomes an important instrument to finance both activities and capital investments.
The main objective of the present study is to investigate the reasons why companies take foreign exchange risks by borrowing in foreign exchange denominated debt instruments, to determine the magnitude of these risks and to analyze their impact on companies’ cost of capital which has direct effect on both firm value and net income which are among the most important figures summarizing a company’s survival potential. More specifically, the main purpose is to investigate the causes and the magnitude of the foreign exchange risks of manufacturing companies and the impact of these risks on companies’ net income.
The remainder of the article is organized as follows. Section 2 provides a general theoretical background. Hypotheses are presented in Section 3. Section 4 provides the definition of variables and Section 5 describes the data used in the study. The analysis and related results are discussed in Section 6. The final section summarizes the main findings of the study and concludes.
2. Theoretical Background
According to the modern finance literature, value maximization is accepted as the primary goal of corporations.(Copeland et al., 2005) Earnings are an important source for value maximization but they themselves do not represent value. Instead return on equity is the most important measure of value creation. Earnings are important because they boost the stockholder’s claim on the firm’s assets. As company books profits, those profits are retained on the balance sheet and boost the asset value without a corresponding increase in liabilities. So shareholder’s equity increases and this rate of increase is measured by return on equity.
In the literature firm value is calculated by discounting the future cash flows by using the cost of capital as a discount rate, hence decreasing the cost of capital is an important issue to maximize value. (Auerbach, 1979) Borrowing in foreign currencies is one of the tools used by firms to decrease their cost of capital. However, although firms are able to realize large spread gains in times of relative purchasing power disparity, foreign exchange risks are difficult to cover in periods of crisis where local currency depreciates. Thus, foreign exchange risks are considered one of the most important reasons of the financial fragility in times of crisis.
2.1. Foreign Exchange Risk and Relative Purchasing Power Parity
In economics, the fair value of a currency with respect to other currencies is explained by the theory of relative purchasing power. Relative purchasing power parity predicts the relationship between two countries’ relative inflation rates and the change in the exchange rates of their currencies. It suggests that the country with the higher rate of inflation will have a devaluing currency. Relative purchasing power parity requires only that the rate of growth in the exchange rate offset the differential between the rate of growth in home and foreign prices (Rogoff, 1996). The theory relates the inflation rate in each country to the change in the market exchange rate according to the following formula.
where St is the spot rate in the Foreign Currency/Domestic Currency and Pt is the price level in period t (foreign values are marked by an asterisk).
Still, many of the empirical studies show that markets converge to the relative purchasing power equilibrium with a time lag. In the short run, however, exchange rate movements are news-driven. Announcements about interest rate changes, changes in the perception of the growth path of economies and the like are all factors that drive exchange rates in the short run. Purchasing power parity, by comparison, describes the long run behavior of exchange rates. The economic forces behind parity eventually will equalize the purchasing power of currencies. This can take many years, however. (Lothian & Taylor 1996).
There are many sources of short run purchasing power disparities. Over the last years, international capital flows have been considered the principal source of purchasing power disparities. Investors shift their funds in anticipation of changes in exchange rates; however, the adjustment in relative prices necessary to induce the flows of real resources to match flows of financial capital takes place only with a considerable time lag, which is the main source of disparities (Aliber, 1976).
Although firms are able to realize large returns in times of disparity, foreign exchange risks are difficult to cover in periods of crisis when markets adjust themselves and approach to equilibrium. Thus, foreign exchange risks are considered one of the most important causes of financial fragility in times of crisis. Firms are exposed to foreign exchange risk if the results of their projects depend on future exchange rates and if the changes in the exchange rates cannot be anticipated fully. More specifically, a company is considered to have an foreign exchange risk if the amount of foreign exchange denominated liabilities it holds exceeds the amount of foreign exchange denominated assets.
2.2. Foreign Exchange Risk and Crises
In the literature, there are two competing views on the relationship between exchange rates and financial fragility: The first one, the moral hazard hypothesis, argues that investors are more willing to take risks when they are somehow protected against the distorting consequences of their risky behavior. In other words, investors
who do not have to bear the full consequences of their risky investments have a tendency to take on excessive risks, leading to financial fragility (Hausmann & Eichengreen 1999). The second view, the original sin hypothesis, emphasizes incompleteness in financial markets named original sin. This is a situation in which the domestic currency cannot be used to borrow abroad or to borrow long term, even domestically. It can be a source of financial fragility, limit the ability to implement an independent monetary policy (Hausmann & Eichengreen 1999), and cause greater vulnerability to sudden stops (Calvo et al., 2004). In the presence of this incompleteness, financial fragility is unavoidable because all domestic investments will have either a currency mismatch or a maturity mismatch.
In the literature, there are also empirical studies which investigate whether relying on foreign currency has an impact on financial crises or not. Generally these studies have been conducted on the banking sector data in the developing countries. In one of these studies, Kaminsky and Reinhart (1999) established that the connection between banking crises and exchange-rate crises is real. Calvo, Izquierdo and Mejia (2004) stated that liabilities in foreign currency may be a proindicator for sudden stops of capital inflow in developing countries and that dollarization may be an important triggering factor in self-occurring crises. Nicolo et al. (2003) found that dollarized banking sectors have a riskier profile and cause deposit volatility. Domaç and Peria (2003) stated that there is a positive relationship between the possibility of banking crises and the proportion of domestic banks’ foreign denominated liabilities to foreign denominated assets. Finally, Levy-Yeyati (2006) concluded that devaluation and financial dollarization increase proclivity to crisis, and that exchange rate volatility will affect financial stability negatively in the presence of sole financial dollarization.
In a study about Turkey, Kesriyeli, Özmen, and Yiğit (2005) found that firms generally rely on foreign currency and short-term debt instruments, which make them vulnerable to both exchange rate and interest rate risks through currency and maturity mismatches. Furthermore they rarely use derivative instruments to cover their open positions. Liabilities in foreign currency can make firms’ balance sheets and hence their net worth vulnerable to exchange rate depreciations. Previously, during the 2001 crisis, it was discovered that the main reasons for the fragility of the Turkish economy were the budget deficits of the public sector, the current account deficits, and the short foreign exchange positions of the banking sector (Onaran, 2006). Currently, the banking sector in Turkey has hedged its foreign exchange risks to a great extent. However, the private non-financial business sector is exposed to a significant degree of foreign exchange risk. The increase in investment in machinery and equipment is financed particularly through borrowing from foreign markets. Even domestic borrowing is made in foreign currencies to increase the profit margin, resulting in significant amounts of foreign exchange risk.
3. Hypotheses
The purpose of the present study is to investigate the reasons why companies take foreign exchange risks by borrowing in foreign exchange denominated debt instruments, to determine the magnitude of these risks and to analyze their impact on companies’ cost of capital which has direct effect on both firm value and net income which are among the most important figures summarizing a company’s survival potential.
As stated in the literature review section, companies with low operating profitability take some risks to decrease their cost of capital and consequently increase their reported net income figures. Given the expectations about relative purchasing power disparity, foreign exchange denominated financial debt is the most widely used instrument to lower cost of debt. From these premises emerge the first and the second hypotheses:
H1: The average operating profitability for companies borrowing in foreign exchange denominated debt instruments is lower than the average operating profitability for companies which borrow only in local currency denominated debt instruments.
H2: Foreign exchange denominated financial borrowings, decrease cost of capital in times of purchasing power disparity and increase in times of turbulence or crisis.
In periods of disparity when local currency is overvalued, companies realize substantial foreign exchange gains. However, foreign exchange risks are difficult to cover in times of crisis when markets adjust themselves, hence companies incur high losses. From these premises emerge the third and fourth hypotheses:
H3: The average after tax return for companies which borrow in foreign exchange denominated debt instruments is higher than the average operating profitability for companies which borrow only in local currency
denominated debt instruments for periods of relative purchasing parity disequilibrium.
H4: The average after tax return for companies which borrow in foreign exchange denominated debt instruments is lower than the average operating profitability for companies which borrow only in local currency denominated debt instruments for periods of turbulence or crisis.
4. Variables
To accomplish the purposes of this study, a set of firm specific and macroeconomic variables were employed. The list of the variables used in this study is presented in Table 1 below.
Table 1. Variables and Measurement
VARIABLE MEASUREMENT
Fore ign Exchange De nominate d De bt Ratio Fore ign Exchange De nominate d Financial De bt /Total Asse ts O pe rating Profitability Earnings be fore Inte re st and Taxe s / Ne t Sale s
Re turn on Equity Ne t Income afte r Taxe s / Share holde rs' Equity O pe rating Risk Standard de viation of O pe rating Profitability Total Risk Standard de viation of Re turn on Equity
C ost of Local C urre ncy De nominate d De bt Ave rage 6 months Gove rnme nt Bonds' Inte re st Rate
C ost of Fore ign C urre ncy De nominate d De bt Ave rage 6 months LIBO R Rate + De valuation of Local C urre ncy vs USD
Spre ad C ost of Local C urre ncy De nominate d De bt - C ost of Fore ign Exchange De nominate d De bt Spre ad gain / loss Fore ign Exchange De nominate d De bt * Spre ad
Re lative Spre ad Gain / Loss Spre ad Gain and Loss / Earnings Be fore Inte re st and Taxe s
As can be seen from Table 1, to measure foreign exchange risks, the amount of foreign exchange denominated debt was used. The relative magnitude of the mentioned risk was measured by taking the ratio of foreign exchange denominated debt to total assets. The data was calculated for each company and for each subperiod separately. Operating profitability was measured with operating profit margin ratio, defined as operating income (earnings before interests and taxes) divided by net sales. After tax return, on the other hand, was measured with return on equity, which is a measure of a corporation's profitability that reveals how much profit a company generates with the money shareholders have invested. Return on equity is calculated as the ratio return after taxes to total shareholder’s equity.
The operating risk of the company is defined as the volatility of operating profit and the metrics used in this study are a coefficient of variation for operating profit margin, defined as the standard deviation divided by the arithmetic mean for standardization. On the other hand, the total risk of the company is measured with volatility of return on equity. The metrics used in this study are the coefficient of variation of return on equity. Spread is defined as the difference between the costs of local currency denominated debt and that of foreign currency denominated borrowings. US Dollar is employed as foreign currency as in Turkish financial environment, the majority of foreign currency borrowings are denominated to US Dollar. Riskless six months government borrowing rate was used as proxy for the cost of local currency denominated debt whereas the cost of foreign currency debt was calculated by adding the devaluation of local currency rate to the average 6 months LIBOR rate.
Spread gain and loss was calculated by multiplying the spread with the amount of foreign exchange denominated borrowings. To measure relative gain and loss, the ratio of spread gain and loss to earnings before interest and taxes (EBIT) was used. Size measured with total sales volume was used as the control variable.
5. Data
The dataset of this study consisted of 145 manufacturing companies listed on the Istanbul Stock Exchange (ISE) as of the end of 2009. The manufacturing sector was selected on purpose for this study. Looking at individual economic units in Turkey, households are net foreign exchange creditors whereas the public sector’s foreign exchange short position is negligible. The banking sector, which adapted a severe restructuring process
after the 2001 economic crisis, does not have any risky short foreign exchange position either. Hence, the main risk is related to the non-financial business sector, which was a net foreign exchange debtor as of December 2009. Data for all firm specific variables were obtained for each company from the financial statements available on the website of the İstanbul Stock Exchange. Foreign exchange (FX) denominated borrowings figures were taken from the footnotes that accompanied the financial statements.
The data were collected from semi-annual financial statements and spanned the period from the first half of 2005 to the second half of 2009, resulting in a total of ten time periods. The data used to compute spread was obtained from different sources. The period end buying rate announced by the Central Bank of Turkey was used as a proxy to the actual devaluation rate. The riskless LIBOR rate was obtained from British Bankers’ Association data. Finally the average 6 months’ government borrowing rate was obtained from the web site of Turkish Ministry of Finance.
6. Analysis and Findings 6.1. Relative Purchasing Power Parity
The real return of local currency (TL) with respect to foreign currency (USD) is presented at Table 2. The real return was calculated according to the following formula:
Real Return of Local Currency = (equilibrium rate – actual rate) / equilibrium rate
where, the equilibrium rate is the fair value of the local currency (TL) with respect to hard currency (USD). As can be noted form Table 2, in all years except the first half of 2006 and the second half of 2008, Turkish Lira is appreciated against USD.
Table 2. Real Return of TL
2005/1 2005/2 2006/1 2006/2 2007/1 2007/2 2008/1 2008/2 2009/1 2009/2 Total
Inflation Turke y (PPI) 1,89% 0,76% 11,68% -0,09% 2,98% 2,87% 13,76% -4,97% 3,27% 2,58% 34,73%
Inflation USA (PPI) 0,90% 0,00% 0,60% 0,90% 1,00% -1,00% 1,70% -1,90% 2,50% 2,00% 6,70%
Equilibrium Fx Rate 1,349 1,344 1,475 1,554 1,433 1,354 1,282 1,179 1,533 1,539 1,621
Actual Fx Rate 1,334 1,342 1,570 1,406 1,305 1,159 1,219 1,522 1,530 1,506 1,506
Re al Re turn of TL 1,15% 0,14% -6,43% 9,56% 8,94% 14,36% 4,96% -29,05% 0,20% 2,15% 7,13%
For the remainder of the analysis, the first half of 2006 and the second half of the 2008 will be called periods of turbulence and all others periods of disequilibrium. It is expected a spread gain for years of disequilibrium and a loss for that of turbulence.
6.2. Magnitude of Foreign Exchange Denominated Borrowings
The foreign exchange denominated borrowings figures and the ratio of these positions to total assets calculated for eight subperiods are presented in Table 3 below. As can be seen, on the average, companies hold foreign exchange denominated borrowings for all subperiods. Foreign exchange denominated borrowings ratio to total assets showed an increasing trend up to the second quarter of 2006 and then remained stable. Within the total sample, the largest borrowings were realized in the second half of 2008 and in 2009 with 17% of total assets. On the other hand, the smallest borrowings were held in the first half of 2005. Among the companies having foreign exchange denominated borrowings, the maximum amount was in the second half of 2008 and 2009, while the minimum amount was held in the first half of 2005, consistent with the total sample.
Table 3. Foreign Exchange Denominated Financial Borrowings
2005/1 2005/2 2006/1 2006/2 2007/1 2007/2 2008/1 2008/2 2009/1 2009/2 me an Total Sample
Total Financial Borrowings (bn TL) 10.404 11.432 14.937 17.095 17.060 17.674 26.677 27.704 26.351 24.603 19.394 FX De nominate d Financial Borrowings (bn TL) 7.813 9.081 11.093 12.335 11.084 10.890 15.532 17.076 17.353 17.428 12.968 FX De nominate d Financial Borrowings / Total Financial Borrowings 75% 79% 74% 72% 65% 62% 58% 62% 66% 71% 68% FX De nominate d Financial Borrowings / Total Asse ts 12% 13% 16% 16% 15% 14% 15% 17% 17% 17% 15%
Numbe r of C ompanie s 145 145 145 145 145 145 145 145 145 145 145
C ompanie s - With Fore ign Exchange De nominate d Borrowings
Total Financial Borrowings 10.005 11.225 14.781 16.985 16.802 16.147 26.458 27.548 26.279 24.272 19.050 FX De nominate d Financial Borrowings 7.813 9.081 11.093 12.335 11.084 10.890 15.532 17.076 17.353 17.428 12.968 FX De nominate d Financial Borrowings / Total Financial Borrowings 78% 81% 75% 73% 66% 67% 59% 62% 66% 72% 70% FX De nominate d Financial Borrowings / Total Asse ts 14% 15% 17% 17% 16% 17% 16% 18% 18% 18% 17%
Numbe r of C ompanie s 110 112 112 112 116 116 115 115 117 111 114
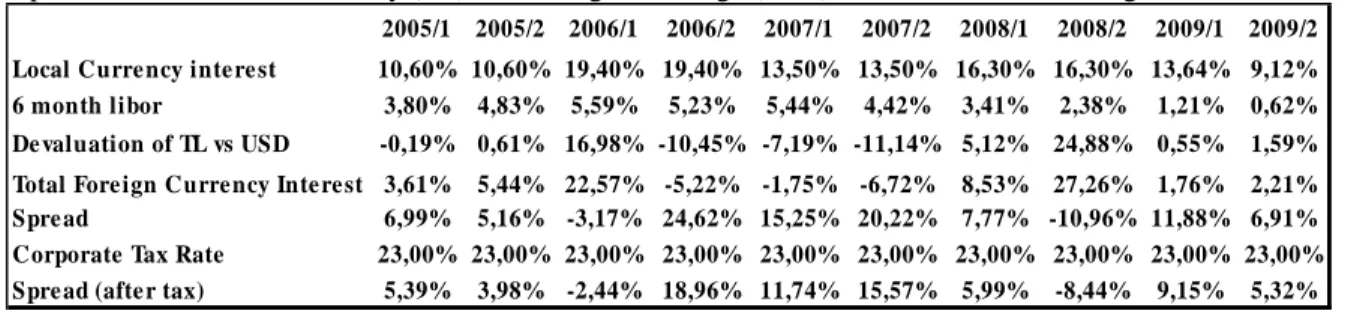
In order to calculate spread gains or losses, costs of TL and foreign exchange borrowings was calculated first, and the results are presented on Table 4 below. The spread gain and loss was calculated by taking the difference between the costs of riskless 6 months TL borrowings and that of USD denominated borrowings. As can be seen from Table 4, in all the periods except the first half of 2006 and the second half of 2008, the after tax spread was positive.
Spread Between Local Currency (TL) and Foreign Exchange (USD) Denominated Borrowings
2005/1 2005/2 2006/1 2006/2 2007/1 2007/2 2008/1 2008/2 2009/1 2009/2
Local Curre ncy inte re st 10,60% 10,60% 19,40% 19,40% 13,50% 13,50% 16,30% 16,30% 13,64% 9,12%
6 month libor 3,80% 4,83% 5,59% 5,23% 5,44% 4,42% 3,41% 2,38% 1,21% 0,62%
De valuation of TL vs USD -0,19% 0,61% 16,98% -10,45% -7,19% -11,14% 5,12% 24,88% 0,55% 1,59%
Total Fore ign Curre ncy Inte re st 3,61% 5,44% 22,57% -5,22% -1,75% -6,72% 8,53% 27,26% 1,76% 2,21%
Spre ad 6,99% 5,16% -3,17% 24,62% 15,25% 20,22% 7,77% -10,96% 11,88% 6,91%
Corporate Tax Rate 23,00% 23,00% 23,00% 23,00% 23,00% 23,00% 23,00% 23,00% 23,00% 23,00%
Spre ad (afte r tax) 5,39% 3,98% -2,44% 18,96% 11,74% 15,57% 5,99% -8,44% 9,15% 5,32%
The gain and loss from foreign exchange denominated borrowings is defined as the product of the amount of foreign exchange denominated borrowings and after-tax spread. The results are shown in Table 5. The largest spread gain was realized in the second half of 2006 with 78 percent of earnings before interest and taxes (EBIT). Still, there exist significantly high spread gains for all periods of analysis except the periods of turbulence. Especially the high spread loss during the second half of 2008 (72 percent of EBIT) points out that short positions in foreign currencies make companies exceptionally vulnerable in times of economic turbulence.
Table 5: Spread Gain and Loss
2005/1 2005/2 2006/1 2006/2 2007/1 2007/2 2008/1 2008/2 2009/1 2009/2 MEAN Fore ign Exchange De nominate d Borrowings -7.813 -9.081 -11.093 -12.335 -11.084 -10.890 -15.532 -17.076 -17.353 -17.428 -12.968 Spre ad 5,39% 3,98% -2,44% 18,96% 11,74% 15,57% 5,99% -8,44% 9,15% 5,32% 6,52% Spre ad Gain - Loss 421 361 -271 2.339 1.301 1.695 930 -1.441 1.588 927 785 Spre ad Gain - Loss / EBIT 23,37% 16,19% -11,23% 77,91% 42,26% 50,51% 46,23% -71,92% 53,29% 15,11% 24,17%
6.3. Foreign Exchange Denominated Borrowings and Cost of Capital
The effect of foreign exchange denominated borrowings on cost of capital is analyzed at Table 6. As expected, in all subperiods of disequilibrium, the foreign exchange denominated borrowings had positive effect on cost of capital giving support to hypothesis 1. The largest decrease was observed in the second half of 2006, with 3% decrease in cost of capital.
Table 6: The Effect of Spread on Cost of Capital
2005/1 2005/2 2006/1 2006/2 2007/1 2007/2 2008/1 2008/2 2009/1 2009/2 me an FX Financial borrowings/ Total Asse ts 13,93% 14,71% 17,19% 17,50% 16,49% 16,92% 16,39% 18,00% 17,85% 17,98% 16,70% Spre ad Afte r Tax 5,39% 3,98% -2,44% 18,96% 11,74% 15,57% 5,99% -8,44% 9,15% 5,32% 6,52% The Effe ct of Spre ad on Cost of Capital 0,75% 0,58% -0,42% 3,32% 1,94% 2,63% 0,98% -1,52% 1,63% 0,96% 1,03%
6.4. Foreign Exchange Positions and Company Risk
The risk structure of the companies in our sample is presented in Table 7. As already explained in the variables section, operating risk is measured by the coefficient of variation of operating profit margin, while total risk is measured by the coefficient of variation of return on equity. At operating level, companies with foreign exchange denominated borrowings were exposed to less risk than those without and the difference was found to be statistically significant Looking at the total risk structure however, firms with foreign exchange denominated borrowings were riskier than those with long positions though the difference is not significant at 10% confidence level. Foreign exchange risk appeared as an important variable which increases considerably the total risk structure of the firms.
Table 7. Risk Structure
O pe rating Risk Total Risk
Total Sample 0,1080 0,2463
C ompanie s - With Fore ign Exchange De nominate d Borrowings 0,0969 0,2599 C ompanie s - Without Fore ign Exchange De nominate d Borrowings 0,1562 0,1854
T-Value 1,72* 1,31
* significant at 10% confidence level
6.5. Foreign Exchange Positions and Operating Profitability
Hypothesis 1 stated that operating profitability of companies carrying foreign exchange denominated debt is lower than those without. Relatedly, one would expect that foreign exchange denominated financial borrowings, decrease cost of capital in times of purchasing power disparity and increase it in times of turbulence or crisis, from which premise emerges hypothesis 2. To test these two hypotheses, the operating profitabilities of the firms with and without foreign exchange denominated borrowings were compared with parametric t-tests implemented using SPSS software. The results are presented in Table 8. As can be seen, compared to firms without foreign exchange denominated debt, firms carrying foreign exchange denominated debt had lower operating profitabilities, and hence higher cost of capital that needed to be decreased for 7 out of 10 subperiods. The difference was statistically significant for all these 7 subperiods. Hence, hypotheses 1 and 2 were partially supported.
Table 8. Operating Profitability
2005/1 2005/2 2006/1 2006/2 2007/1 2007/2 2008/1 2008/2 2009/1 2009/2 Me an Total sample 5,03% 5,20% 5,62% 6,34% 6,70% 6,53% 3,04% 3,15% 5,02% 6,19% 5,28% Companie s with FX de nominate d borrowings 5,11% 5,04% 5,27% 5,90% 6,44% 3,31% 3,05% 3,18% 4,99% 6,00% 4,83% Companie s without FX de nominate d borrowings 4,24% 7,53% 9,92% 12,88% 10,66% 9,27% 2,81% 2,40% 6,06% 9,51% 7,53% T-value 0.51 1.67* 3.21*** 3.92*** 2.20** 4.21*** 0.33 1.66* 0.96 2,42**
* significant at 10% confidence level; ** significant at %5 confidence level; *** significant at 1% confidence level.
6.5. Foreign Exchange Positions and Return on Equity
Hypothesis 3 stated that the average after tax return for companies which borrow in foreign exchange denominated debt instruments is higher than the average operating profitability for companies which borrow only in local currency denominated debt instruments for periods of relative purchasing parity disequilibrium. To test the hypothesis, parametric t-tests were conducted using SPSS software for each of the periods of disequilibrium in which TL appreciated against the USD and the results are shown in Table 9 below. As can be seen, the average return on equity of companies with short foreign exchange positions is higher compared to the average return on equity of the companies holding long foreign exchange positions in 7 out of 8 subperiods. The difference
however, is statistically significant for 4 time periods giving partial support to hypothesis 3. An important point to be noted is that there is no statistically significant difference in return on equity in two subperiods preceeding the turbulences where the first footsteps were felt and the appreciation of TL was minimal.
Table 9. ROE- Periods of Disequilibrium
2005/1 2005/2 2006/2 2007/1 2007/2 2008/1 2009/1 2009/2 Me an
Total sample 4,92% 4,77% 11,35% 10,00% 13,31% 9,33% 3,20% 10,73% 8.95%
Companie s with FX de nominate d borrowings 5,20% 4,85% 11,39% 10,41% 14,46% 9,90% 3,15% 10,79% 9.37%
Companie s without FX de nominate d borrowings 3,45% 4,28% 11,12% 7,69% 7,79% 3,76% 3,97% 10,18% 6.35%
T-value 1.82* 0.76 0.33 2.10** 3.52*** 4.31*** 0.85 0.96
* significant at 10% confidence level; ** significant at %5 confidence level; *** significant at 1% confidence level.
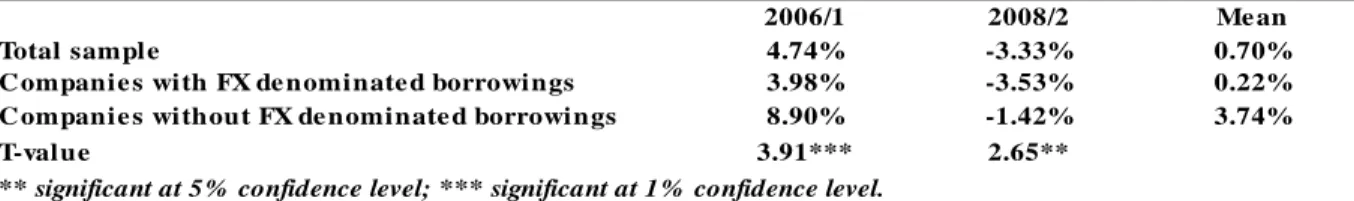
Hypothesis 4 stated that the average after tax return for companies which borrow in foreign exchange denominated debt instruments is lower than the average operating profitability for companies which borrow only in local currency denominated debt instruments for periods of turbulence or crisis. The return on equity structure of the firms with and without foreign exchange denominated borrowings are presented at Table 10. As can be seen, in times of crisis, the returns on equity values of companies with short foreign exchange position are significantly lower than those with long position; the difference is significant. Hence, hypothesis 4 is empirically supported.
Table 10. ROE- Periods of Turbulence
2006/1 2008/2 Me an
Total sample 4.74% -3.33% 0.70%
C ompanie s with FX de nominate d borrowings 3.98% -3.53% 0.22%
C ompanie s without FX de nominate d borrowings 8.90% -1.42% 3.74%
T-value 3.91*** 2.65**
** significant at 5% confidence level; *** significant at 1% confidence level.
7. Conclusion
The purpose of this study was to investigate the causes and magnitude of foreign exchange risks of Turkish manufacturing companies and the impact of these risks on corporate profitability.It was hypothesized that the average operating profitability for companies borrowing in foreign exchange denominated debt instruments was lower than the average operating profitability for companies which are not subject to foreign exchange risk, whereas the average after tax return for companies borrowing in foreign exchange denominated debt instruments was higher than the after tax return for companies not subject to foreign exchange risks for periods of relative purchasing parity disequilibrium and lower for periods of turbulence or crisis
To measure spread gain and losses, the difference between the costs of foreign exchange denominated debt and that of local currency denominated debt was calculated for each company and for each subperiod. Operating profitability was measured with operating profit and after tax return with return on equity. As a proxy for local currency appreciation or depreciation, the difference between actual and equilibrium rates was used.The dataset consisted of 145 manufacturing companies listed on the Istanbul Stock Exchange (ISE) as of the end of 2009. The data were collected from semi-annual financial statements and spanned the period from the first half of 2005 to the second half of 2009, resulting in a total of ten time periods.
As a preliminary finding, it was found out that for the eight subperiods, on the average, companies’ foreign exchange denominated borrowings are about 15 percent of their assets. When companies without foreign exchange denominated borrowings are excluded, the figure rises to 17 percent. Furthermore in all the periods except the first half of 2006 and the second half of 2008, the TL appreciated against the USD, which is a sign of purchasing power disparity. When the spread gain is defined as the difference between the costs of US and TL denominated debt, it was found out that there exist significantly high spread gains for all periods of analysis except the first half of 2006 and second half of 2008, which demark periods of economic fluctuation. Statistical analyses showed that, on average, operating profitability for companies borrowing in foreign exchange is lower
than that of the average operating profitability for companies that are not subject to foreign exchange risk. These results suggest that one of the reasons firms borrow in foreign currency is to boost their profitability figures in years where they expect TL to appreciate. It was also discovered that the average after tax return for companies borrowing in foreign exchange is higher than the average after tax return for companies not subject to foreign exchange risks for all periods of relative purchasing power parity disequilibrium where TL appreciates. However, the reverse was found to be true for periods of TL depreciation.
The findings were in line both with studies conducted in the banking sector and the single study conducted in Turkish manufacturing sector. The main limitation was sample selection, since only public companies listed on the Istanbul Stock Exchange were examined due to the availability of financial statements. Still, the study is contributory as its findings have strategic implications for firms operating in the manufacturing sector.
REFERENCES
1. Aliber, R. Z., (1976). “Equilibrium and Disequilibrium in the International Money Market”; Review of World Economics, Vol. 112, No. 1, pp.73-90.
2. Auerbach, A. J., (1979). “Wealth Maximization and the Cost of Capital”; The Quarterly Journal of Economics, Vol. 93, No. 3, pp. 433-446.
3. Calvo, G: A., Izquierdo, A., &. Mejia L. F., (2004). “On the Empirics of Sudden Stops: The Relevance of Balance Sheet Effects”, NBER Working Paper, No. 10520.
4. Copeland, T., Weston, F., & Shastri, K., (2005). Financial Theory and Corporate Policy, Pearson Addison Wesley, 4th Ed.
5. Domaç, I. & Peria M., (2003). “Banking Crises and Exchange Rate Regimes: Is There a Link?” Journal of International Economics, Vol. 61, No.1, pp.41-72.
6. Eichengreen, B. & Hausmann, R., (1999). “Exchange Rates and Financial Fragility” NBER Working Paper, No. 7418.
7. Hausmann, R. , (1999). “Should There Be Five Currencies or One Hundred and Five?”, Foreign Policy, Vol. 116, pp.65–79.
8. Kaminsky, G. & Reinhart, C., (1999). “The Twin Crises: the Causes of Banking and Balance of Payments Problems.” American Economic Review, Vol.89, No.3, pp.473–500.
9. Kesriyeli, M., Özmen, E & Yiğit, S. (2005). “Corporate Sector Debt Composition and Exchange Rate Balance Sheet Effect in Turkey”, Central Bank of Turkey Working Paper, No 05/16.
10. Levy, Yeyati, E., (2006). “Financial Dollarization: Evaluating the Consequences”, Economic Policy, Vol.21, pp. 61–118.
11. Lothian, J., Taylor, M., (1996). “Real Exchange Rate Behaviour: The Recent Float from the Perspective of Past Two Centruies” Journal of Political Economy, Vol.104, No.3, pp.488-509.
12. Nicolo, G., Honohan, P. ve Ize A., (2003). “Dollarization of the Banking System: Good or Bad”, World Bank Policy ResearchWorking Paper, No.3116.
13. Onaran, Ö., (2007). “Cash Flows, Turbulences and Distribution: The Case of Turkey”, Unpublished Manuscript, Istanbul Technical University.
14. Rogoff, K., (1996). “The Purchasing Power Parity Puzzle”, Journal of Economic Literature; Vol. 34, pp.647-668.
15. International Conference on Dollarization; December 14-15, 2006. Consequences and Policy Options. 16. The speech of the Governor of Central Bank of Turkey Mr Durmuş Yılmaz'ın in a conference titled
"Globalization, Inflation and Monetary Policy”; 21.11.2008. Istanbul. 17. British Bankers’ Association web site available at www.bba.org.uk 18. Central Bank of Turkey web site available at www.tcmb.gov.tr 19. Istanbul Stock Exchange web site available at www.imkb.gov.tr 20. Turkish Statistical Institute web site availbale at www.tuik.gov.tr