Radial Basis Function Neural Network and Logistic Regression
Analysis For Prognostic Classifi cation of Coronary Artery Disease
Koroner Arter Hastalığının Sınıfl anmasında Radial Basis Fonsiyonu Sinir Ağı ve Lojistik Regresyon AnaliziŞeref Sağıroglu
1, Cemil Çolak
2, M. Cengiz Çolak
3, M. Ali Atıcı
2, Necati Alasulu
41Gazi Üniversitesi Mühendislik Mimarlık Fakültesi, 2Türk Standardları Enstitüsü,
3İnönü Üniversitesi Tıp Fakültesi Kalp Damar Cerrahisi Anabilim Dalı,
4Kalite Araştırma Danışmanlık ve Eğitim Merkezi (KADEM),
Received: 14.08.2007 • Accepted: 09.11.2007
Corresponding author
Cemil Çolak
Türk Standardları Enstitüsü, 06100 Bakanlıklar, Ankara Phone : +90 (312) 416 63 02
E-mail address : [email protected]
Objective: Artifi cial Neural Networks (ANNs) trained with backpropagation learning algorithm have been used commonly in previous studies. This study presents radial basis function neural network (RBFNN), a special kind of neural network, and logistic regression analysis (LRA) for prog-nostic classifi cation of Coronary Artery Disease (CAD).
Methods: The records of 237 consecutive people who had been referred for the department of Cardiology were used in the analysis. Radial basis function neural network and logistic regression analysis were used for CAD classifi cation.
Results: The results have shown that LRA and RBFNN were both successful for classifi cation and might be used for non-invasively based on clinical variables in the classifi cation of diseases like CAD.
Conclusions: The work can be concluded that LRA performed the classifi cation better than RBFNN for prognostic CAD classifi cation in the present CAD data. However, RBFNN, utilizing larger sample sizes, can have better classifi cation accuracy. For more defi nite comparison, simulation studies should be carried out using various methods.
Key Words: Coronary artery disease,Classifi cation,Logistic regression analysis,Radial basis function neural network.
Amaç: Önceki çalışmalarda geriye yayılım algoritması ile eğitilen yapay sinir ağları yaygın olarak incelenmiştir. Bu çalışmada, koroner arter hastalığının (KAH) sınıfl anmasında radial basis fonksiyo-nu sinir ağı ve lojistik regresyon analizi tanıtılmaktadır.
Yöntem: Kardiyoloji bölümüne müracaat eden ardışık 237 bireyin kayıtları analizde kullanılmıştır. Koroner arter hastalığının sınıfl anmasında radial basis fonksiyonu sinir ağı ve lojistik regresyon analizi kullanılmıştır.
Bulgular: Çalışmanın bulguları, radial basis fonksiyonu sinir ağı ve lojistik regresyon analizinin sınıfl amada oldukça başarılı olduğunu ve incelenen klinik değişkenlere dayalı olarak koroner arter gibi hastalıkların sınıfl anmasında invaziv olmayan bir biçimde kullanılabileceğini göstermiştir. Sonuç: İncelenen KAH’a ait verilerde, lojistik regresyon analizi, radial basis fonksiyonu sinir ağın-dan daha iyi sonuçlar vermiştir. Ancak, daha büyük örnek çapları söz konusu olduğunda radial basis fonksiyonu sinir ağı daha iyi sınıfl ama sonuçları verebilir. Daha kesin karşılaştırma sonuçları elde edebilmek için, simülasyon çalışmaları değişik yöntemler kullanılarak yapılmalıdır.
Anahtar Kelimeler: Lojistik regresyon analizi, koroner arter hastalığı, radial basis fonksiyonu sinir ağı, sınıfl ama.
Artificial Neural Networks (ANNs) are the computer programs which are biologically inspired to design to simulate the way in which the human brain processes informa-tion. ANNs gather their knowl-edge by abstracting the patterns and relationships in data and learn
through experience, not from pro-gramming. ANNs have been one of promising intelligence techniques for prognostic and diagnostic clas-sification in clinical medicine (1-7). ANNs can be used as a statisti-cal analysis tool to build a model from available examples (defined
by a series of numeric or textual descriptive variables) belonging to a problem or behavior (4, 8). In cardiovascular medicine, several
applications of ANNs were carried out for prediction and prognostic classification of CAD (1, 3, 6, 7). In the applications, ANNs were most-ly trained with backpropagation learning algorithm. It was report-ed that the use of ANN for prog-nostic classification might achieve more precise results then classical approaches.
Logistic Regression Analysis (LRA) is another technique used for prog-nostic classification and is one of the most popular and robust mod-eling procedures used to analyze epidemiologic data when the dis-ease measure is dichotomous (9, 10). LRA has been also used to identify significant risk factors as-sociated with CAD (11-15).
ANN models trained with different learning algorithms and LRA were compared for prognostic classifi-cation of CAD (3, 16). The studies suggested a number of important points for prognostic purposes in cardiovascular medicine.
In this paper, Radial Basis Function Neural Network (RBFNN), which is one of ANN structures, and LRA have been applied for prognostic CAD classification to get better re-sults and simpler structure.
Materials and Methods
Study dataThis work was carried out as a ret-rospective case-control study. In Inonu University Faculty of Medi-cine, Malatya, Turkey, 237 consecu-tive people who had been referred for the department of Cardiology
were studied in the year of 2001. 124 consecutive patients (group 1) who had been diagnosed with CAD by coronary angiography (at least 1 coronary stenosis > 50% in major epicardial arteries) were enrolled in the work. Angiograph-ically, the 113 people (group 2) with normal coronary arteries were taken as control subjects. The criterion of normal coronary arteries are absence of plaque in major epicardial arteries, no wall diseases, absence of spasm and/or coronary ecstasy, and existence of TIMI-3 flow according to the TIMI flow score.
The variables including significant risk factors for CAD (11-13, 17-19) and clinical parameters were ob-tained from groups 1 and 2. Sex (women/men), age (years), hyper-tension (diastolic blood pressure
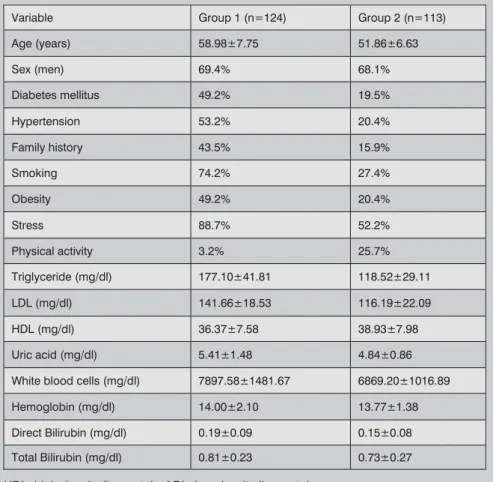
> 90 mmHg and/or systolic blood pressure > 140 mmHg) (20), dia-betes mellitus (Type 2 diadia-betes based on the criterions reported by World Health Organization) (21, 22), family history, smoking, stress, physical activity, obesity (Body Mass Index-BMI > 30) (23), hemoglobin, white blood cells, uric acid, triglyceride, high-densi-ty lipoprotein (HDL), low-densihigh-densi-ty lipoprotein (LDL), direct bilirubin and total bilirubin were recorded from each group. All variables and their units are shown in Table 1.
Logistic regression analysis
Logistic regression is well suited for describing and testing hypotheses about relationships between a cat-egorical outcome variable and one or more categorical or continuous predictor variables (24). In the
Variable Group 1 (n=124) Group 2 (n=113)
Age (years) 58.98±7.75 51.86±6.63 Sex (men) 69.4% 68.1% Diabetes mellitus 49.2% 19.5% Hypertension 53.2% 20.4% Family history 43.5% 15.9% Smoking 74.2% 27.4% Obesity 49.2% 20.4% Stress 88.7% 52.2% Physical activity 3.2% 25.7% Triglyceride (mg/dl) 177.10±41.81 118.52±29.11 LDL (mg/dl) 141.66±18.53 116.19±22.09 HDL (mg/dl) 36.37±7.58 38.93±7.98 Uric acid (mg/dl) 5.41±1.48 4.84±0.86
White blood cells (mg/dl) 7897.58±1481.67 6869.20±1016.89
Hemoglobin (mg/dl) 14.00±2.10 13.77±1.38
Direct Bilirubin (mg/dl) 0.19±0.09 0.15±0.08
Total Bilirubin (mg/dl) 0.81±0.23 0.73±0.27
Table 1: Descriptive Statistics for the groups
analysis, multivariate logistic re-gression analysis was applied to CAD data. Backward model selec-tion method was used for Logistic regression. The predictive vari-ables given before were used to predict CAD by Logistic regression analysis.
Artificial neural networks
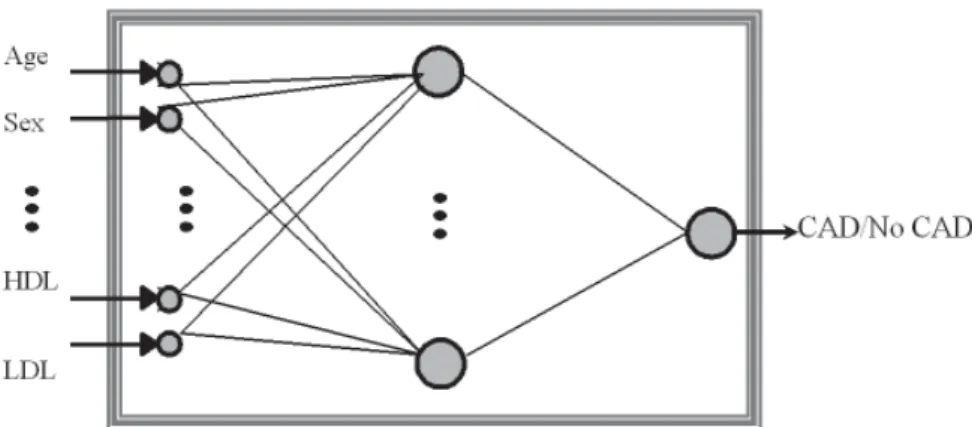
Radial basis function neural net-work (RBFNN) is one of ANN ar-chitectures used in applications (8, 25). RBFNN has internal rep-resentation of hidden neurons which is radially symmetric (26) as shown in Figure 1. A RBFNN generally involves three different layers. The first layer is made up of source neurons. The second layer is a hidden layer of a number of neurons. Each neuron in this layer calculates the Euclidean dis-tance between the centre and the network input vector, and passes the result through a nonlinear function. The output layer is es-sentially a set of linear combiners
and supplies the response of the network.
The learning consists of using a clus-tering algorithm for determining the cluster centres and the nearest neighbor heuristic for determining the cluster centres. The extended Delta-Bar-Delta (EDBD) learn-ing algorithm is used to train the weights in the output layer (27-29). In order to classify CAD data, 17 input sets were applied to the input layer of a RBFNN. The in-puts were: Age, Sex, Diabetes mel-litus, Hypertension, Family history, Smoking, Obesity, Stress, Physical activity, Triglyceride, LDL, HDL, Uric acid, White blood cells, He-moglobin, Direct Bilirubin, and To-tal Bilirubin. The ranges for these inputs were given in Table 1. The training rms (root mean squared)
error achieved was 0.00423 in this classification task. The network architecture was 17x50x1 having 17 inputs in the input layer, 50 neurons in the hidden layer and
1 neuron in the output layer. The number of epochs were 42,000. After training, RBFNN was tested by a
set of data which was not used in the training process. As a result of testing, it becomes clear whether the network has really learned or has just memorized. More than 10% of the whole data set, if pos-sible, may be taken as testing data set (30). In our work, 66 of the 237 records, that is, nearly 28% of the whole data was used to test the model performance.
Statistical Analysis
Values are given as Means±Standard Deviation or percentage. Statistical analysis was performed by using multivariate LRA and RBFNN ap-proaches. SPSS 10.0 for Windows (SPSS Inc., Chicago, USA) and MATLAB 6.5 for Windows were used for statistical analysis.
Results
Descriptive statistics of the groups were shown in Table 1. The mean ages of Group 1 and Group 2 for men were 58.98±7.75 and 51.86±6.63 years old. The per-centages of men for Group 1 and Group 2 were 69.4% and 68.1%, respectively.
In training, 171 of 237 records were used. The training result obtained RBFNN for CAD classification was presented in Table 2. As can be
Figure 1: Classifying CAD using ANN
Table 2: Results for CAD Classification
RBFNN Model Accuracy (%) Sensitivity (%) Specificity (%)
Positive Predictive Value (%) Negative Predictive Value (%) n Training 100 100 100 100 100 171 Test 87.8 86.8 89.3 87.6 88.2 66 Average 93.7 93.4 94.6 93.8 94.1 237
clearly seen from the results given in Table 2, sensitivity, specificity, accuracy, positive and negative predictive values were all 100% in training. The test performance of RBFNN classifier on 66 remaining records, of which were never seen by or applied to RBFNN before, was examined after training. The test results achieved from RBFNN model for CAD classification were also presented in Table 2. The percentages for accuracy, sensitiv-ity and specificsensitiv-ity were 87.8, 89.3 and 86.8, respectively. In addition, positive and negative predictive values in test given in Table 2 were 87.6 and 88.2. The values may be relatively high and acceptable for CAD classification.
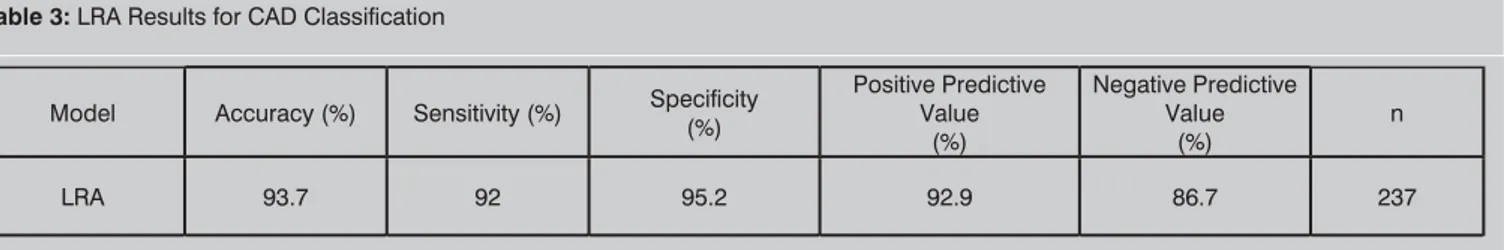
LRA was performed on 237 records covering training and test data sets as used in RBFNN processes. The details of LRA were presented in Tablo 3. Specificity, sensitivity and accuracy values for LRA mod-el were 95.2%, 92% and 93.7%, respectively. Also, positive and negative predictive values for LRA were given in Table 3. It can be said that multivariate LRA model performed the CAD classification task with high classification rates. This result was confirmed by Hos-mer-Lemeshow goodness of fit cri-terion (Chi-square=2.444, df=8, p=0.964).
Discussion
RBFNN trained with EDBD learn-ing algorithm and LRA have been successfully applied for CAD
clas-sifications. RBFNN was found very successful in training (the success rate was %100) but the success rate was 89.3 in test for prognos-tic CAD classification. Logisprognos-tic re-gression analysis had higher sen-sitivity, specificity and accuracy as compared to RBFNN model in the present results. When the total size of RBFNN was consid-ered, the specificity was near the LRA. For more definite and robust comparison, further simulation studies should be carried out us-ing various methods. Even if small sample size had been used in RBFNN training, higher specific-ity, accuracy and sensitivity were achieved. This might help to re-duce time consuming and cost ef-fective tasks in laboratory exercis-es. Estimating CAD with the help of ANN provides fast computation, less laboratory exercises, less time and more comfort to patients. When ANNs are reviewed in some
cardiologic applications (1, 6, 7, 31), Allison et al. (1) introduced an approach to model a stress single-photon emission computed tomographic imaging for detect-ing extensive CAD. They obtained high sensitivity and specificity in diagnosing extensive CAD and re-ported that ANNs had great prom-ise as an aid to correctly iden-tify patients at high risk for CAD. Scott et al. (6) used ANNs in the recognition of ischemic heart dis-ease (IHD). They stated that the method was promising as a diag-nostic aid to the recognition of IHD. Kotel’nikova et al. (31) pro-posed an ANN for prognostication of coronary atherosclerosis and
used nineteen clinical and instru-mental parameters for multifacto-rial analysis. They deduced that prognosis made with the use of ANN was 1.5-3 times much more accurate than that made by a phy-sician. Tham et al. (7) developed an ANN approach that was able to yield promising prediction results on CAD.
LRA is widely used in CAD prediction (32-36). Afiune et al. (33) indicat-ed that monocytosis was an inde-pendent variable for CAD. Adler et al. (32) applied stepwise LRA and demonstrated that age, gender (male) and mitral annulus classi-fication as the independent vari-ables significantly were associated with CAD. Costacou et al. (34) examined whether cellular adhe-sion molecules further improve CAD prediction by the agency of conditional LRA. Hou et al. (35) identified the risk factors associ-ated with cardiovascular disease using LRA model in 1239 Chinese chronic kidney disease patients. Senior et al. (36) predicted CAD using logistic regression model. The results showed that CAD was associated with age, duration of diabetes, hypertension and smok-ing. More recently, Colak et al. (37) compared logistic regression model selection methods for the prediction of CAD. They conclud-ed that logistic regression model selection methods were very suc-cessful in the prediction of CAD. The results achieved from this study
have shown once more that ANNs and LRA are very promising for the prediction and classification of the
Table 3: LRA Results for CAD Classification
Model Accuracy (%) Sensitivity (%) Specificity (%) Positive Predictive Value
(%)
Negative Predictive Value
(%) n
REFERENCES
1. Allison JS, Heo J, Iskandrian AE. Artificial neural network modeling of stress single-photon emission computed tomographic imaging for detecting extensive coronary artery disease. Am J Cardiol 2005; 95:178-81.
2. Bigi R, Gregori D, Cortigiani L, et al. Artifi-cial neural networks and robust Bayesian classifiers for risk stratification following uncomplicated myocardial infarction. Int J Cardiol 2005; 101: 481-487.
3. Dubey AK. Using rough sets, neural networks, and logistic regression to pre-dict compliance with cholesterol guideli-nes goals in patients with coronary artery disease. AMIA Annu Symp Proc 2003; 834.
4. Eapen BR. ‘Neural network’ algorithm to predict severity in epidermolysis bullosa simplex. Indian J Dermatol Venereol Lep-rol 2005; 71: 106-108.
5. Itchhaporia D, Snow PB, Almassy RJ, et al. Artificial Neural Networks: Current Status in Cardiovascular Medicine. JACC 1996; 28: 515-21.
6. Scott JA, Aziz K, Yasuda T, et al. Integrati-on of clinical and imaging data to predict the presence of coronary artery disease with the use of neural networks. Coron Artery Dis 2004; 15(7):427-34.
7. Tham CK, Heng CK, Chin WC. Predicting risk of coronary artery disease from DNA microarray-based genotyping using neu-ral networks and other statistical analysis tool. J Bioinform Comput Biol 2003; 1: 521-39.
8. Haykin S. “Neural Networks: A
Compre-hensive Foundation”. New York, USA, Macmillan College Publishing Company, ISBN 0-0235-2761-7, 1994.
9. Hosmer DW, Lemeshow S. Applied Logis-tic Regression, John Wiley & Sons, 1989. 10. Kleinbaum, DG. Logistic Regression: A
self-Learning Text, New York, 1992. 11. Gupta R, Sarna M, Thanvi J, et al. High
Prevalence of Multiple Coronary Risk Fac-tors in Punjabi Bhatia Community: Jaipur Heart Watch-3, Indian Heart J 2004; 56: 646–652.
12. Linlon MF, Fazio S. A practical approach to risk assesment to prevent coronary ar-tery disease and its complications. Am J Cardiol 2003; 92: 191-261.
13. Onat A. Risk Factors and cardiovascular disease in Turkey, Atherosclerosis 2001; 156: 1-10.
14. Shaw LJ, Peterson ED, Shaw LK, et al. Use of a Prognostic Treadmill Score in Iden-tifying Diagnostic Coronary Disease Subg-roups. Circulation 1998; 98: 1622-1630. 15. Yologlu S, Sezgin AT, Ozdemir R, et al.
Identifying Risk Factors in a Patient Popu-lation Mostly Overweight with Coronery Artery Disease. Angiology 2003; 54: 181-6.
16. Mobley BA, Schechter E, Moore WE, et al. Predictions of coronary artery stenosis by artificial neural network. Artificial Intelli-gence in Medicine 2000; 18: 187–203. 17. Gamberger D, Lavrac N, Krstacic G. Active
subgroup mining: a case study in coro-nary heart disease risk group detection. Artificial Intelligence in Medicine 2003; 28: 27–57.
18. Kim HK, Chang SA, Choi EK, et al. Asso-ciation between plasma lipids, and apoli-poproteins and coronary artery disease: a cross-sectional study in a low-risk Korean population, Int J Cardiol 2005; 101: 435-440.
19. Maas R, Böger RH. Old and new cardio-vascular risk factors from unresolved is-sues to new oppurtinies. Atherosclerosis Supplement 2003; 4: 5-17.
20. Chobanian AV, Bakris GL, Black HR, et al. National heart, lung, and blood institute joint national committee on prevention, detection, evaluation, and treatment of high blood pressure; national high blood pressure education program coordinating committee. JAMA 2003; 289: 2560–72. 21. Alberti KG, Zimmet PZ. New diagnostic
criteria and classification of diabetes-aga-in? Diabet Med 1998; 15: 535–536. 22. Report of the expert committee on the
di-agnosis and classification of diabetes mel-litus. Diabetes Care 1997; 20: 1183–97. 23. Clinical guidelines on the identification,
evaluation, and treatment of overweight and obesity in adults: the evidence re-port. National Institutes of Health. Obes Res 1998; 6: 51S-209S.
24. Peng CYJ, Lee KL, Ingersoll GM. An intro-duction to logistic regression analysis and reporting. The Journal of Educational Re-search 2002; 96: 3-14.
25. Maren A, Harston C, Pap R. Handbook of Neural Computing Applications, London, Academic Press, ISBN 0-12-471260-6, 1990.
26. Chen S, Cowan, CFN, Grant PM. Ortho-gonal least squares learning algorithm
diseases like CAD.
Although we have obtained good CAD classification results in both models, a number of limitations exist. First, this work was carried out retrospectively. Second, the sample size of 237 might be rela-tively small for creating suitable RBFNN and LRA models. There-fore, increasing the sample size of CAD might help to get more reliable results. Third, the clinical parameters pertaining to patients were difficult to achieve and the progresses are time consuming and cost effective. Less experimen-tal data is always preferred. Forth, using limited data collected from
a specific region for CAD classifi-cation. Even if ANN classification performs the task with high speci-ficity, the model might not per-form the task with high specificity for another data collected. Fifth, some new risk factors associated with CAD were not studied. It can be concluded that LRA and
RBFNN were both successful for classification and might be used for non-invasively based on clini-cal variables in the classification of diseases like CAD. LRA performed the classification better than RB-FNN for prognostic CAD classifi-cation in the present CAD data. However, RBFNN, utilizing larger
sample sizes, can have better clas-sification accuracy. For more defi-nite comparison, simulation stud-ies should be carried out using various methods.
In relation to future studies for CAD classifications, ANN and LRA mod-els should be trained prospectively with larger sample and additional predictive variables. New archi-tectures and learning algorithms may be used for this classification. In order to achieve more robust model, data may be collected from various environments.
for radial basis function networks. IEEE Transactions on Neural Networks. 1991; 302-309.
27. Moody J, Darken C. Fast-learning in networks of locally-tuned processing units. Neural Computation. 1989; 1: 281-294.
28. Minai AA, Williams RD. Acceleration of backpropagation through learning rate and momentum adaptation. Int. Joint Conf. on Neural Networks 1990; 1; 676-679.
29. Jacobs RA. Increased rate of convergence through learning rate adaptation. Neural Networks 1988; 1: 295-307.
30. Principe J, Euliano NR, Lefebvre WC. Neu-ral and adaptive systems: fundamentals through simulations. New York: John Wi-ley & Sons Inc; 1999.
31. Kotel’nikova EV, Gridnev VI, Dobgalevs-kii PIa, et al. Prognostication of coronary atherosclerosis for selection of tactics of management of patients with ischemic heart disease. Kardiologiia 2004; 44: 15-9.
32. Adler Y, Fisman EZ, Shemesh J, et al. Use-fulness of helical computed tomography in detection of mitral annular calcificati-on as a marker of corcalcificati-onary artery disease. Int J Cardiol 2005; 101: 371-376. 33. Afiune Neto A, Mansur Ade P, Avakian SD,
et al. Monocytosis is an independent risk marker for coronary artery disease. Arq Bras Cardiol 2006; 86: 240-4.
34. Costacou T, Lopes-Virella MF, Zgibor JC, et al. Markers of endothelial dysfunction in the prediction of coronary artery di-sease in Type 1 diabetes. The Pittsburgh
Epidemiology of Diabetes Complications Study. J Diabetes Complications 2005; 19: 183-93.
35. Hou FF, Ma ZG, Mei CL, et al. Epidemio-logy of cardiovascular risk in Chinese ch-ronic kidney disease patients. Zhonghua Yi Xue Za Zhi 2005; 85: 753-9.
36. Senior PA, Welsh RC, McDonald CG, et al. Coronary artery disease is common in nonuremic, asymptomatic type 1 diabetic islet transplant candidates. Diabetes Care 2005; 28: 866-72.
37. Colak C, Colak MC, Orman MN. The comparison of logistic regression model selection methods for the prediction of coronary artery disease. Anadolu Kardiyol Derg. 2007; 7: 6-11.