Eastern Anatolian Journal of Science
Volume I, Issue II, 57-69 Eastern Anatolian Journal of Science
Abstract
The main aim of this study is to determine 1-D shear-velocity structure of the Eastern Anatolian region from the inversion of single-station Rayleigh’s wave group velocity data in the period range of 4-35 seconds, approximately. For this purpose, we used vertical component seismograms of the 2011 Van Earthquake main shock, and its 10 aftershocks recorded at 9 broad-band stations of Kandilli Observatory and Earthquake Research Institute (KOERI). Considering each source-station path, the wave paths were divided into three distinct group. The average group velocity dispersion curves were generated from 14 paths for the first group, 7 paths for the second group, and 13 paths for the third group. These averages were inverted to determine 1-D shear wave velocity structure of the studied region. In addition to this, we calculated the normalized statistical resolution matrix to obtain resolution-length information for total inverse system. According to inversion results, the crustal thickness is approximately 42 km in the study area and S-wave (Sn) velocity ranges between 4.19-4.29 km/s in the Moho. It is clearly seen that shear velocities vary from ∼2.8–3.2 km/s in the upper crust (10-12 km) to ∼3.6 km/s in the lower crust (~35 km). The results of this study are in good agreement with previous studies, and will help to improve S-wave velocity models proposed for Eastern Anatolia and surrounding areas.
Keywords: Eastern Anatolia, Crustal Structure, Rayleigh Wave, Group Velocity, Inversion
1.Introduction
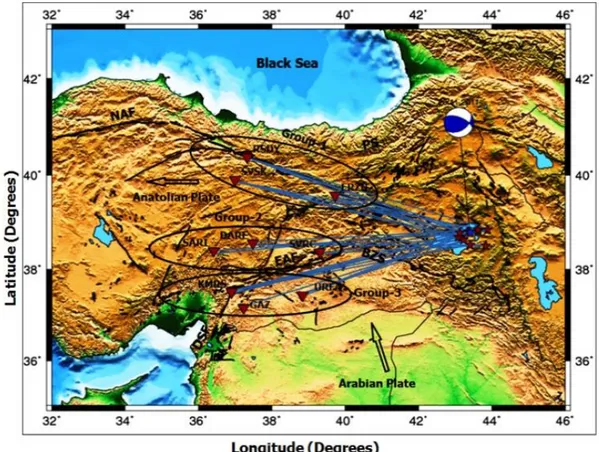
The general tectonic setting of Eastern Anatolia is mainly affected by the roughly northward moving underthrusting Arabian Plate that is separated from the African plate by the left-lateral Dead Sea Fault (DSF) (Figure 1).
Accepted Date: 18.11.2015 Corresponding author: Hakan Çınar, PhD
Karadeniz Technical University, Faculty of Engineering, Department of Geophysics, Trabzon. Turkey
E-mail: [email protected]
The Eastern Anatolia belongs to the Alp–Himalayan mountain belt and in many aspects, it can be thought of as a younger version of the Tibetan plateau (ŞENGÖR and KIDD 1979; DEWEY et al. 1986). The continent-continent collision of the Arabian and Eurasian plates began in the mid-Miocene period (ŞENGÖR and YILMAZ, 1981; DEWEY et al. 1986) and is defined by the Bitlis-Zagros fold and thrust belt. This region has been experiencing crustal shortening and thickening as a result of northward motion of the Arabian plate relative to Eurasia and the attendant post-collisional magmatism (TAYMAZ et al. 1990; MCCLUSKY et al. 2003). This existing convergence has formed average elevation of 2 km in the East Anatolian Plateau and the elevation regularly decreases from there to the Aegean Sea (GÖKALP 2012). The collision results in a westward escape and counter-clockwise rotation of the Anatolian Plate along the two major strike-slip faults, dextral North Anatolian Fault (NAF) zone and sinistral East Anatolian Fault (EAF) zone due to the already existing contraction from the late Miocene period (ŞENGÖR et al. 1985), which join each other at the place named as Karlıova Triple Junction (KTJ). Deformation resulting from the collision in the east of KTJ is accommodated through the crustal thickening and thrusting along the Caucasus Thrust Fronts and the distributed NW–SE trending dextral faults and NE–SW trending sinistral faults within Eastern Anatolia (ŞENGÖR et al. 1985; BARKA and KADINSKY-CADE 1988; McCLUSKY et al. 2000; REILINGER et al. 2006). The shortening between Arabia and Eurasia started about 12 Mya and is proceeding today at a rate of 27 mm/year.
Interaction between dynamic effects of the relative motions of adjoining plates controls large-scale crustal deformation, seismicity, and volcanism in the region (TAYMAZ et al. 2007). The widespread Neogene and Quaternary volcanism are started about 11 Ma over nearly half of the region and hot asthenosphere upwelled and resulted in uplift (KESKİN 2003). The continuing continent–continent collision of the Arabian and Eurasian Tectonic Plates presents widespread seismic activity
Crustal Structure of Eastern Anatolia from Single-Station Rayleigh Wave Group Velocities
HAKAN ÇINAR1, HAMDİ ALKAN2
1
Karadeniz Technical University, Faculty of Engineering, Department of Geophysics, Trabzon, Turkey
characterized by shallow earthquakes generally less than 50 km depth and volcanism (UTKUCU 2013; BAYRAK et al. 2013). Crustal seismicity is overwhelmingly strike-slip in nature suggesting that the collision is accommodated by tectonic escape (TURKELLI et al. 2003). In particular, the NAF has been the location of a
series of large and damaging earthquakes (STEIN et al. 1997). Also earthquake records indicate that events with M≥4.3 have occured in the Lake Van basin such as 1976 Çaldıran earthquake and 2011 Van earthquake (BAYRAK et al. 2013).
Figure 1. The regional map of Eastern Anatolia. The map shows locations of stations for each group (circles) and episantr of the events (stars) used for the Rayleigh wave group velocity analysis. NAF, North Anatolian Fault; EAF, East Anatolian Fault, DSF, Dead Sea Fault; BZS, Bitlis-Zagros Suture; PS, Pontide Suture.
For several decades, seismic velocities have been used to determine the physical properties of crust and mantle and much effort has been put into the understanding of the sensitivity of seismic velocities to the changes of crust and mantle composition (MUTLU and KARABULUT 2011). The structure of the crust and uppermost mantle in Eastern Anatolia has been studied because of the most active tectonic region using different geophysical methods by many authors such as surface waves analysis, receiver function, (MINDEVALLI and MITCHELL 1989; SANDVOL et al. 1998; ÇINAR 1998; ANGUS et al. 2006; GÖK et al. 2007; ÇETİNOL and YOSHIZAWA 2007; TEZEL 2007; OZACAR et al. 2008; OZACAR et al. 2010; TEZEL et al. 2013; VANACORE et al. 2013; SAYIL 2015; ALKAN et al. 2015) and seismic tomography studies (MAGGI and PRIESTLY 2005; GÖKALP 2007; LEI and ZHAO 2007; ZOR 2008; CAMBAZ and KARABULUT 2010; BİRYOL et al. 2011; BAKIRCI et al. 2012; WARREN et al. 2013).
HEARN and NI (1994) obtained Pn velocity distribution and determined low Pn velocities (<7.9 km/s) beneath most of the Turkish–Iranian Plateau and high Pn velocities (>8.1 km/s) beneath the Black Sea and southern Caspian Sea. ÇINAR (1998) investigated 1-D crustal structure in and around the Eastern Anatolia from the single-station Rayleigh wave method and calculated average crustal thickness about 40 km in the Eastern Pondites region. ZOR et al. (2003) investigated crustal structure of the Eastern Anatolian Plateau using receiver functions. They found that an average crustal thickness is 45 km and an average crustal shear velocity is 3.7 km/s for the eastern Anatolian Plateau. Within the Anatolian Plateau they also found evidence of a prominent low velocity zone. GOK et al. (2003) show that upper mantle S-wave (Sn) were not observed in eastern Turkey and obtained that the mantle lithosphere is either very thin or completely absent beneath the region. AL-LAZKI et al. (2004) performed upper-mantle P-wave (Pn) velocities and anisotropy and
Vol. I, Issue II, 2015 Crustal Structure of Eastern Anatolia from Single-Station
59 Rayleigh Wave Group Velocities
observed large scale (~500 km) low Pn velocity structures (<8.0 km/s) underlying the Anatolian Plate. Very low Pn anomalies (<7.8 km/s) at smaller scale (~200 km) are observed in Central Turkey. Crustal and upper mantle seismic discontinuities beneath Eastern Turkey was imaged using S-wave receiver function by ANGUS et al. (2006). They interpreted that moho depth ranges from between 30-55 km and the uppercrustal discontinuity at roughly 10 km depth is likely associated with volcano-sedimentary successions. BEKTAŞ et. al (2007) obtained Curie point depths map of the Eastern Anatolia Region from the low-pass filtered residual magnetic anomaly data and reported curie point depths corresponding to 580°C isotherm related to young ages of volcanics, changed from 15 to 17 km in the Eastern Pontides. ZOR (2008) suggested a shallow, partially molten asthenosphere due to the existence of an upper mantle negative anomaly to a depth of ~200 km beneath the Eastern Anatolia Plateau. GÖK et al. (2011) presented the earth model constrained to a depth of 100 km, which is the crustal and upper
mantle structure of the Anatolian
Plateau‐Caucasus‐Caspian region using waveform data from 31 new broadband stations. According to these data, moho depth was 35 km in the Arabian Plate and increased northward to 54 km at the southern edge of the Greater Caucasus. GÖKALP (2012) performed body wave tomographic inversion technique to explain the upper mantle shear wave velocity structure beneath the Eastern Anatolian Plateau. He obtained widespread low velocity anomalies at varying depths of the upper crust of the region and these low velocities beneath the Eastern
Anatolian Plateau imply the existence of a partially molten asthenospheric material underlying a very thin lithosphere.
The main objective of this study is to utilize single-station fundamental mode Rayleigh wave group velocity inversion method for determining 1-D crustal S-wave velocity structure beneath the Eastern Anatolia from the data of 2011 Van Earthquake mainshock, and its aftershocks recorded at three grouped regional stations.
2.Data and Method
Rayleigh waves disperse thanks to stratification of the crust, changing from initial impulse into an oscillation train with changing time periods. Rayleigh wave group velocity measurement depends mainly on crustal velocity and density structure; and accordingly, the shear wave velocity can be obtained by inversion from Rayleigh wave dispersion curves by adopting an empirical scaling law between compressional velocity, density, and shear velocity (AKI and RICHARDS 1980).
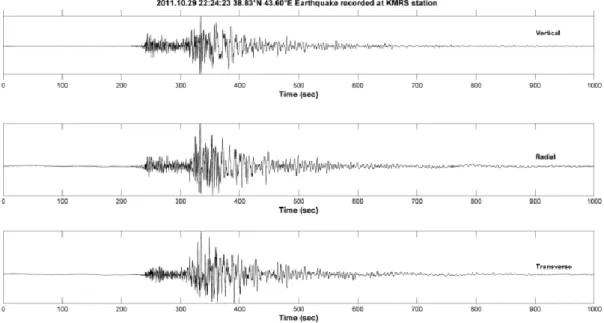
For this study, the vertical component seismograms from 11 earthquakes recorded at KOERI broad-band stations (ERZN, DARE, GAZ, KMRS, RSDY, SARI, SVRC, SVSK, URFA) were analyzed to calculate the 1D shear wave velocity (Figure 1). The source parameters of these events obtained by European Mediterranean Seismological Centre (EMSC) are given in Table 1. Figure 2 shows a sample three component (vertical, radial and transverse) records of the event 7 recorded KMRS station.
Before undergoing the fundamental mode group velocity measurement procedure, the data were demeaned and detrended, and the instrument response was removed from all seismograms. Instrumentally corrected seismograms were time-windowed with apparent group
velocity between the selected maximum (5 km/s) and minimum (2 km/s) velocities. To see the signal-to-noise ratio improvement achieved for particularly low periods, the seismograms were band-pass-filtered from 4 to 40 s with a two-pole and two-way Butterworth filter.
Table 1. List of seismic events and stations considered in this study.
No Date (y/m/d) Origin Time (h/m/s) Latitude (°N) Longitude (°E) Depth (km) Mag (MW) Distance (km) Sta. Code 1 2011-10-23 10:41:23 38.78 43.40 5 7.2 334 587 552 610 360 567 ERZN KMRS RSDY SARI SVRC SVSK 2 2011-10-23 11:32:41 38.82 43.33 17 5.9 510 582 DARE KMRS 3 2011-10-23 18:10:45 38.66 43.17 12 5.1 316 538 405 ERZN RSDY URFA 4 2011-10-23 20:45:37 38.64 43.22 10 6.0 543 556 RSDY SVSK 5 2011-10-25 14:55:08 38.85 43.60 10 5.6 345 567 628 582 448 ERZN KMRS SARI SVSK URFA 6 2011-10-27 08:04:22 38.51 43.83 10 5.1 587 428 DARE SVRC 7 2011-10-29 22:24:23 38.83 43.60 2 5.1 606 KMRS 8 2011-11-08 22:05:50 38.71 43.11 6 5.3 309 561 546 402 ERZN KMRS SVSK URFA 9 2011-11-14 22:08:16 38.75 43.17 10 5.2 496 313 567 549 409 DARE ERZN KMRS SVSK URFA 10 2011-11-18 17:39:40 38.85 43.87 2 5.0 629 KMRS 11 2011-11-30 00:47:23 38.52 43.41 2 5.0 566 583 563 GAZ KMRS RSDY
Vol. I, Issue II, 2015 Crustal Structure of Eastern Anatolia from Single-Station
61 Rayleigh Wave Group Velocities
We used the iterative method implemented by the The Computer Programs in the Seismology (CPS) package version 3.30 (HERRMANN 2013). The multiple filtering “MFT” (DZIEWONSKI et al. 1969) and phase-matched filtering “PMF” (GOFORTH and HERRIN 1979) was employed to isolate the fundamental mode in order to calculate the cleanest group velocity curve. The basis of MFT is the property of a dispersive signal that different frequency components arrive at different times. This method consists in the application of an array of narrow filters to the complex seismic signal. These narrow filters may resolve transient signals composed of several dominant periods that arrive at the recording station almost simultaneously (CONG 1997). After Rayleigh-wave fundamental and higher mode group velocities are determined by MFT, PMF is used to removed the effect of noise and other modes from seismic signal to isolate the fundamental mode. The PMF compresses the waveform into a narrow time window centered near zero time, allowing noise to be windowed out by taking the spectrum of this narrow window rather than the full signal time window. However, the amount of compression depends on how well the phase matched filter matches the actual phase of the signal. The PMF can be used to remove multipathing effects, isolate the fundamental mode and improve the signal-to-noise ratio (PEREZ 2001). For example, Figure 3 displays the typical contoured plots of relative amplitude of wave energy arrivals of earthquake No:1 KMRS station. Figures 3a and 3b show the situation of MFT and PMF. The left part of contoured plots shows the diagram period versus group velocity for fundamental mode Rayleigh wave and the right part shows seismogram. After applying MFT, the PMF method was used for removing multiple arrivals and higher mode interferences to improve the quality of the observed group velocity dispersion (Figure 3b).
The inversion of any group velocity is taken into consideration to obtain the shear velocity model. In order to obtain 1-D plane-layered shear wave velocity structures, we used the same computer program package (surf96) which inverts observed group velocities.
That program inverts observed group velocities for plane-layered shear velocity structures, and uses singular value decomposition (LAWSON and HANSON 1974) in stochastic or differential form (RUSSEL 1987).
The inversion procedure is differential so that it minimizes velocity differences between adjacent layers with certain damping and makes the best fitting between the calculated dispersion curves and the observed ones along with a constraint that keeps the size of the solution vector small (ERDURAN et al. 2007).
The damping factor affects the model converges and the reduction in the standart deviation between observed and predicted values. HERRMANN (1991) suggested beginning the iterative process with a high value of damping, close to the highest eigenvalue and reducing it during the process in order to accelerate the convergence
towards the final solution (MARTINEZ et al. 2001). Therefore, we decrease the damping parameter (with three to five iterations at each value (10, 5, 2, 1, 0.1) until the improvement in misfit is small.
Figure 3. The plot of the group velocity dispersion curve with period is displayed at event 1 recorded KMRS station; the color represents the filtered envelope values as a function of velocity and period. The red color represent the highest amplitude. a) before and b) after MFT and PMF analysis.
The inversion process starts with an initial model, which is constituted, based on the half-space earth model. The good selection of a initial model is very important step before the inversion process. For the initial model, we combined P- and S-wave velocities (km/s) and density (g/cm3) from model Wena1.0 for 46 km depth (Region 13-Eastern Anatolia, Southern Caucasus, PASYANOS et al. 2004) with the global model AK135 (KENNETT et al. 1995) for 47-58 km depth. The initial model consisted of sediment layer, upper, middle and lower crust, uppermost mantle, and mantle half-space. The Wena1.0 and AK135 model were 8 layers with different thickness, but we resampled the these models to have totally 17 layers with the thickness are 1 km for the first 2 km, and increasing depths it included 14 layers with a thickness of 4 km, down to 60 km approximately. Poisson’s ratio is constant for each layer and differential smoothing was used in the inversion. The dispersion information was obtained by the mean difference between the observed and predicted dispersion, the standard error and the L2 norm of the fit
(HERRMANN 2013).
In the inversion, one obtains a smoothed solution, i.e. each model parameter obtained is a weighted mean of the parameters that define the real earth model. In the inversion theory, the resolution matrix connects the set of all possible solutions of the problem with the actual model. Kernels (rows) at various reference depths are usually calculated and plotted to illustrate the quality of the solution, because these are measures of accuracy (CHOURAK et al. 2005). We calculated the normalized statistical resolution matrix, defined by AN (2012), using
a Gaussian approximation, in order to obtain resolution-length information for a total inverse system. The normalized statistical resolution matrix shown in the Fig. 5d, 6d and 7d measures the resolution obtainable from the data. Each row of resolution matrix is a resolution map that defines the contributions of all model parameters to the ith solution parameter (AN 2012). Parameter index i and j are row and column elements of resolution matrix. The red contour marks indicate the half-height position of the Gaussian width, which is taken as the resolution length of the statistical resolution matrix.
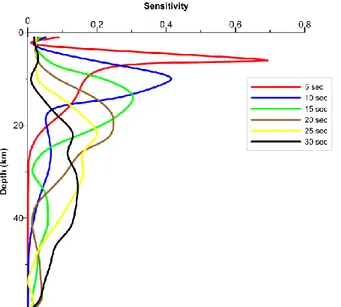
We computed sensitivity kernels of Rayleigh waves to determine how the structure in a certain depth interval influences the group velocities. These functions are the partial derivatives of group velocity with respect to a perturbation of shear wave velocity in the reference model (modified from Wena1.0 and AK135 model) through which they are computed. Fig. 4 shows the sensitivity kernels for Wena1.0 model at a number of periods (5, 10, 15, 20, 25, 30s). Slowly varying sensitivities of Rayleigh waves limit the depth resolution and mask deeper structures. The shallow structures dominate at lower periods and have significant influence at higher periods (CAMBAZ and KARABULUT 2010). Group velocity at 5 s is sensitive to variations of the S-wave velocity at depths smaller than 10 km (absolute sensitivity>0.5). Rayleigh waves at ~15 s mainly sample the upper crust of 10 km thickness. At 20 s period, Rayleigh waves are more sensitive nearly a depth of 20 km and therefore contain the whole crustal information. Intermediate periods (20–35s) sample the crust more uniformly and are influenced by the upper-mantle velocity. We suggest that the Rayleigh waves at 30 s are still sensitive to the uppermost mantle structure.
Figure 4. Sensitvity kernels for Rayleigh waves for shear velocity-depth model modified from Wena1.0 and AK135 model used in this study.
Vol. I, Issue II, 2015 Crustal Structure of Eastern Anatolia from Single-Station
63 Rayleigh Wave Group Velocities
Rayleigh waves propagating along very near epicentre-station paths show quite similar dispersion curves, because the waves cross the same earth structure with the same elastic properties (CORCHETE et al. 2007). Thus, we proceeded to group all the seismic events with similar epicentre coordinates. Considering the selected pairs of the station-event, the wave paths were gathered under three groups: the first group includes 14 paths, the second group includes 7 paths and third group includes 13 paths.
The observed average group velocity curves for the these groups are determined from all individually the observed means and standart deviations, and inverted to obtain the average 1-D shear wave velocity structure. The moment magnitudes (Mw) of the events selected for analysis were the range 5.0–7.2 and epicentral distances varied from 309 to 629 km. Table 1 lists the event
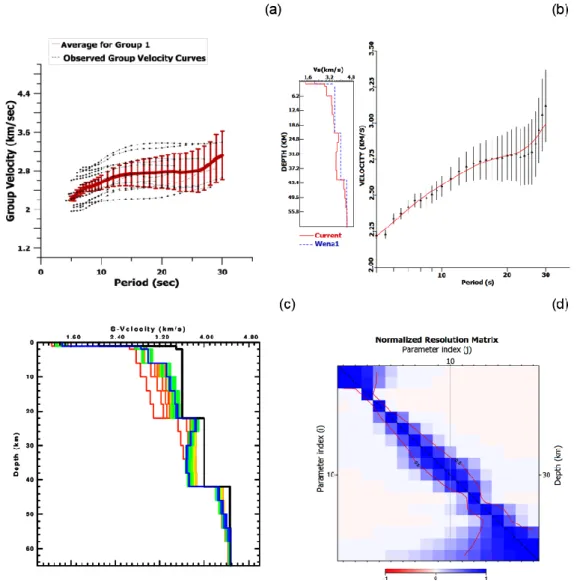
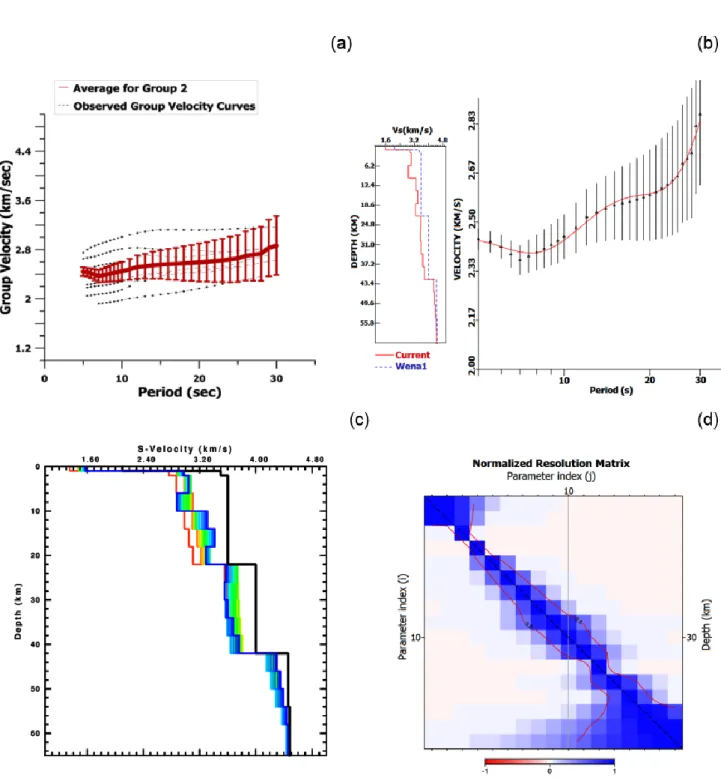
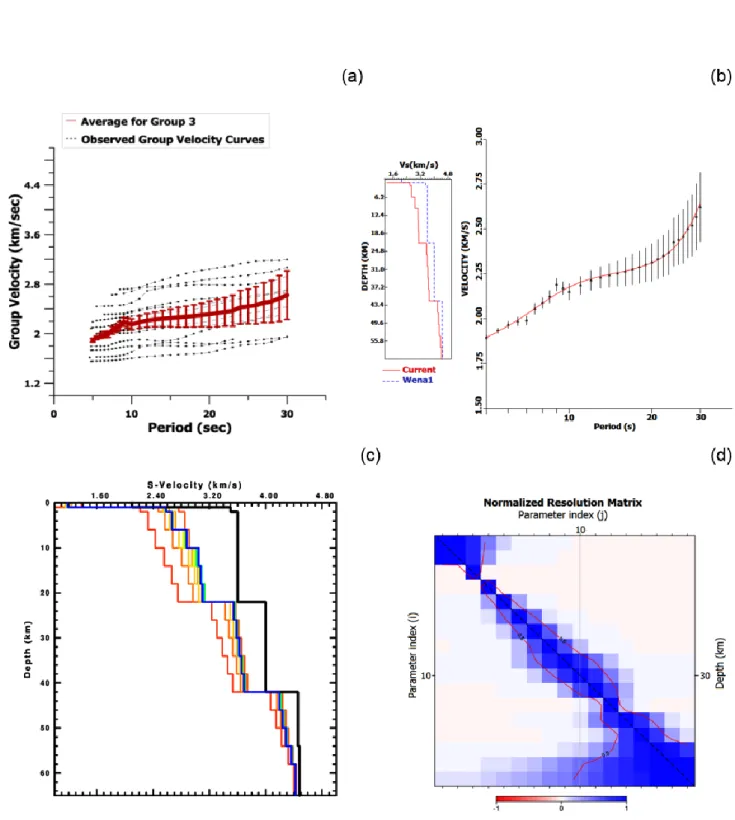
parameters used in the present study. The groups were based on geographical location and stations in the Fig 1. Average group velocity dispersion curves and their inversion results for three groups are shown in Figure 5, 6, and 7, respectively. According to these figures, panel a shows the average group velocity dispersion curve (red solid line) with error bars and observed group velocity curves (black dashed line). Inverted (red solid curve) and average observed (black points) group velocity dispersion curves are shown in the panel b. Each linearized inversion iteration is showed by the coloured lines in the panel c, including initial model (black line) and fitting last model (blue line), varied from red to blue with the iteration number. Panel d in these figures show the normalized statistical resolution matrix to measure the resolution obtainable from the data.
Figure 5. Average group velocity dispersion curve and their inversion result for the Group 1. a) Observed group velocity curves (black dashed curves) and their average (red solid curve) with error bars, b) The blue line is the initial model (modified from Wena1.0 and AK135 model) and red line is current model (left side), and inverted (red solid curve) and average observed (black points) group velocities with error bars (right side), c) 1-D plane-layered shear-wave velocity structure, initial model (black line) and the last model (blue line), d) The normalized statistical resolution matrix based on the blue line in panel c.
Figure 6. Average group velocity dispersion curve and their inversion result for the Group 2. a) Observed group velocity curves (black dashed curves) and their average (red solid curve) with error bars, b) The blue line is the initial model (modified from Wena1.0 and AK135 model) and red line is current model (left side), and inverted (red solid curve) and average observed (black points) group velocities with error bars (right side), c) 1-D plane-layered shear-wave velocity structure, initial model (black line) and the last model (blue line), d) The normalized statistical resolution matrix based on the blue line in panel c.
Vol. I, Issue II, 2015 Crustal Structure of Eastern Anatolia from Single-Station
65 Rayleigh Wave Group Velocities
Figure 7. Average group velocity dispersion curve and their inversion result for the Group 3. a) Observed group velocity curves (black dashed curves) and their average (red solid curve) with error bars, b) The blue line is the initial model (modified from Wena1.0 and AK135 model) and red line is current model (left side), and inverted (red solid curve) and average observed (black points) group velocities with error bars (right side), c) 1-D plane-layered shear-wave velocity structure, initial model (black line) and the last model (blue line), d) The normalized statistical resolution matrix based on the blue line in panel c.
3. Discussion and Conclusions
We analyzed the path-averaged group velocity dispersion characteristics of Rayleigh waves from 11 earthquakes and 34 paths, occurred in Lake Van Basin, with moment magnitude greater than 5.0 to determine the variation of 1-D shear wave velocity with depth beneath the Eastern Anatolia.
The main purpose of the study is to elucidate crustal structure of the region using the single station method to a depth of 60 km approximately. Although wave paths of selected earthquakes were generally close to each other, we divided the data into three groups due to station locations. An average shear wave velocities determined the inversion are shown in Figures 5, 6, and 7.
The average group velocity curve is shown in Fig 5 for 14 paths in the first group whose period range is 5-30 s and group velocity is between 2.2 and 3.2 km/s. This path has an average crustal structure of 42 km. The shear wave velocity (Sn) in the upper mantle reaches
4.34 km/sec at depths 50-55 km. The normalized resolution matrix reveals that the resolution power is greatly diminished after the 15th parameter (~52 km) in the Fig 5d. The average group velocity curve is shown in Fig 6 for 7 paths in the second group whose period range is 5-30 s and group velocity is between 2.5 and 2.9 km/s. The crustal low velocity zone is seen perhaps at roughly 25 km depth. This may be associated with the location of geothermal and Quaternary volcanic centres (ANGUS et
al. 2006). The crust-mantle occurs at about 40 km in the
Fig 6c where there is an increase in velocity 4.30 km/s. Fig 6d is shown that the resolution depth for the upper crust and upper mantle is relatively poor. The average group velocity curve is shown in Fig 7 for 13 paths in the third group whose period range is 5-30 s and group velocity is between 1.9 and 2.7 km/s. Considering to correlation between initial and current model in Fig 7c, the moho discontiunity is 42 km and upper mantle S-wave is approximately 4.36 km/s at depth ~50 km. The normalized resolution matrix reveals that the resolution power is not poor between 3th parameter (6 km) and 15th parameter (~52 km). According to WARREN et al. (2013), there is little sensitivity at 5 km depth for Wena1.0-model. Also, below 5-km depth all structures are not solved because of absent short periods. According to resolution matrix, the spatial resolution lengths increased with the depth.
The continental Rayleigh wave dispersion curves are a minimum at a period of about 20 seconds, which is largely effect of the contrast between the low velocity continental crustal rocks and the high velocity mantle rocks (PRESS et al. 1956). Considering this information, our average group velocity curves are shown entirely
continental character. The shear-wave velocity structures obtained from the inversion for each group are generally similar to one another in terms of crust and upper mantle structures. The average crustal velocities are observed nearly 3.6 km/s in the 36 km. Total crustal thickness suggested from each group is approximately 42 km and it is clearly seen that the upper mantle shear wave velocities vary between 4.2 km/s and 4.3 km/s. TEZEL et al. (2007) found average crustal thickness of about 40 km (Vs=4.2 km/s) for the Eastern Turkey by using surface wave dispersion analysis. GÖK et al. (2011) obtained that shear velocities of the Anatolian Plateau varied from ~3.1-3.2 km/s in the upper crust, ~3.5-3.7 km/s in the lower crust, and ~4.2 km/s in the upper mantle. The moho depth is 35 km in the Arabian Plate and increased northward to 54 km at the southern ede of the Greater Caucasus. ATEŞ et al. (2012) produced the crustal thickness map of Turkey from the gravity anomalies by using an empirical equation, and the crustal thickness map was correlated with previous seismological findings and deep seismic sections. The crustal thickness from the Black Sea to the Arabian Block ranged from 30 to 33 km, and it increased up to 43 km towards the border between Turkey and Iran. TEZEL et al. (2013) studied the Moho depth variation and shear velocity model beneath Turkey by using receiver function technique. The depth of moho and uppermost mantle S-wave velocities were in the range of 38-42 km and 4.2 km/s and 4.3 km/s, respectively. If we take into consideration previous studies (ZOR et al. 2003; ANGUS et al. 2006; GÖK et al. 2011; VANACARO et al. 2013), our crustal parameters are consistent well. Also, the upper mantle S-wave velocities obtained from inversion may be associated with the latest stage of intense volcanism in Eastern Turkey (AL-LAZKI et al. 2004) and subduction created an upwelling of material in the mantle wedge (HEARN and NI 1994). According to shear velocities and moho depth values obtained in this study, it is appropriate with the previous geophysical and geological studies.
REFERENCES
AKI, K., and RICHARDS, P.G. (1980), Quantitative seismology. WH Freeman and Company. San Francisco, pp 259-330.
ALKAN, H., ÇINAR, H., AKKAYA, İ. (2011), Determination of the Crustal Structure in the Eastern Anatolian using Main and After Shocks of the 2011 Van Earthquake, İzmir, TURKEY, 5-7 June.
AL-LAZKI, AI., SANDVOL, E., SEBER, D., BARAZANGI, M., TURKELLI, N., and
Vol. I, Issue II, 2015 Crustal Structure of Eastern Anatolia from Single-Station
67 Rayleigh Wave Group Velocities
MOHAMAD, R. (2004), Pn Tomographic Imaging of Mantle Lid Velocity and Anizotropy at the Junction of the Arabian, Eurasian and African Plates, Geophysical Journal International. 158, 1024-1040.
AN, M., (2012), A simple method for determining the spatial resolution of a general inverse problem, Geophys. J. Int. 191, 849-864.
ANGUS, D.A., WILSON, D.C., SANDVOL, E., and NI, J.F. (2006), Lithospheric structure of the Arabian and Eurasian collision zone in eastern Turkey from S-wave receiver functions, Geophysical Journal International. 166, 1335-1346.
ATEŞ, A., BİLİM, F., BÜYÜKSARAÇ, A., AYDEMİR, A., BEKTAŞ, Ö., and ASLAN, Y. (2012), Crustal Structure of Turkey from Aeromagnetic, Gravity and Deep Seismic Reflection Data, Surv Geophys. 33:869-885.
BAKIRCI, T., YOSHIZAWA, K., and ÖZER, K.M. (2012), Three-dimensional S-wave structure of the upper mantle beneath Turkey from surface wave tomography, Geophys. J. Int. 190:1058-1076.
BARKA, A. and KADINSKY-CADE, K. (1988), Strike-slip fault geometry in Turkey and its influence on earthquake activity, Tectonics. 7:663-684. BAYRAK, Y., ATMIŞ, A., TEMELLİ, F.,
MOHAMMADI, H., BAYRAK, E., YILMAZ, Ş., and TÜRKER, T., (2013), An Evaluation of Earthquake Hazard Parameters in and around Ağrı, Eastern Anatolia, Turkey, Eastern Anatolian Journal of Science. 1: 01-09.
BEKTAŞ, Ö., RAVAT, D., BUYUKSARAC, A., BILIM, F., and ATES, A. (2007), Regional Geothermal Characterisation of East Anatolia from Aeromagnetic, Heat Flow and Gravity Data, Pure appl. Geophysc. 164:975-998.
BIRYOL, C.B., BECK, S.L., ZANDT, G., and ÖZACAR, A.A. (2011), Segmented African lithosphere beneath the Anatolian region inferred from teleseismic P-wave tomography, Geophys. Jour. Int. 184:1037-1057.
CAMBAZ, D.M., and KARABULUT, H. (2010), Love-wave group velocity maps of Turkey surrounding regions,. Geophys. Jour. Int. 181:502-520. CHOURAK, M., CORCHETE, V., BADAL, J., GOMEZ,
F., and SERON, F.J. (2005), Shallow seismic velocity structure of the Baltic Cordillera
(Southern Spain) from modelling of Rayleigh wave dispersion, Surveys in Geophysics. 26:481-504.
CORCHETE, V., CHOURAK, M., and HUSSEIN, H.M. (2007), Shear wave velocity structure of the Sinai Peninsula from Rayleigh Wave Analysis, Surveys in Geophysics. 28, 299-324.
CONG, L., (1997), Lateral Variation of Velocity and Attenuation structure in the Middle East from Surface wave and Lg Coda, Phd thesis, Saint Louis University.
ÇETİNOL, T., and YOSHIZAWA, K. (2007), Surfave Wave Ohase Velocity Distribution of Turkey, International Earthquake symposium, Kocaeli. ÇINAR, H., (1998), Analysis of single station Rayleigh
wave recordings of earthquakes in and around the Eastern Anatolia. PhD thesis (in Turkish with English abstract), Karadeniz Technical University, Institute of Science.
DEWEY, J.F., HEMTON, M.R., KIDD, W.S.F., SAROGLU, F., and ŞENGÖR, A.M.C. (1986), Shortening of continental lithosphere: The neotectonics of Eastern Anatolia—a young collision zone, In COWARD, M. P. and REIS, A. C., (eds), Collision Tectonics, Geology Society of London Special Publication, 19, (R. M. Shackleton Volume), pp. 3-36.
DZIEWONSKI, A., BLOCH, S., and LANDISMAN, M. (1969), A tecnique for the analysis of Transient Seismic Signals, Bulletin of the seismological society of America. Vol. 59, No.1, pp 427-444. ERDURAN, M., ÇAKIR, Ö., TEZEL, T., ŞAHİN, Ş.,
ALPTEKİN, Ö. (2007), Anatolian surface wave evaluated at GEOFON Station ISP Isparta, Turkey, Tectonopysics, 434, 39-54.
GOFORTH, T., and HERRIN, E., (1979), Phase-matched filters: application to study of Love waves, Bulletin of the Seismological of America. 69, 27-44.
GÖK, R., PASYANOS, M.E., and ZOR, E., (2007), Lithospheric structure of the continent–continent collision zone: eastern Turkey, Geophys. J. Int. 169:1079-1088.
GÖK, R., MELLORS, R.J., SANDVOL, E., PASYANOS, M, HAUK, T., TAKEDATSU, R., YETIRMISLI, G., TEOMAN, U., TURKELLI, N., GODOLADZE, T., and JAVAKISHVIRLI, Z. (2011), Lithospheric velocity structure of the
Anatolian plateau‐Caucasus‐Caspian region, Journal of Geophysical Research. VOL. 116, B05303.
GÖKALP, H. (2007), Local earthquake tomography of the Erzincan Basin and the surrounding area in Turkey, Annals of Geophysics. Vol. 50, N:6. GÖKALP, H. (2012), Tomographic Imaging of the
Seismic Structure Beneath the East Anatolian Plateau, Eastern Turkey, Pure and Applied Geophysics. 1691749-1776.
HEARN, T.M., and NI, J.F. (1994), Pn Velocities beneath Continental Collision Zones: the Turkish-Iranian Plateau, Geophysical Journal International. 117, 273-283.
HERRMANN, R.B., (1991). In: Herrmann, R.B. (Ed). Surface Wave Inversion Program. Saint Louis University, Saint Louis, MO.
HERRMANN, R.B. (2013), Computer programs in seismology: An evolving tool for instruction and research, Seism. Res. Lett. 84, 1081-1088. KENNETT, B.L.N., ENGDAHL, E.R. and BULAND, R.,
(1995), Constraints on seismic velocities in the Earth from travel times, Geophys. J. Int. 122, 108-124.
KESKİN, M. (2003), Magma generation by slab steepening and breakoff beneath a subduction accretion complex: an alternative model for collision-related volcanism in Eastern Anatolia, Turkey, Geophysical Research Letters. 30, 8046. LAWSON, C.L., HANSON, R.J., (1974), Solving Least
Squares Problems, Prentice Hall, New Jersey. LEI, J., and ZHAO, D. (2007), Teleseismic evidence for a
break-off subducting slab under Eastern Turkey,
Earth and Planetary Science Letters. 257:14-28. MAGGI, A. and PRIESTLY, K. (2005), Surface
waveform tomography of the Turkish–Iranian plateau, Geophys. J. Int.160:1068-1080.
MARTINEZ, M.D., CANAS, J.A., LANA, X., and BADAL, J. (2001), Objective regionalization of Rayleigh wave dispersion data by clustering algorithms: an aplication to the Mediterranean basin, Tectonophysics. 330, 245-266.
MCCLUSKY, S., BALASSANIAN, S., BARKA, A., DEMİR, C., ERGINTAV, S., GEORGIEV, I., GURKAN, O., HAMBURGER, M., HURST, K., KAHLE, H., KASTENS, K., KEKLIDZE, G., KING, R., KOTZEV, V., LENK, O.,
MAHMOUD, S., MISHIN, A., NADARIYA, M., OUZOUNIS, A., PARADISSIS, D., PETER, Y., PRILEPIN, M., REILINGER, R., SANLI, I., SEEGER, H., TEALEB, A., TOKSÖZ, M.N., and VEIS, G. (2000), GPS constraints on plate kinematics and dynamics in the Eastern Mediterranean and Caucasus, J Geophys Res. 105:5695-5719.
MCCLUSKY, S., REILINGER, R., MAHMOUD, S., BEN-SARI, D., and TEALEB, A. (2003), GPS constraints on Africa (Nubia) and Arabia plate motions, Geophys. J. Int. 155, 126-138.
MINDEVALLI, O.Z. and MITCHELL, B.J. (1989), Crustal structure and possible anisotropy in Turkey from seismic surface wave dispersion, Geoophys. J. Int. 98, 93-106.
MUTLU, A.K. and KARABULUT, H. (2011), Anisotropic Pn tomography of Turkey and adjacent regions, Geophys. Journal International. 187, 1743-1758.
OZACAR, A.A., GILBERT, H., and Zandt, G. (2008), Upper mantle discontinuity structure beneath East Anatolian Plateau (Turkey) from receiver functions, Earth and Planetary Science Letters. 269:427-435.
OZACAR, A.A., ZANDT, G., GILBERT, H., and SUSAN L. BECK, S.L. (2010), Seismic images of crustal variations beneath the East Anatolian Plateau (Turkey) from teleseismic receiver functions, Geological Society, London, Special Publications. 340, 485-496.
REILINGER, R., McCLUSKY, S., VERNANT, P., LAWRANCE, S., ERGİNTAV, S., CAKMAK, R., OZENER, H., KADİROV, F., GULİEV, I.,
STEPANYAN, R., NADARİYA, M.,
HAHUBIA, G., MAHMOUD, S., SAKR, K., ARRAJEHI, A., PARADISSIS, D., AL-AYDRUS, A., PRILEPIN, M., GUSEVA, T., EVREN, E., DMITROTSA, A., FILIKOV, S.V., GOMEZ, F., AL-GHAZZI, R., and, KARAM, G. (2006), GPS constraints on continental deformation in the Africa–Arabia–Eurasia continental collision zone and implications for the dynamics of plate interactions, J Geophys Res. 111:B05411.
PASYANOS, M.E., WALTER, W.R., FLANAGAN,
M.P., GOLDSTEIN, P. and
BHATTACHARYYA, J., (2004), Building and testing an a priori geophysical model for western
Vol. I, Issue II, 2015 Crustal Structure of Eastern Anatolia from Single-Station
69 Rayleigh Wave Group Velocities
Eurasia and north Africa, Pure Appl. Geophys. 161, 235-281.
PEREZ F.L.M, (2001), Surface wave dispersion about the New Madrid Region, MsC thesis, Saint Louis University.
PRESS, F., EWING, M., OLIVER, J. (1956), Crustal Structure and Surface-wave Dispersion in Africa, Bull. Seism. Soc. Am. 46, 97-103.
RUSSEL, D.R. (1987), Multi-channel processing of dispersed surface waves, PhD dissertation, St Louis University, MO.
SANDVOL, E., SEBER, D., CALVERT, A., and BARAZANGİ, M., (1998). Grid search modeling of receiver functions: Implications for crustal structure in the Middle East and North Africa, Journal of Geophysical Research. 103:899-917.
SAYIL, N. (2015), Determination of the Crust and Upper-Mantle Structure in Anatolia by Surface Wave Data, Natural Science. 6, 968-977.
STEIN, R.S., BARKA, A.A., and DIETERICH, J.H., (1997), Progressive failure on the North Anatolian fault since 1939 by earthquake stress triggering, Geophys. J. Int. 128, 594-604. ŞENGÖR, A.M.C., and KIDD, W.S.K. (1979), The
post-collisional tectonics of the Turkish–Iranian Plateau and a comparison with Tibet, Tectonophysics. 55, 361-376.
ŞENGÖR, A.M.C. and YILMAZ, Y. (1981), Tethyan evolution of Turkey: a plate tectonic approach, Tectonophysics. 75, 181-241.
ŞENGÖR A.M.C., GÖRÜR N., and ŞAROĞLU, F. (1985), Strike-slip faulting and related basin formation in zones of tectonic escape: Turkey as a case study, Spec Publ Soc Econ Paleontol Mineral. 37, 227–264.
TAYMAZ, T., JACKSON, J.A., and WESTAWEY, R. (1990), Earthquake mechanism in the Hellenic Trench near Crete, Geophys. J. Int. 102, 695– 731.
TAYMAZ, T., YILMAZ, Y., and DILEK, Y. (2007), The Geodynamics of the Aegean and Anatolia, Geol. Soc. London, Special Publications. 291, 1-16. TEZEL, T., ERDURAN, M., and ALPTEKİN, Ö. (2007),
Crustal shear wave velocity structure of Turkey by surface wave dispersion analysis, Annals of Geophyscis. 50:177-190.
TEZEL, T., SHIBUTANI, T. and KAYPAK, B. (2013), Crustal thickness of Turkey determined by receiver function, Journal of Asian Earth Sciences. 75, 36-45.
TURKELLI, N., SANDVOL, E., ZOR, E., GOK, R., BEKLER, T., AL-LAZKI, A., KARABULUT, H., KULELI, S., EKEN, T., GURBUZ, C., BAYRAKTUTAN, S., SEBER, D., and BARAZANGI, M. (2003), Seismogenic zones in Eastern Turkey, Geophysical Research Letters. 30, 8039.
UTKUCU, M. (2013), 23 October 2011 Van, Eastern Anatolia, earthquake (Mw 7.1) and seismotectonics of Lake Van area, J Seismol. 17, 783-805.
VANACORE, E.A., TAYMAZ, T., and SAYGIN, E. (2013), Moho structure of the Anatolian Plate from receiver function analysis, Geophys. J. Int. 193, 329-337.
WARREN, M. L., BECK, S.L., BIRYOL, C.B., ZANDT, G., OZACAR, A.A., and YANG, Y. (2013), Crustal velocity structure of Central and Eastern Turkey from ambient noise tomography, Geophys. J. Int. 194:1941-1954.
ZOR, E., SANDVOL, E., GURBUZ, C., TURKELLİ, N., SEBER, D., and BARAZANGI, M. (2003), The crustal structure of the East Anatolian plateau (Turkey) from receiver functions, Geophys. Res. Lett. 30(24), 8044.
ZOR, E. (2008), Tomographic evidence of slab detachment beneath eastern Turkey and the Caucasus, Geophys. J. Int. 175, 1273-1282.