Deepkinzero: zero-shot learning for predicting kinase phosphorylation sites
Tam metin
Şekil
![Figure 2.2: Classification of kinases according to the ENZYME database [1].](https://thumb-eu.123doks.com/thumbv2/9libnet/5661226.113105/21.918.211.754.185.575/figure-classification-kinases-according-enzyme-database.webp)
![Figure 2.3: The partitioning of kinases into families and groups as pro- pro-posed in [2]](https://thumb-eu.123doks.com/thumbv2/9libnet/5661226.113105/22.918.183.842.222.917/figure-partitioning-kinases-families-groups-pro-pro-posed.webp)

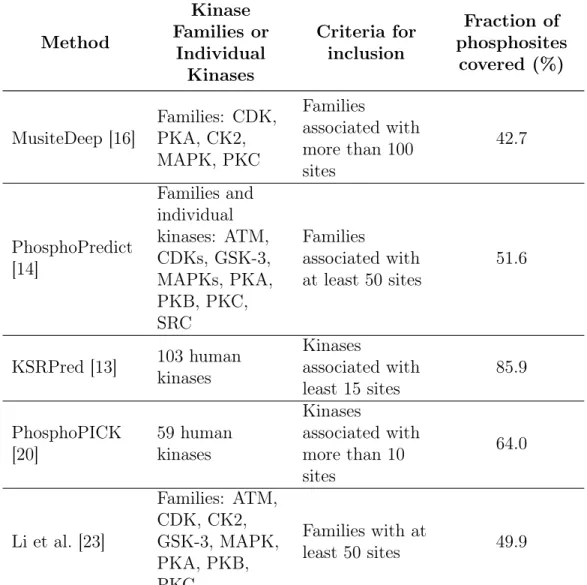
![Table 3.1: Classification of amino acids(AA) based on five different physiochemical amino acid properties as in [3].](https://thumb-eu.123doks.com/thumbv2/9libnet/5661226.113105/33.918.166.800.172.664/table-classification-amino-acids-based-different-physiochemical-properties.webp)
Benzer Belgeler
As we will show below, the effect of resistive loss is to give a bit-rate capacity for a given line that is proportional to the cross-sectional area and inversely proportional to
Here, we demonstrate an all-fiber Yb-doped laser based on a SWNT saturable absorber, which allows generation of 8.7 ps-long pulses, externally compressed to 118 fs.. To the best of
obtained from the Raman spectra suggest that under a bias voltage, the Fermi energy of the top and the bottom graphene electrodes are di fferent owing to the asymmetric doping
As QDs emission in samples E and F is quite similar, we reported here only the behavior of sample F in order to exhibit good spectral overlapping with NPs plasmon bands,
İlk fahriye örneklerinin şairin kendisini övmesinden çok, övdüğü kişiden yardım taleb etmesi şeklinde olması, fahriyelerin neden medhiye kasidelerinde daha çok
Yapay Sinir Ağlarının mevcut olan bu avantajlarından yola çıkarak hazırlanan çalışmamızda Petkim’de üretilmekte olan dört ürüne ilişkin öngörümlemede
lıca öğretim üyelerini yetiştirmiş olan bir mimarlık bölümünü, di ğer taraftan heykel, resim ve de koratif san’atlar alanında memle ket içinde ve
Dava dosyasının incelenmesinden; Kırıkkale ili, Bahşili ilçesi, Barbaros İlkokulunda müdür olarak görev yapan davacının dava konusu Yönetmelik eki "Görev Süreleri
