SOLAR PHOTOVOLTAIC SYSTEM DESIGN FOR
RENEWABLE ENERGY HARVESTING
2020
MASTERS THESIS
ELECTRICAL & ELECTRONICS ENGINEERING
SOLAR PHOTOVOLTAIC SYSTEM DESIGN FOR RENEWABLE ENERGY HARVESTING
Sumair MASHRAF
T.C
Karabuk University Institute of Graduate Programs
Department of Electrical & Electronics Engineering Prepared as
Masters Thesis
KARABUK July 2020
ii
THESIS APPROVAL PAGE
I certify that in my opinion the thesis submitted by Sumair MASHRAF titled “SOLAR PHOTOVOLTAIC SYSTEM DESIGN FOR RENEWABLE ENERGY HARVESTING” is fully adequate in scope and in quality as a thesis for the degree of Master of Science.
Prof. Dr. İhsan ULUER ...
Thesis Advisor, Department of Electrical & Electronics Engineering
KABUL
This thesis is accepted by the examining committee with a unanimous vote in the Department of Electrical & Electronics Engineering as a master thesis. July 9, 2020
Examining Committee Members (Institutions) Signature
Chairman : Prof. Dr. İhsan ULUER (KBU) ...
Member : Assoc. Prof.Turgut ÖZTÜRK (BTU) ...
Member : Assoc. Prof.M. Tahir GÜNEŞER (KBU) ...
The degree of Master of Science by the thesis submitted is approved by the Administrative Board of the Institute of Graduate Programs, Karabuk University.
Prof. Dr. Hasan SOLMAZ ...
iii
“I declare that all the information within this thesis has been gathered and presented in accordance with academic regulations and ethical principles and I have according to the requirements of these regulations and principles cited all those which do not originate in this work as well.”
iv ABSTRACT
M. Sc. Thesis
SOLAR PHOTOVOLTAIC SYSTEM DESIGN FOR RENEWABLE ENERGY HARVESTING
Sumair Mashraf
Karabük University Institute of Graduate Programs
The Department of Electrical and Electronics Engineering
Thesis Advisor: Prof. Dr. İhsan ULUER
July 2020, 69 pages
The maximum power acquired from a solar photovoltaic system differs because of the variety in the barometrical condition. Maximum Power Point Tracking (MPPT) controller is executed to follow the most extreme power as for the adjustments in the climate conditions to proficiently work the solar Photovoltaic (PV) system.
In our thesis, initially we have designed Ground PV Panel system using the Sketchup Pro and AutoCAD software. In the second part of our thesis, we have designed PV system with Perturbation and Observation (P&O) MPPT Algorithm using MATLAB software. The exhibition investigation of independent sunlight based PV system is done under different climate conditions. Buck-Boost converter is embraced as power conditioning unit.
Key Words : Maximum Power Point Tracking (MPPT); Photovoltaic (PV); Perturb and Observe (P&O); AUTOCAD; MATLAB.
v ÖZET
Yüksek Lisans Tezi
YENİLENEBİLİR ENERJİ HASARLARI İÇİN GÜNEŞ FOTOVOLTAİK SİSTEM TASARIMI
Sumair Mashraf
Karabük Üniversitesi Lisansüstü Programlar Enstitüsü
Elektrik ve Elektronik Mühendisliği Anabilim Dalı
Tez Danışmanı: Prof. Dr. İhsan ULUER
Temmuz 2020, 69 sayfa
Bir güneş fotovoltaik sisteminden elde edilen maksimum güç, barometrik durumdaki çeşitlilik nedeniyle farklılık gösterir. Maksimum Güç Noktası İzleme (MPPT) denetleyicisi, güneş fotovoltaik (PV) sistemini verimli bir şekilde çalıştırmak için iklim koşullarındaki ayarlamalarda olduğu gibi en uç gücü izlemek için yürütülür. Tezimizde başlangıçta Sketchup Pro ve AutoCAD yazılımını kullanarak Ground PV Panel sistemini tasarladık. Tezimizin ikinci bölümünde MATLAB yazılımını kullanarak Pertürbasyon ve Gözlem (P&O) MPPT Algoritması ile PV sistemi tasarladık. Bağımsız güneş ışığına dayalı PV sisteminin sergi incelemesi farklı iklim koşullarında yapılır. Buck-Boost dönüştürücü güç koşullandırma ünitesi olarak benimsenmiştir.
Anahtar Kelimeler : Maksimum Güç Noktası İzleme (MPPT); Fotovoltaik (PV); Perturb ve Gözlem (P&O); AUTOCAD; MATLAB.
vi
ACKNOWLEDGMENT
First of all, I would like to give thanks to my advisor, Prof. Dr. İhsan ULUER and Assoc. Prof. M. Tahir GUNESER, for his great interest and assistance in preparation of this thesis.
vii CONTENTS
Page APPROVAL ... Error! Bookmark not defined.
ABSTRACT ... iv ÖZET ... v ACKNOWLEDGMENT ... vi CONTENTS ... vii LIST OF FIGURES ... x LIST OF TABLES ... xi PART 1... 1 INTRODUCTION ... 1
1.1.THE IMPORTANCE OF RENEWABLE ENERGY ... 1
1.2.VARIABLE SOURCES OF RENEWABLE ENERGY ... 1
1.2.1.Wind Power ... 1 1.2.2.Small Hydropower ... 2 1.2.3.Biomass ... 3 1.2.4.Geothermal ... 3 1.2.5.Solar power ... 4 PART 2... 5 LITERATURE REVIEW ... 5 PART 3... 7 THEORETICAL BACKGROUND ... 7 3.1. VARIOUS MPPT TECHNIQUES ... 7
3.2. PERTURB & OBSERVE ... 7
viii Page PART 4... 9 DESIGN METHODOLOGY ... 9 4.1. PV MODULE ... 9 4.2.PV ARRAY ... 9 4.3. PV MODELLING ...10
4.4. DESIGNING OF THE GROUND PV PANEL SYSTEM ...12
4.4.1. Google earth selected area on which pv panel solar system are installed information: ...12
4.4.2. Ground panel angle calculations ...13
4.4.3.Ground pv panel solar energy system overall power generation ...14
4.5.SKETCHUP MODEL OF GROUND PHOTOVOLTAIC SYSTEM ...15
4.6.AUTOCAD MODEL OF GROUND PHOTOVOLTAIC SYSTEM ...20
4.7. MATLAB SIMULINK MODEL OF PHOTOVOLTAIC CELL ...23
4.7.1.Solar PV Panel block ...23
4.7.2.Buck-boost converter block ...31
4.7.3. Perturb and observation block ...38
4.7.4.Resistance block...40
4.7.5.Output power block ...42
4.7.6.Demux block ...45
4.7.7.Scope ...46
4.7.8.Powergui ...46
PART 5...48
SUMMARY ...48
5.1. RESULTS & DISCUSSION ...48
5.5.1.Result of sketchup model of ground photovoltaic panel system ...48
5.5.2.Result of Autocad model of ground photovoltaic panel system ...51
5.5.3. Simulation result of Matlab model of ground photovoltaic panel system with Maximum power point tracking controller ...54
ix
REFERENCES ...56
x
LIST OF FIGURES
Page
Figure 1.1. Wind power plant . ... 2
Figure 1.2. Small Hydro generator - Susasca, Switzerland. ... 2
Figure 1.3. Geothermal Energy. ... 3
Figure 1.4. Solar Power plant ... 4
Figure 3.1. Solar Panel Characteristics Showing MPP And Operating Points A and B………..8
Figure 3.2. Flowchart Of Perturb & Observe Algorithm. ... 8
Figure 4.1. Solar Modules ... 9
Figure 4.2. Schematic Cross-Section of a Solar Cell. ...10
Figure 4.3. Equivalent Circuit of PV Cell. ...10
Figure 4.4. 41 ˚ 15 ʹ 38 ” N , 32 ˚ 41 ' 47 “ E , Height 530 m, Project application area = 6510 m Karabuk/Safranbolu ( Besides Bartin Karabuk yolu Road) Map ...12
Figure 4.5. Karabuk/Safranbolu ( Besides Bartin Karabuk yolu Road ) Average temperature per month & Average days with precipitation per month. ...13
xi
LIST OF TABLES
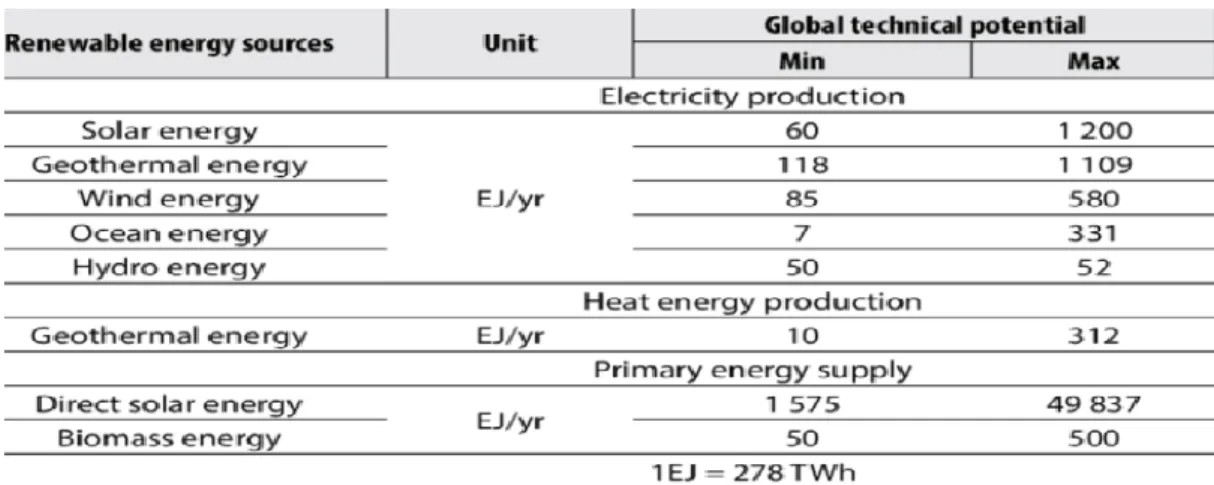
Page Table 1.1. Comparison of global yearly technical potentials of renewable energy sources. ... 4 Table 3.1. Comparison of various MPPT Techniques. ... 7
PART 1
INTRODUCTION
It's positively evident those petroleum derivatives are mutilating the atmosphere and that existing conditions is unsustainable. There is currently an expansive logical agreement that the world needs to lessen ozone harming substance outflows in excess of 25 percent by 2020 - and in excess of 80 percent by 2050.
Sunlight based power, a clean sustainable asset with zero discharge, has enormous capability of energy which can be bridled utilizing an assortment of gadgets. With ongoing advancements, solar systems are effectively accessible for mechanical and household use with the additional favorable position of least upkeep.
1.1
THE IMPORTANCE OF RENEWABLEENERGYIt is the energy which originates naturally, for example, sunlight, wind etc. It is sustainable and could be normally renewed. In this manner, for every single functional reason, these assets can be viewed as limitless, in contrast to waning regular non-renewable energy sources. Aside from the quickly diminishing stores of renewable energy sources on the planet, another central point neutralizing non-renewable energy sources is the contamination related with their burning. Contrastingly, sustainable power destructs impacts of contamination dissimilar to their customary partners.
1.2
VARIABLE MEANS OF RENEWABLE ENERGY 1.2.1 WINDPOWERTurbines are utilized for bridle the energy accessible of wind streams. Presently, turbines extend from 600 kW to 5 MW evaluated control. Because the power output being of solid shape of breeze speed, it increments quickly through an expansion of
accessible breeze speed. Ongoing headways have prompted aero foil wind turbines, which are progressively proficient because of a superior streamlined structure.
Fig. 1.1 Wind power plant station
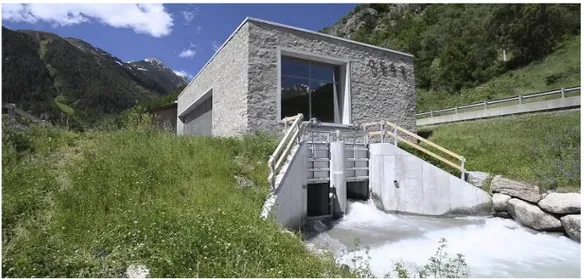
1.2.2 SMALL HYDROPOWER
Hydel power generates to a maximum of 10MW. These include changing over the water potential energy put away in dams into usable electrical energy using turbines. Stream hydel electricity intends to use the dynamic water energy without need of structure supplies.
1.2.3 BIOMASS
Plants catch solar energy by the procedure of photosynthesis. On combustion, these plants release caught energy. Thusly, biomass functions as characteristic battery to store solar energy and output when necessary.
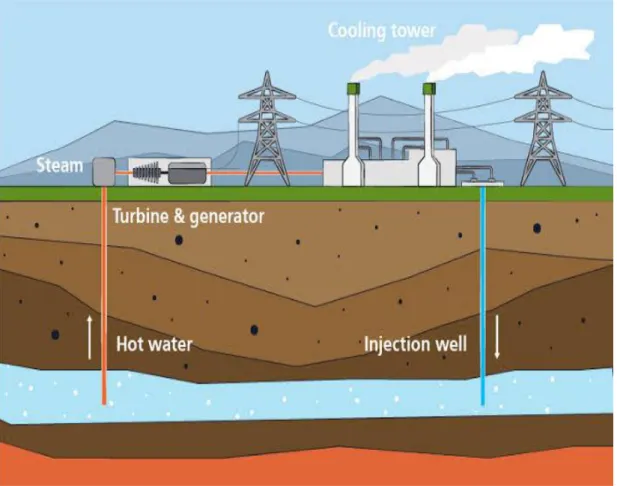
1.2.4 GEOTHERMAL
It is warm energy which is created and put away into layers of the earth. The gradient accordingly create offers ascend to consistent conduction of warmth from center to earth’s outside. This inclination can be used to warm water to deliver superheated steam and use it to run steam turbines to produce power. The fundamental detriment of it is generally constrained to locales close structural limits, however late progressions have prompted the proliferation of this innovation.
1.2.5 SOLAR POWER
In this thesis, initially we have designed Ground PV Panel system using the AutoCAD and Sketchup Pro software. In the second part of our thesis, we have designed PV system with Perturbation and Observation (P&O) MPPT Algorithm using MATLAB software.
Exhibition investigation of independent sunlight based PV system is done under different climate conditions. Buck-Boost converter is embraced as power conditioning unit.
Fig. 1.4 Solar Power plant
Table 1.1 Comparison of global yearly technical potentials of renewable energy sources.
PART 2
LITERATURE REVIEW
This thesis introduces an extraordinary well-ordered system for designing Ground PV Panel system using the AutoCAD and Sketch up Pro software and also designing PV system with Perturbation and Observation (P&O) MPPT Algorithm using MATLAB software. [1].
The plan of PV system utilizing straightforward circuit model with definite circuit demonstrating of PV module is exhibited through AutoCAD and Sketch up Pro software. In this thesis, Equivalent circuit of the PV module with Maximum power point tracking (MPPT) controller and Simulink model of every condition has exhibited and complete circuit arranged model has additionally introduced [2].
In this thesis, series of AutoCAD, Sketchup Pro and MATLAB/Simulink. The created model is incorporated with Buck-boost converter with closed loop control of most extreme power point following (MPPT) calculation. Recreation results are approved with the test. [3].
In this thesis, we have designed Safranbolu (Besides Bartin Karabuk Yolu Road) solar energy system using Sketch up Pro software and also solar energy system connection diagram using AutoCAD Software. Our PV module consists of approximately 400 KW installed power in it. The main purpose of the GROUND PV PANEL system is to provide electricity production by utilizing solar energy and to supply this electricity to certain parts of the region in a healthy way.
This proposition displays the structure and utilization of Buck-Boost converter for sun based filled HBLED lighting framework. The proposed framework includes daylight based photovoltaic module, a shut circle buck-help converter. The shut circle buck-help converter is used to change over a low measurement dc input voltage from PV module to a strange state dc voltage required for the pile. To coordinate the yield of the converter, shut circle voltage criticism strategy is used. The criticism voltage is differentiated and a reference voltage and a control signal is made and strengthened. The reenactment considers are finished in MULTISIM.
The exploratory results for sun based PV and buck-help converter procured in programming and hardware was presented in this proposition [4].
A Simulation model for generation of single sun oriented cell and two sun based cells in arrangement has been made using Simelectronics (MATLAB/Simulink) condition and was shown in this theory. Sun based cell square is available in simelectronics, with various plots. The effect of assortment of boundaries, for instance, arrangement obstruction Rs, shunt opposition Rsh, diode boundaries: diode submersion current, Is and ideality factor, N are seen a lone sun powered cell. Effect of biological boundaries of temperature assortments could in like manner be seen from duplicated qualities. MATLAB coding has been done to find the most extreme force yield Pm, and voltage at greatest force yield, Vm, of a singular sun based cell and two daylight based cells (in arrangement) under different estimations of boundaries [5]
PART 3
THEORETICAL BACKGROUND
MAXIMUM POWER POINT TRACKING ALGORITHM
3.1 VARIOUS MPPT TECHNIQUES
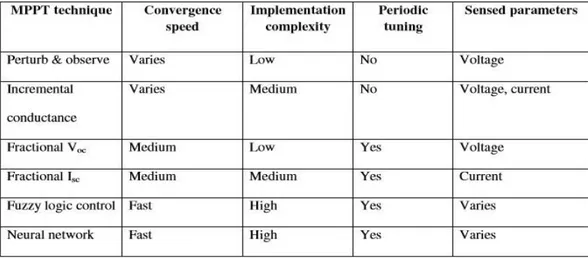
For tracking the maximum power point the various techniques are:
1) Perturb and Observe
2) Incremental Conductance method
3) Fractional short circuit current
4) Fractional open circuit voltage
5) Neural networks
6) Fuzzy logic
3.2 PERTURB & OBSERVE
3.3 PERTURB & OBSERVE ALGORITHM
The Perturb and Observe count communicates when working voltage of photovoltaic board is irritated via little expansion, if the ensuing change in power P is sure that we are leading toward MPP and we keep bothering a comparable way. In case P is negative, we are descending from the course of MPP and the sign of trouble gave should be transformed.
Fig. 3.1 Sun based Panel Characteristics MPP
PART 4
DESIGN METHODOLOGY
DESIGN OF GROUND PHOTOVOLTAIC SYSTEM AND PHOTOVOLTAIC SYSTEM WITH MAXIMUM POWER POINT TRACKING CONTROLLER
4.1 PVMODULE
Normally various PV modules are orchestrated in series and parallel to meet the energy prerequisites. They are of various sizes are industrially accessible (for the most part estimated between 60W-170W.
4.2 PVARRAY
It comprises of a few PV cells in series and parallel associations. Series connections are in charge of expanding the voltage of the module though the parallel connections is in charge of expanding the current.
4.3 PV MODELLING
Fig.4.2 Schematic Cross-Section of a Solar Cell
Fig.4.3 PV Cell Equivalent Circuit
The current source Ipv - cell photo current, Rsh and Rs- intrinsic series and shunt
resistance of the cell.
Module Photo Current
Module Reverse Saturation Current
Module Saturation Current
The Current Output of PV module is
Where
Vpv- output voltage PV module (V)
Ipv - output current PV module (A)
Tr - reference temperature
T - Module operating temperature in Kelvin
Iph - Light generated current in a PV module (A) Io
is the PV module saturation current (A)
A = B is ideality factor = 1.6
K - Boltzmann constant = 1.3805 × 10⁻²³ J/K q - Electron charge = 1.6 × 10⁻¹⁹ C
Rs - Series resistance of a PV module
ISCr - PV module short-circuit current at 25 oC and
1000W/m2 = 2.55
Ki - short-circuit current temperature co-efficient at ISCr
= 0.0017A / oC
λ - PV module illumination (W/m2) = 1000W/m2
Ego - band gap for silicon = 1.1 Ev
Ns - number of cells connected in series
4.4 DESIGNING OF THE GROUND PV PANEL SYSTEM
We have designed Safranbolu (Besides Bartin Karabuk Yolu Road) solar energy system. Our PV module consists of approximately 050 KW installed power in it. This System has an annual approximation of 606, 85MWH that produces large solar energy. The main purpose of the GROUND PV PANEL system is to provide electricity production by utilizing solar energy and to supply this electricity to certain parts of the region in a healthy way.
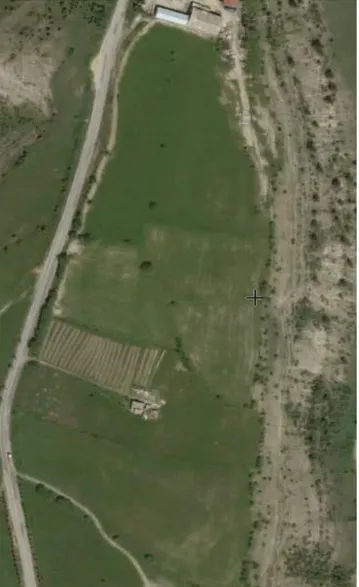
4.4.1 GOOGLE EARTH SELECTED AREA ON WHICH PV PANEL SOLAR SYSTEM ARE INSTALLED INFORMATION:
Fig. 4.4 41 ˚ 15 ʹ 38 ” N , 32 ˚ 41 ' 47 “ E , Height 530 m, Project application area = 6510 m Karabuk/Safranbolu ( Besides Bartin Karabuk yolu Road) Map
4.4.2 GROUND PANEL ANGLE CALCULATION:
We consider our latitude angle equal to direct panel angle (41 ˚). Lattitude angle=Panel angle=41 ˚
The formula of latitude angle (α) for the entire year, α=(0.75 ×lattitude angle)+3
α=(0.75 ×41)+3≅33
Fig.4.5 Karabuk/Safranbolu (Besides BartinKarabukyolu Road) Average temperature per month & Average days with precipitation per month
4.4.3 GROUND PV PANEL SOLAR ENERGY SYSTEM OVERALL POWER GENERATION:
Total PV Modules in the project = 1247 PV Modules
Installed Power Account: Pmax=Vmp ×Imp
For single module: P max = 37 V ×8.7 A=321.9W
Installed power for all my site: 1247 × 321.9W=401409.3 W
Shadow Length:
L=H/tanα
α=Ground Panel Angle H= Height of the obstruction
As our location does not have any obstruction, H will be the overall height of the solar panel. We have chosen Canadian solar polycrystalline pv panel for our design whose dimensions are 1.651m x 1m x 0.039 m respectively.
Now, in software design we have adjoined 3 solar panels together forming an array.
We know breadth of each solar panel
Thus total breadth b= 1m,
Joining 3 solar panels, Total breadth B= 3m,
Now to calculate H,
We have Sin (33) = H/3, H=3 x Sin(33)= 1.639m,
From above Ground Panel angel calculations we have,
α=33 and θ= 41 ˚.
L=H/tanα
L=1.639/ (tan (33))
L=2.52m
Thus, the distance between two solar panels in our design is 2.52m.
4.5 SKETCHUP MODEL OF GROUND PHOTOVOLTAIC SYSTEM
Step 1: Open Sketch up pro software and Click on file > Geo-location.. Click on Geo-location> Add location. Then, the software opens up Google earth, thus from it we choose the region we would like to establish ground PV panel system. In our case, we have chosen Safranbolu (Besides Bartin Karabuk Yolu Road).
Step 2: After choosing the area we draw required shape faces from corner to corner on our location and also we design boundaries to our PV Panel system using drawing tools> Polygon in the software and choose our required shape. In our case, we have chosen the following polygon face and highlighted our polygon face’s ground that is to be covered the solar panel in GREEN Color and the boundaries to our system in BROWN color using respectively.
Step 3: Nextly, to add solar panels with slope. We select tray block in sketchup pro Tray> then we choose Components, Components> we search for Solar arrays.
Step 4: In tray block, we have Shadows block. Thus by analyzing the shadow length of one solar panel array as shown. We make a ground PV panel system by an arrangement of 1247 modules in similar manner.
Step 5: After making the desired solar panel arrangement, we then using the drawing tool create a AC Box in order to show in the model that the solar PV Panels convert the given solar energy and supply the electrical energy to inverters and finally to the AC box placed as shown and place it accordingly.
Step 6: Thus, we have finally made a sketch up of our Ground solar PV Panel system.
Step 7: Using the shadow tool in Tray block of Sketch up pro, we then can analyze the solar energy that falls on our Ground PV panel system at any month and at any time of the day. For example, let us analyze solar energy that falls on our solar panel on March 22, 2019 at 10 AM, 12 PM, 4 PM.
4.6 AUTOCAD MODEL OF GROUND PHOTOVOLTAIC SYSTEM Step 1: After we obtain the resultant model of our ground PV panel system, we make the AutoCAD modeling of our system to study and understand the electrical connections for the components of our system. Open AutoCAD, select Line block and create the outline face of our PV Panel system.
Step 2: Using the same line block create a single solar array, add colors to them as shown. As we have larger number of solar modules, we divide our solar panels arrays as A, B, C and D.
Step 3: Now we create a module array and add the inverters to our solar arrays and make the connections between the Inverter and the solar arrays as shown. By selecting Insert > POWERONE27.6. Totally we create 17 inverters.
Step 4: After the inverters are connected to the solar panel we create a AC Box by selecting Rectangle and renaming it and finally make connections between the Inverters to the AC Box.
Step 5: Thus the resultant Interconnection model of our Ground PV panel system in AutoCAD is modeled.
4.7 MATLAB SIMULINK MODEL OF PHOTOVOLTAICCELL 4.7.1 SOLAR PV PANEL BLOCK
Step 1: We add a Solar PV Panel subsystem block from Simulink Library > Subsystem.
Step 2: Inside Solar PV Panel subsystem block, We add a MATLAB Function file from Simulink Library >Matlab function (PV Module ).
Step 3: Write the following program in the PV Module MATLAB function file.
% Solar Panel Simulation Model
function I = Iphoton(V, G, T)
% I - output current (ampere)
% V - output voltage (volt)
% G - operating solar irradiation (kW m-2)
% T - operating temperature (C)
% k - bolzmann's constant (J/K or m2 kg s-2 K-1)
% q - electron charge (coulomb)
% n - ideal factor dependent of the PV characteristics
% ki - short-circuit current temperature coefficient (A/K)
% Eg - band gap energy of semiconductor used in a cell (eV)
% Ns - number of cell in series
% Np - number of cell in parallel
% Tr - reference temperature at STC (K)
% Iph - photo current (ampere)
% Isc - short circuit current (ampere)
% Is - cell saturation current (ampere)
% Ir - cell reverse saturation current (ampere)
% Rs - Series Resistance (ohm)
% Rsh - Shunt Resistance (ohm), here it is inf
k = 1.3806488e-23;
q = 1.6021766e-19;
n = 1.3; % 1.3 for poly crystalline solar cell (1<n<2)
ki = 1.33e-3; % 0.065A/C Eg = 1.12; % Si-1.12, GaAs-1.42 Ns = 10; Np=6; Tr = 273.15+25; % 25C 0C=273.15K Voc = 37.51/Ns; Isc = 8.63/Np; Tk = 273.15+T; Vc = V/Ns; Vt = (n*k*Tr) / q; Vta = (n*k*Tk) / q; b = (Eg*q) /(n*k);
Iss = Isc * (1 + (ki * (Tk - Tr)));
% photo current at operating irradiation
Iph = G * Iss;
% Io
Ir = Isc / (exp(Voc / Vt) -1);
Is = Ir * (Tk/Tr)^(3/n) * exp(b * (1/Tr - 1/Tk));
% calculation for Rs using slope of I-V curve
dVdI = -2.0/Ns; % Take dV/dI at Voc from I-V curve of datasheet
Xv = Ir / Vt * exp(Voc / Vt);
Rs = - dVdI - 1/Xv;
% I = Iph - Is * (exp((Vc + I * Rs) / Vta) -1)
% f(I) = Iph - I - Is * ( exp((Vc + I * Rs) / Vta) -1) = 0
% Solve for I by Newton's method: Ia2 = Ia1 - f(Ia1)/f'(Ia1)
% Initialize I with zeros
I = zeros(size(Vc));
for j=1:5;
I = I - (Iph - I - Is .* ( exp((Vc + I .* Rs) ./ Vta) -1))...
./ (-1 - Is * (Rs ./ Vta) .* exp((Vc + I .* Rs) ./ Vta));
end
I=I*Np;
Step 4: We add a Step radiation to our PV module from Simulink Library file > Step and give the following parameters to our radiation block.
Step 5: We add a constant temperature block from Simulink Library file > Constant and give the following parameters to our temperature block.
Step 6: We add a Controlled Current Source from Simulink library file > Controlled Current Source give the following parameters to our Controlled Current Source block.
Step 7: We add a Diode block from Simulink Library file > Diode and give the following parameters to our diode block.
Step 8: We add a Voltage measurement block from Simulink Library file > voltage measurement gives the following parameters to our voltage measurement block.
Step 9: We add a PMC Port from Simulink Library file >PMC_port and give the following parameters to our PMC port block.
Step 10: Following Step 8, we add a similar PMC Port 2 and connect as shown.
Step 11: We add a Mux block from Simulink Library file > Mux as shown and give the following parameters to our mux block.
Step12: We add an Outport block from Simulink Library file >Outport and we give the following parameters to our Outport block.
4.7.2 BUCK-BOOST CONVERTER BLOCK:
Step1: We add a Buck boost converter block from Simulink Library file > Subsystem
Step 2: Inside Buck-boost converter subsystem block, we add a required circuit model of buck boost converter.
Step 3: We add 1 Input port , ( 1,2 – Input PMC ports and 3,4- Output PMC ports ) to our Simulink library.
Step 4: We add a subsystem for pulse generator block.
Step 5: Inside the pulse generator block we build the following equivalent circuit.
Step 6: Inside the pulse generator block:
1. We add the inport port 1
2. We add Repeating table block from Simulink Library file > Repeating table and give the following parameters to Repeating table block.
3. We add a summation block from Simulink Library file > sum and give the following parameters to summation block.
4. We add a relay block from Simulink Library file > relay and give the following parameters to relay block.
5. We add a data type conversion block from Simulink Library file > data type conversion and give the following parameters to data type conversion block.
6. We add the outport 1
7. Connect all the above blocks as shown.
Step 7: We add Inductor L1 from Simulink Library file > Series RLC branch and give the following parameters to it.
Step 8: We add Capactor C1 from Simulink Library file > Series RLC branch and give the following parameters to it.
Step 9: We add IGBT, connect it to the terminator from Simulink Library file > IGBT, and give the following parameters to it.
Step 10: We add Inductor L2 from Simulink Library file > Series RLC branch and give the following parameters to it.
Step 11: We add DIODE, connect it to the terminator from Simulink Library file > Diode, and give the following parameters to it.
Step 12: We add Capacitor C2 from Simulink Library file > Series RLC branch and give the following parameters to it.
Step 13: We add voltage measurement block from Simulink Library file > Voltage measurement and give the following parameters to it.
Step 14: We add current measurement block from Simulink Library file > current measurement and give the following parameters to it.
Step 15: We add Mux from Simulink Library file > mux and give the following parameters to it.
Step 17: Connect all the blocks from step 3 until step 16 as shown below to obtain the equivalent model.
4.7.3 PERTURB AND OBSERVATION MPPT CONTROLLER BLOCK : Step 1: We create a Perturb and Observation MPPT Controller subsystem block from
Simulink Library > Subsystem.
Step 2: Inside the MPPT Controller subsystem block, we add a required circuit model of MPPT Controller.
Step 3: Inside the MPPT Controller subsystem block, 1. We add the Inport 1
2. We add digital clock block from Simulink Library file > digital clock and give the following parameters to it
3. We add a Demux block from Simulink Library file >demux and give the following parameters to it.
4. We add a MATLAB Function file from Simulink Library >Matlab function (Perturb and Observation)
5. We add out port 1.
6. Connect all the above blocks as shown.
4.7.4 RESISTANCE BLOCK:
Step 1: We create a Resistance subsystem block from Simulink Library > Subsystem.
Step 2: Inside the Resistance subsystem block we build the following residual circuit.
1. We add PMC Port 1 from the Simulink library > PMC port and give the following parameters to it.
2. We add resistance R from the Simulink library > Series RLC branch and give the following parameters to it.
3. We add PMC Port 2 from the Simulink library > PMC port and give the following parameters to it.
We create X, Y goto tags from the Simulink library >goto tag and give t following parameters to it.
4.7.5 OUTPUT POWER BLOCK:
Step 1: We create output power subsystem block from Simulink Library > Subsystem.
Step 2: Inside the output power subsystem block we build the following residual circuit.
Step 3: Inside the output power subsystem block,
1. We add X,Y from tag from Simulink library > from and give the following parameters to it.
2. We add 2 demux block from Simulink library >demux and give the following parameters to it.
3. We add two product block from Simulink library > product and give the following parameters to it.
4. To the first product block, we add Outport 1 from Simulink library >outport and give the following parameters to it.
5. To the second product block, we add Outport 1 from Simulink library >outport and give the following parameters to it.
Step 4: Connect all the above blocks as shown.
4.7.6 DEMUX BLOCK:
Step 1: Add the demux block from Simulink library >demux and give the following parameters to it.
4.7.7 SCOPE:
Add scope from Simulink library > Scope.
4.7.8 POWERGUI:
Add powergui from Simulink library >powergui and give the following parameters to it.
Connect the blocks from 4.7.1 to 4.7.9 and thus, finally we obtain the our
equivalent MATLAB model of PV system with MPPT Controller respectively.
PART 5
SUMMARY 5.1 RESULTS AND DISCUSSION
5.5.1 RESULT OF SKETCHUP MODEL OF GROUND PHOTOVOLTAIC PANEL SYSTEM.
A) For our designed ground photovoltaic system using the Sketch up software the solar panel exposure and the shadow effect at Safranbolu (Besides Bartin Karabuk Yolu Road) on 27 May 2020 at 08:30 AM, 12:00 PM and 03:15 PM is as shown below.
At 12: 00 PM,
At 03:15 PM,
A) For our designed ground photovoltaic system using the Sketch up software the solar panel exposure and the shadow effect at Safranbolu (Besides Bartin Karabuk Yolu Road) on 6 February 2020 at 08:30 AM, 12:00 PM and 03:15 PM is as shown below.
At 08:30 AM,
At 03:15 PM,
5.5.2 RESULT OF AUTOCAD MODEL OF GROUND PHOTOVOLTAIC PANEL SYSTEM.
For our designed ground photovoltaic system using the Sketch up software at Safranbolu (Besides Bartin Karabuk Yolu Road) we have successfully designed the overall electrical interconnection among the various components such as Solar panel, inverters and the AC Box. The overall electrical interconnection of our Ground photovoltaic panel system is as shown below.
5.5.3 SIMULATION RESULT OF MATLAB MODEL OF PHOTOVOLTAIC SYSTEM WITH MAXIMUMPOWER POINT TRACKING CONTROLLER. Output power V/s Time Characteristics
In our Solar PV Module,
Voc = 37.5 V, Isc= 8.63 A
Thus, the Output Power P of Solar PV Module= Voc X Isc = 37.5 X 8.63 = 323.62 W, with respect to time which is represented by the Yellow line in the above simulation.
The Output power of the Solar PV Module with MPPT controller w.r.t time is approximately 275 W which is represented by Pink line in the above simulation.
5.2 CONCLUSION
Worldwide environmental change is a developing concern. Sun oriented force lessens
dependence on petroleum products, for example, oil, coal and gaseous petrol. At the
point when petroleum products are utilized to make power, they produce hurtful gas
outflows that influence the wellbeing of air, water and soil. Interestingly, sun based
vitality creates no contamination. The sun's capacity offers a boundless wellspring of
vitality that doesn't strip the scene or damage the ozone layer. The U.S. Natural
Protection Agency prescribes changing to sustainable power sources since these
frameworks discharge lower carbon emanations. Sun based vitality frameworks speak
to an interest later on for earth, moderating non-reasonable vitality sources and
ensuring the earth for the people to come. Thus, our thesis presents a complete design
of the Ground photovoltaic system and also discusses electrical interconnection of the
designed model so that Solar power can be empowered over other energy sources. It
gives an idea for researchers based on the design aspects and simplifies the electrical
interconnection to establish a solar plant in Safranbolu, Turkey. Also, we have
simulated the Photovoltaic Module with MPP tracking controller and obtained the
REFERENCES
[1] N. Pandiarajan and RanganathMuth” Mathematical Modeling of Photovoltaic Module with Simulink” in 2011 1st International Conference on Electrical Energy Systems.
[2] Alpesh P. Parekh, Bhavarty N. Vaidya and Chirag T. Patel”Modeling and Simulation Based Approach of Photovoltaic System” in Global Research Analysis Volume 2 Issue 4 April 2013 • ISSN No 2277 –8160.
[3] Pandiarajan N, Ramaprabha R and Ranganath Muthu” Application Of Circuit Model For Photovoltaic Energy ConversionSystem”.
[4] P.Sathya, Dr.R.Natarajan” Design and Implementation of 12V/24V Closed loop Boost Converter for Solar Powered LED Lighting System “ in International Journal of Engineering and Technology (IJET) Volumeg No 1 Feb-Mar2013.
http://en.wikipedia.org/wiki/Photovoltaics
[5] Vandana Khanna, Bijoy Kishore Das, Dinesh Bisht “MATLAB/SIMELECTRONICS Models Based Study of Solar Cells” in INTERNATIONAL JOURNAL of RENEWABLE ENERGY RESEARCH Vandana Khanna et al., Vol.3, No.1, 2013.
RESUME
Sumair Mashraf was born in Shankarpally, Hyderabad (INDIA) in 1996 and graduated first and elementary education in this city. He accomplished high school education in Kendriya Vidyalaya School, after which, he began undergraduate program in Gokaraju Rangaraju Institute of Engineering and Technology, Department of Electrical and Electronics in 2018. Then in 2018, he started studying in Karabük University, Department of Electrical and Electronics Engineering to complete M. Sc. education, where he has been still studying.
CONTACT INFORMATION
Address: Karabük University
Demir-Çelik Campus/KARABUK.