TREND ANALYSIS OF TEMPERATURE AND
PRECIPITATION IN THE NORTHERN PART
OF LIBYA
2020
PhD THESIS
DEPARTMENT OF GEOGRAPHY
Mahmood Mohammed Mahmood SOLIMAN
TREND ANALYSIS OF TEMPERATURE AND PRECIPITATION IN THE NORTHERN PART OF LIBYA
Mahmood Mohammed Mahmood SOLIMAN
T.C.
Karabuk University Institute of Graduate Programs
Department of Geography Prepared as
PhD Thesis
Prof. Dr. Mücahit COŞKUN
KARABUK January, 2020
TABLE OF CONTENTS
TABLE OF CONTENTS ... 1
THESIS APPROVAL PAGE ... 5
DECLARATION ... 6
ACKNOWLEDGEMENTS ... 7
ABSTRACT ... 8
ÖZET ... 10
ARABIC ABSTRACT ... 12
ARCHIVE RECORD INFORMATION ... 14
ARŞİV KAYIT BİLGİLERİ... 15
ABBREVIATIONS ... 16
INTRODUCTION ... 18
I. SUBJECT OF THE RESEARCH ... 18
II. PURPOSE AND SUB-AIMS OF THE RESEARCH ... 21
III. SIGNIFICANCE AND LIMITATIONS OF THE RESEARCH ... 22
IV. RESEARCH HYPOTHESIS ... 23
V. MATERIALS AND METHODS OF THE RESEARCH ... 23
VI. PREVIOUS STUDIES ... 38
I. CHAPTER ... 41
CHARACTERISTICS OF PHYSICAL GEOGRAPHY ... 41
1.1. Geological Properties of Northern Libya ... 41
1.1.1. Paleozoic ... 41
1.1.2. Mesozoic ... 41
1.1.3. Cenozoic (Tertiary and Quaternary) ... 42
1.2. Properties of Geomorphology ... 45
1.2.1. North Mountains ... 45
1.2.1.1. Green Mountain ... 45
1.2.1.2. Western's Mountain ... 46
1.2.2.2. Aljafarah Plain ... 47
1.2.2.3. Sirte Plain ... 47
1.2.3. Plateaus ... 47
1.2.3.1. Al-Butnan and Defna ... 47
1.2.3.2. Al-Hamada Alhamra ... 48
1.2.4. Karstic Land Forms ... 48
1.2.5. Arid Region Land Forms ... 48
1.3. Climate of North Libya ... 51
1.4. Properties of Hydrography ... 51
1.4.1. Surface Water ... 51
1.4.2. Groundwater ... 51
1.5. Properties of Soils (Parent Material and Components)... 54
1.5.1. Zonal Soils ... 54
1.5.1.1. Terra Rossa ... 54
1.5.1.2. Arid Steppes Soil ... 55
1.5.2. Intra-Zonal Soils ... 55
1.5.3. Azonal Soils ... 56
1.6. Properties of Vegetation in North Libya ... 59
II.CHAPTER ... 62
CLIMATE CHARACTERISTICS ... 62
2.1. Effect of Physical Factors on Climate ... 62
2.1.1. Planetary Factors ... 62
2.1.1.1. Geographical Location ... 62
2.1.1.2. Air Masses and Fronts ... 64
2.1.1.3. Depressions ... 65
2.1.2. Geographical Factors ... 68
2.1.2.1. Effect Mediterranean Sea and Desert ... 68
2.1.2.2. Impact of Mountains and Direction of Coastline ... 68
2.1.2.3. Coastline Direction ... 69
2.1.2.4. Aspects ... 71
2.2. Elements of Climate ... 78
2.2.1. Solar Radiation ... 78
2.2.3. Atmospheric Pressure and Wind ... 95
2.2.3.1. Atmospheric Pressure ... 95
2.2.3.2. Wind Directions ... 101
2.2.3.3. Wind Speed ... 105
2.2.4. Humidity and Precipitation ... 108
2.2.4.1. Relative Humidity ... 108
2.2.4.2. Evaporation ... 112
2.2.4.3. Clouds ... 117
2.2.4.4. Precipitation ... 118
2.3. Some Classification of Climate in Study Area ... 131
2.3.1. SPI Index For Annual of Rain... 131
2.3.2. Climate Classification of Erinç ... 141
2.3.3.Climate Classification of L. EMBERGER (Coefficient of Thermal – Rain) ... 149
2.3.4. Index of Johansson for Continental Climate and Oceanity Climate 151 2.3.5. Index of Kerner for Continental Climate and Oceanity Climate ... 154
III. CHAPTER ... 157
DESCRIPTIVE STATISTICS AND DISTRIBUTION OF TEMPERATURE AND PRECIPITATION DATA ... 157
3.1. Descriptive Statistics and Distributions of Temperature Data ... 158
3.2. Descriptive Statistics and Distribution of Precipitation Data ... 207
3.3. Statistical Investigation of Temperatures and Precipitation Data ... 239
3.3.1. Investigation of Data Distribution ... 239
3.3.2. Homogeneity of Variances ... 240
3.3.2.1. Kruskal-Wallis ... 240
3.3.2.2. Mann-Whitney U ... 241
3.3.3.Correlation Analysis (Spearman's Rho, and Kendall's tau) ... 242
IV. CHAPTER ... 248
TREND ANALYSIS FOR TEMPERATURES AND PRECIPITATION DATA ... 248
4.1.Trend Analysis for Temperatures Data ... 249
4.1.1.2. Evaluation of Minimum Temperatures Results ... 268
4.1.1.3. Evaluationof Average Temperatures Results ... 272
4.1.2. Mann-Kendall Correlation Coefficient U(t)-U'(t) ... 276
4.1.2.1. Graphs of M-K U(t)-U'(t) Results for Seasonally and Annual Maximum Temperatures (1971-2010) ... 276
4.1.2.4. Evaluation for Results of Mann-Kendall Embodiment Correlation U(t) -U (t') Tests of the Maximum, Minimum and Average Temperatures Data ... 336
4.1.3. Simple Linear Trend for Temperatures Data ... 343
4.1.3.1. Simple Linear Trend of MaximumTemperatures Data (1971-2010) ... 343
4.1.3.2. Simple Linear Trend of Minimum Temperatures Data (1971-2010) ... 352
4.1.3.3. Simple Linear Trend of Average Temperatures Data (1971-2010) ... 362
4.2. Trend Analysis for Precipitation Data ... 371
4.2.1. Trend Analysis of Mann-Kendall, Spearman and Sen's slope ... 371
4.2.2. Relative Correlation of Mann-Kendall U(t)-U'(t) Graphs for Precipitation Data (1971-2010) ... 383
4.2.3. Simple Linear Regression of PrecipitationData (1971-2010) ... 405
4.2.3.1. Simple Linear Regression for Seasonally Precipitation ... 405
4.2.3.2. Simple Linear Regression for Annual Precipitation Data (1971-2010) ... 413
4.2.4. Control's Models of Trend for Annual Precipitation Data (1971-2010) ... 418 V. CHAPTER ... 427 CONCLUSION ... 427 REFERENCES ... 449 LIST OF TABLES ... 462 LIST OF FIGURES ... 468 LIST OF MAPS ... 486 CURRICULUM VITAE... 488
THESIS APPROVAL PAGE
THESIS APROVAL PAGEACKNOWLEDGEMENTS
First, I would like to thank my dear teacher, Prof. Dr. MücahitCoşkun for his support, guidance, and encouragement over the last four years and during the critical time since 2015, without whom this thesis would not have been possible. Besides, I would also thank my teachers Prof. Dr. Ibrahim Atalay, Prof. Dr. Ali Özçağlar, Prof. Dr. Ülkü Eser Ünaldi, and Prof. Dr. Fatih Aydin for their guidance and encouragement. I would also like to thank Prof. Dr. Duran Aydinözü for accepting thediscussion on my thesis. I extend my thanks to the staff of the Department of Geography, University of Karabük and all teachers and students who helped me at Karabük University.
My thanks to the Ministry of Higher Education and Scientific Research, Libya, University of Omer Al-Mokhtar, Tobruk branch, and Libyan Embassy-Cultural Attaché in Ankara (Turkey) for offering me the opportunity to study for this Ph.D. I am also grateful to the Department of Climatology at the National Meteorological Centre in Libya for providing me climate data.
Finally, I appreciate my brothers, sisters, and friends in Libya for support for me.
My special thanks and gratitude for my family, my wife Mrs. Fatma, my son Almontaser, and my daughters Maria, and Sirin, who have been supporting me for the last 6 years.
This work is dedicated to my parents (Mohammed &Mesauda) To my wife Fatma
To my daughters (Maria, Sirin) and my son Almontaser
ABSTRACT
The trend analysis is one of the important climate studies for detecting climate change in the short and long term. Climate change trend analysis can provide information on how climate has evolved to determine the changes and trends in climate elements over time. The importance of climate trend analysis studies is to estimate the risks of future climate changes based on current data and to try to avoid drought and lack of water resources by establishing sound scientific plans based on the results of these studies.
The scope of the research subject entitled “Trend Analysis of Temperatures and Precipitation data in Northern part of Libya” extends to analysis of 16 meteorological stations, 8 of which are coastal stations, which are Agdabia, Benghazi, Derna, Misurata, Sirte, Tobruk, Tripoli, Zwara. And 5 of them are desert stations, which are Ghadames, Ghariat, Hon, Jaghboub, Jalo, and 3 mountain stations are Alfataiah, NALUT and SHAHAT. In order to perform trend analysis, the data must be at least 30 years old. The data for current analysis in most of the stations comprises of 40 years, from 1971 to 2010, except for Alfataiah Station (1981-2010) and Tobruk Station (1984-2010).The necessary data comprising 40-year continuous data were collected from Libyan National Meteorological center climate & climate Change, Tripoli.
Microsoft Excel 2007 and IBM SPSS 23 program were used to organize the climate and other data and to create tables, graphs and figures for the data. Arc GIS 10.4 (Geography Information System) program was used to make the maps. Trend Analysis and Windows software and IBM SPSS 23 program were used to perform trends and other statistical analyzes. Descriptive statistics of the data were made in the statistical methods used within the scope of the study, Kolmogorov- Smirnov test for made normality distributions, and the data were not distributed normally. After the Kruskal-Wallis H test was used to determine the difference between the temperature and Precipitation, the correlation was determined using the Spearman Rho method for correlation analysis. For the trend analysis of 40-year temperature and precipitation
data, trends directions were determined by Mann-Kendall, Spearman Rho, Sen test, Simple Linear Regression Analysis for temperatures.
In maximum temperatures, it is observed that there are warming at western stations of the study area during the spring season and in most stations in the summer, and Sirte, Agdabia, Jalo and Hon stations in autumn. The winter season showed no significant trends in the maximum temperatures. However, the general average temperatures of the maximum temperatures have shown warming in all stations except for stations near Green Mountain and Zwara station in the west. In minimum temperatures, it is observed that there are warming at all stations in summer, except for Shahat station. In spring, while in the autumn season, all stations showed warming except for stations located on a high elevation, such as Nalut, Ghadames and Shahat. The winter season has shown trends towards warming at stations of Jagboub, Alfataiah, and Agdabia, as for the annual average, it showed trends towards warming in some situations, such as Jaghboub, Alfataiah and Zwara. In average temperatures, most stations showed a tendency to warming.
There were relationships between the indicators of the North Atlantic Oscillation (positive and negative) and the increase trends in the autumn season in several years the most important of which was in September 1993 with the value (-3.18) and its impact reached several stations such as Al-FATAIAH, JAGHBOUB, JALO, TRIPOLI and DERNA in increasing and decreasing trends in temperatures and precipitation in deferent years.
The El Nino and La Nino phenomenon influenced temperature trends and precipitation in the region. The El Niño effect (very strong) in the 1982-1983 season caused the lowest temperatures in DERNA station and the maximum temperatures in ZWARA and JALO stations while the phenomenon of La Niño affected the trends of precipitation in some stations such as NALUT, SHAHAT, JAGHBOUB, TOBRUK, DERNA, JALO, and JAGHBOUB.Based on results of this study, appropriate plans and policies can be established to address current and future climate conditions, by which areas threatened by drought and water shortages can be identified.
ÖZET
Trend analizi, uzun vadede iklim değişikliğini tespit etmek için önemli iklim istatistik uygulamalarından biridir. İklim elemanlarının zaman serileri içerisindeki değişikliklerini ve eğilimlerini belirlemek iklimin nasıl değiştiği üzerine bir fikir verebilir. Zaman serileri içerisindeki iklim değişkenliklerinin iklim parametrelerinde artış ya da azalış eğilimi göstermesi, mevcut durumu tespit etmek kadar gelecek ile ilgili öngörü yapılabilmesine de yardımcı olmaktadır.
Araştırmanın kapsamını; “Kuzey Libya'da Sıcaklık ve Yağış Verilerinin Trend Analizi” oluşturmaktadır. Tezin amacını ise, araştırmaya dâhil edilen istasyonların (Agdabia, Bingazi, Derna, Misurata, Sirte, Tobruk, Trablus, Zwara, Ghadames, Ghariat, Hon, Jaghboub, Jalo, Alfataiah, Nalut ve Shahat) sıcaklık ve yağış verilerini değerlendirerek mevcut trendin eğilimlerini, boyutunu ve şiddetini belirlemek meydana getirmekedir. Karma araştırma modelinin kullanıldığı bu çalışmanın verileri Trablus‟da bulunan Libya Ulusal Meteoroloji Merkezi İklim ve İklim Değişikliği biriminden elde edilmiştir.
Verilerin analizinde tablolar, grafikler ve şekiller oluşturmak için Microsoft Excel 2007, harita yapımı ve analizi için Arc GIS 10.4 programı, Trend analizi ve diğer istatistiksel işlemleri gerçekleştirmek için SPSS 23 programı kullanılmıştır. Sıcaklık ve yağış arasındaki farkı belirlemek için Kruskal-Wallis H testi uygulandıktan sonra korelasyon analizi için Spearman Rho yöntemi kullanılarak korelasyon belirlenmiştir. 40 yıllık sıcaklık ve yağış verilerinin trend analizi için eğilim yönleri Mann-Kendall, Spearman Rho, Sen testi, sıcaklıklar için basit doğrusal regresyon analizi ile belirlenmiştir.
Maksimum sıcaklıklarda, ilkbahar mevsiminde ve yaz aylarında çoğu istasyonda ve sonbaharda Sirte, Agdabia, Jalove Hon istasyonlarında çalışma alanının batı istasyonlarında ısınma olduğu görülmektedir. Kış mevsiminde maksimum sıcaklıklarda önemli eğilimler göstermemiştir. Bununla birlikte, maksimum sıcaklıkların genel ortalama sıcaklıkları, batıdaki Green Mountain ve Zwara istasyonu yakınlarındaki istasyonlar hariç tüm istasyonlarda ısınmayı göstermiştir.
Araştırmanın sonucunda minimum sıcaklıklarda, Shahat istasyonu hariç, yaz aylarında tüm istasyonlarda ısınma olduğu görülmektedir. İlkbaharda, tüm çöl istasyonları ısınma eğilimlerini gösterirken, sonbahar mevsiminde tüm istasyonlar Nalut, Ghadames ve Shahat gibi yükseltisi fazla olan istasyonlar dışında ısınma eğilimi göstermemektedir. Kış mevsimi, Jagboub, Alfataiah ve Agdabia istasyonlarında ısınmaya yönelik eğilimler göstermekte; yıllık ortalamada ise Jaghboub, Alfataiah ve Zwara gibi bazı stasyonlar ısınma eğilimleri göstermiştir. Ortalama sıcaklıklarda, çoğu istasyon her mevsim özellikle (1998-2001) arasında ısınma eğilimi göstermiştir. Isınma eğilimi, Trablus, Misurata, Bingazi gibi büyük nüfus merkezlerinin yakınında bulunan istasyonlarda ve Agdabia, Tobruk ve Sirte gibi petrol rafinerilerinin yakınında bulunan istasyonlarda görülmektedir.
Zwara, Trablus ve Tobruk istasyonları gibi bazı istasyonlar, yıllık yağış ortalamasında azalma eğilimleri gösterirken, diğer tüm istasyonların yağışında önemli bir eğilim göstermemiştir.
Kuzey Atlantik Salınımının göstergeleri (pozitif ve negatif) ile sonbahar mevsimindeki artış eğilimleri arasında en önemlisi (-3.18) değeri ile Eylül 1993'te olan ilişkiler bulunmaktadır ve onun etkisi AL-FATAIAH, JAGHBOUB, JALO, TRİPOLİ ve DERNA gibi çeşitli istasyonlara ulaşmıştır.
El Nino ve La Nino salınımları bölgedeki sıcaklık trendlerini ve yağışları etkilemiştir. 1982-1983 yıllarında El Niño etkisi (çok güçlü), DERNA istasyonundaki en düşük sıcaklıklara ve ZWARA ve JALO istasyonlarındaki maksimum sıcaklıklara neden olurken, la Niño salınımı NALUT, SHAHAT, JAGHBOUB, TOBRUK, DERNA, JALO ve JAGHBOUB gibi bazı istasyonlarda yağış trendlerini etkilemiştir.
Araştırmanın sonuçlarına göre Libya‟daki iklim değişikliğinin olumsuz etkilerini ortadan kaldırmak veya azaltmak için düşük yağış ve artan sıcaklıkları etkileyen bazı tedbirler alınmalıdır. Bu tedbirlerin en önemlisi, su kaynakları yönetimi için planlar yapılmalı ve uygulanmalıdır.
Anahtar Kelimeler: Sıcaklık, Yağış, Trend Analizi, Mann-Kendall, Spearman Trend Eğilim Testi, Fiziki Coğrafya.
ARABIC ABSTRACT
ُ ملا صخل ذؼذ حساسد ًٍُحذ خاهادذلاا جذحاو ِٓ خاساسذٌا ُ ٌّا حُخإ حّهٌّا فشىٌٍ ٓػ شُغذ ُ ٌّا خإ ًٍػ يذٌّا ةَشمٌا ذُؼثٌاو ، ٓىَّو ْأ شفىَ ًٍُحذ خاشُغرٌّا ُ ٌّا حُخإ خاِىٍؼِ ٓػ حُفُو سىطذ ُ ٌّا خإ ِٓ يلاخ ًٍُحذ ًسلاسٌا حُِٕضٌا . يادِ ثحثٌا ىه ًٍُحذ ٖادذا اخسد خ جساشحٌا يىطهو ساطِلأا ٍف ٌا ُسم ٌٍاّشٌا ِٓ اُثٌُ ، ـٌ 61 حطحِ داصسأ ،حَىخ اهِٕ 8 خاطحِ حٍُحاس ٍهو اُتاذخأ ٌصاغٕتو حٔسدو و حذاشصِ خشسو قشثغو سٍتاشغو و جساوص . و 5 اهِٕ خاطحِ حَواشحص ٍه سِاذغ ، و خاَشمٌا ، ْىهو ، و بىثغدٌا ، و خ ىٌا ، و 3 خاطحِ حٍُثخ ٍه حئارفٌا و خاحش و خىٌأ . ِٓ ًخأ ءاشخئ ًٍُحذ خاهادذلاا ًٍػ ىحٔ شثرؼِ ،ًاٍُّػ ةدَ ُّلاأ ًمذ خأاُثٌا ُ ٌّا حُخإ ٓػ 33 اًِاػ . دٔاو ًسلاسٌا حُِٕضٌا ٍف ُظؼِ خاطحٌّا ( 03 اًِاػ ) ، ِٓ 1641 ًٌئ 0212 ، ءإثرسات حطحِ حئارفٌا ذمف دٔاو جذِ اُت اهذأ ( 02 ًُاِاػ ) ِٓ 6886 ًٌئ 1336 ، حطحِو قشثغ ( 04 ًُاِاػ ) ِٓ 1651 ًٌئ 0212 ، ،هٌزٌ نإه ذَذؼٌا ِٓ خاطحٌّا ٍف حمطِٕ حساسذٌا ٌُ جسذ ذ ٍف ،ثحثٌا اهِٕ ًٍػ ًُثس ياثٌّا حطحِ شصأ و حطحِ ْشفَ و حطحِ ،جشفىٌا ثُح لا ذخىذ حٍسٍس خأاُت حّظرِٕ ٓىَّ داّرػلاا اهٍُػ ٍف ٍُحذ ً خاهادذلاا . ضشغٌا ِٓ ٖزه حساسذٌا ىه ًٍُحذ خاهادذا خأاُت خاخسد جساشحٌا و ساطِلأا خاطحٌٍّ حٌىّشٌّا ٍف ثحثٌا فشؼرٌاو ًٍػ جداَضٌا وأ ْاصمٌٕا ٍف هٍذ ،خاطحٌّا و هٌر حّهاسٌٍّ ٍف ءاشثئ حثرىٌّا حٍُّؼٌا ُ ٌٍّ خإ ، حصاخ و ئ ْ خاساسد ًٍُحذ خاهادذا ُ ٌّا خإ حٍٍُل ٍف ،اُثٌُ ثُح ّٓىذ حُّهأ حساسد ًٍُحذ ٖادذا ُ ٌّا خإ ٍف إثٕرٌا شغاخّت خاشُغرٌا ُ ٌّا حُخإ ،حٍُثمرسٌّا حٌواحِو ةٕدذ حٍىشِ فافدٌا صمٔو دساىٌّا حُئاٌّا و ذُششذ ،اهولاهرسا و ذمرؼ َ ْأ ثحثٌا س فى ُهسَ ٍف ذَذحذ كغإٌّا حفادٌا ٍف ياّش ،اُثٌُ ِٓ ًخأ ءاطػئ حَؤس حٍُثمرسِ شَىطرٌ غَساشِ ٖاٌُّا ٍف اُثٌُ و ٍرٌا ِٓ اهٌلاخ ٓىَّ كُمحذ حُّٕرٌا حَداصرللاا ٍف دلاثٌا . ُذ يىصحٌا ًٍػ خأاُثٌا ِٓ ضوشٌّا ٍٕغىٌا ٍثٌٍُا داصسلأٌ حَىدٌا شُغذو ُ ٌّا ،خإ سٍتاشغ . َذخرس ا حِأشتMicrosoft Excel 2007 حِأشتو IBM SPSS 23حِأشتَذخرس ُ اُ ث،حُخإُ ٌّاخأاُثٌا ُُظٕرٌArc GIS 10.4.حُخإُ ٌّاوحُؼُثطٌاػئاشخٌاًّؼٌ )حُفاشغدٌاخاِىٍؼٌّاُظٔ( َذخ رسا حِأشت IBM SPSS 23خأاُثٌحُفصوخاءاصحئدَشخ أ .يشخأحُئاصحئوحُهادذاخلاٍُحذءاشخلإ جساشحٌا و شطٌّا . دَشخ أ خاساثرخا خاؼَصىرٌا حُؼُثطٌا حطساىت ُ ساثرخا Kolmogorov Smirnov ثُح خساشأ ةٍغأ حئارٌٕا ْأ غَصىذ خأاُثٌا ٌُ ُرَ ًىشت ٍؼُثغ . َذخرس ا ساثرخا Kruskal-Wallisُٓتقشفٌاذَذحرٌ حخسد جساشحٌا يىطهو ،ساطِلأا خدذ ح حللاؼٌا ُٓت خأاُثٌا َاذخرسات
حمَشغ Spearman's Rho and
دطػأ خاساثرخا ًٍُحذ ٖادذلاا جذػ خاهادذا ،حفٍرخِ ثُح عحىٌ دىخو عافذسا ٍف خاخسد جساشحٌا ًّظؼٌا ٍف خاطحٌّا حُتشغٌا حمطٌّٕ حساسذٌا يلاخ ًصف ،غُتشٌا ٍفو ُظؼِ ٌّا خاطح ٍف ًصف ،فُصٌا و خاطحِ خشس و اُتاذخأ و ىٌاخ ْىهو ٍف ،فَشخٌا ٌُو شهظَ ُسىِ ءارشٌا ٌأ خاهادذا حّهِ . غِو ،هٌر ْاف يذؼٌّا ٌىٕسٌا خاخسذٌ جساشحٌا ًّظؼٌا شهظأ خاهادذا ىحٔ جداَضٌا ٍف غُّخ خاطحٌّا ءإثرسات خاطحٌّا حثَشمٌا ِٓ ًثدٌا شعخلأا ٌصاغٕت و حئارفٌا حطحِو جساوص ٍف بشغٌا . ٍف خاخسد جساشحٌا يشغصٌا عحىٌ عافذسا خاخسد جساشحٌا ٍف غُّخ خاطحٌّا ٍف ًصف ،فُصٌا ءإثرسات حطحِ ،خاحش ٍف ًصف ،غُتشٌا خشهظأ غُّخ خاطحٌّا حَواشحصٌا خاهادذا ىحٔ ،ساشرحلاا و هٌزو ياحٌا ٍف ًصف فَشخٌا خشهظأ غُّخ خاطحٌّا جداَص ٍف خاخسد جساشحٌا ٕثرسات ءا خاطحٌّا حؼلاىٌا ٍف ِٕ كغا حؼفذشِ قىف يىرسِ حطس شحثٌا ، شهظأ ًصف ءارشٌا خاهادذا ىحٔ ساشرحلاا ٍف حِ خاط بىثغدٌا و حئارفٌا و اُتاذخأ . ٍف يذؼٌّا َاؼٌا خاخسذٌ ،جساشحٌا خشهظأ ُظؼِ خاطحٌّا ًُلاُِ ًٌئ ساشرحلاا ٍف غُّخ يىصفٌا ًُاعَأو ٍف يذؼٌّا ،ٌىٕسٌا حصاخ ُٓت ( 1665 - 2010 ازه حظحلاِ ٓىَّو ،) ساشرحلاا ٍف خاطحٌّا حثَشمٌا ِٓ ضواشٌّا حُٔاىسٌا جشُثىٌا ًثِ سٍتاشغ و حذاشصِ و ٌصاغٕت . هٌزوو خاطحٌّا جدىخىٌّا بشمٌات ِٓ ٍفاصِ شَشىذ ػفٌٕا ًثِ اُتاذخأ و قشثغ و خشس . ٌُ شهظ ذ غُّخ خاطحٌّا ٌأ خاهادذا حّهِ ٍف يىطه ،ساطِلأا حصاخ ْأ طؼت حٌّا خاط خشهظأ خاهادذا ىحٔ ضافخٔلاا ٍف خلاذؼٌّا حَىٕسٌا خاُّىٌ ،ساطِلأا ًثِ خاطحِ جساوص و سٍتاشغ و قشثغ . دٔاو نإه خاللاػ ُٓت خاششإِ بزتزذ ياّش ٍسٍغلأا ( حُتادَئ حُثٍسو ) حصاخ ٍف ُسىِ فَشخٌا يلاخ جذػ خاىٕس اهّهأ َاػ 1660 ، اِذٕػ ْاو ششإٌّا ٍف شثّرثس ( -0115 ) ، و ذمٌ ًصو ٖشُثأذ ًٌئ ذَذؼٌا ِٓ خاطحٌّا ًثِ حئارفٌا و بىثغدٌا و ىٌاخ و سٍتاشغ و حٔسد . و حٔسامٌّات ُٓت حئارٔ حساسذٌا و حئارٔ بزتزذ ياّش ٍسٍغلأا عحىٌ ْأ نإه حللاػ ُٓت خاهادذا ( جداَضٌا ْاصمٌٕاو ) ٍف ذَذؼٌا ِٓ خاطحِ حمطِٕ حساسذٌا و شهظَ شثلأا ًُاحظاو ًٍػ خاخسد جساشحٌا يىطهو ساطِلأا ٍف ُساىِ و خاىٕس حفٍرخِ . و جشهاظٌ El Niñoخاهادذاًٍػفُؼظشُثأذ خاخسد جساشحٌا يىطهو ساطِلأا ٍف حمطٌّٕا . ٍف ُسىِ 1650 -1650 ًصو شُثأذ ىٌُُٕٕا ًٌئ حمطِٕ حساسذٌا اِذٕػ ْاو ( ٌىل اًذخ ) و شصرلا ٖشثأ ػمف ًٍػ خاخسد جساشحٌا يشغصٌا ٍف حطحِ ،حٔسد و خاخسد جساشحٌا ًّظؼٌا ٍف خاطحِ جساوص و ىٌاخ . ٍف ُٓح ْأ جشهاظ La Niñoٍفساطِلأايىطهخاهادذاًٍػشُثأذاهٌْاو طؼت خاطحٌّا ًثِ ،خىٌأ و ،خاحش و ،بىثغدٌا و ،قشثغ و ،حٔسد و ىٌاخ . اًدإرسا ًٌئ ُُُمرٌا ٍمُمحٌا حئارٌٍٕ ٍرٌا ُذ يىصحٌا اهٍُػ ِٓ ًٍُحذ ادذلاا ،خاه ٓىَّ ءاشٔئ ػطخ خاساُسو حثسإِ حهخاىٌّ فوشظٌا ُ ٌّا حُخإ حٌُاحٌا ،حٍُثمرسٌّاو ِٓ اهٌلاخ ٓىَّ شصح كغإٌّا جدذهٌّا فافدٌات و ضدؼٌا ٍئاٌّا . تاملكلا ةيحاتتفلاا : حخسد ،جساشحٌا ،ػلاسرٌا ًٍُحذ ،ٖادذلاا ْاِ ،ياذُٕو ،ْاِشُثس ُ ٌّا ،خإ اُفاشغدٌا حُؼُثطٌا
.
ARCHIVE RECORD INFORMATION
Name of Thesis Trend Analysis Of Temperature And Precipitation Data In Northern Of Libya
Author of Thesis Mahmood Mohammed Mahmood SOLIMAN
Advisor of Thesis Prof. Dr. Mücahit COŞKUN Degree of Thesis PhD. Programme
Date of Thesis January, 2020 Field of Thesis Geography
Place of Thesis KBU/LEE
Number of Pages 488
Keywords Climatology, Temperature, Precipitation, Trend, Northern Part of Libya.
ARŞİV KAYIT BİLGİLERİ
TezinAdı Kuzey Libya'da Sicaklik Ve Yağiş Verilerinin
Trend Analizi
TezinYazarı Mahmood Mohammed Mahmood SOLIMAN
TezinDanışmanı Prof. Dr. Mücahit COŞKUN
TezinDerecesi DoktoraProgramı
TezinTarihi Ocak, 2020
TezinAlanı Coğrafya
TezinYeri KBÜ/LEE
TezinSayfaSayısı 488
ABBREVIATIONS
Ap. : April Aver. : Average Ag. : August Aut. : Autumn °C : Celsius Temperature CL : Control Limit De. : December E : EastENSO : El Niño Southern Oscillation GIS : Geography Information System hPa : Hectopascal (Pressure Unit)
Fb. : February
IPCC : Intergovernmental Panel on Climate Change
Ja. : January
Jn. : June
Jl. : July
km : Kilometer
K-W : Kruskal Wallis LCL : Lower Control Limit
LNMC : Libyan National Meteorological Centre LSL : Lower Specification Limit
m : Meter Mr. : March Ma. : May M-K : Mann-Kendall Max. : Maximum Min. : Minimum mm : Millimeter MO :Mediterranean Oscillation
N : North
n : Sample Size
NAO : North Atlantic Oscillation
Nv. : November
p : Significance Level
Oc. : October
r : Coefficient of correlation
S : South
SAO : Southern Oscillation Index
Sp. : September
SPI : Standard Precipitation Index
SPSS : Statistical Package for the Social Sciences
Spr. : Spring
Std. : Standard Deviation
Std.eva. : Standard Deviation on Sample Size
Sum. : Summer
UCL : Upper Control Limit USL : Upper Specification Limit
U(t)-U'(t) : Mann-Kendall Order Correlation Test
W : West
WEMO : Western Mediterranean Oscillation
Win. : Winter
WMO : World Meteorological Organization Z : Result of Mann Kendall & Spearman test
INTRODUCTION
The introduction part of thesis covers the subject of the research, purpose, sub-objectives, justification, importance, limitations, materials and methods and analysis of previous studies.
I. SUBJECT OF THE RESEARCH
The climate is one of the major physical elements on the earth that has become an important area of scientific research. The governments of many countries in the world have shown keen interest in climate change after the industrial revolution of the 19th century. Besides, the issue of global warming in recent decades has also increased the interest of scientists in climate research.
In general, climate change can be defined as a long-term and slow-developing changes with significant global and local impacts on climatic conditions of the world. These changes in climate during ice age and interglaciation period has great impact on climatic patterns in various regions of the world that influence the melting of glaciers, average temperature and amount of precipitation (Türkeş, 2001).
This implies that the portrayal of the climate patterns in a particular region must include an analysis of mean conditions of the seasonal cycle of the probability of extremes such as severe drought in the arid areas.
The most recent assessment conducted by Intergovernmental Panel on Climate Change (IPCC) has reported an increase in the mean surface temperature from 0.56 0C in 1906 to 0.92 0C in 2005 (IPCC, 2007). This increase is larger than what had been mentioned by previous IPCC report, which mentioned that global mean surface temperature has increased by approximately 0.3 0C to 0.6 0C from 1901-2000 (IPCC, 2001).
Climate changes in the past were entirely due to natural causes. However, the share of human activities in recent climate changes is much greater. The short-range climate changes, which are suggested to be the result of more human activities, are the subjects related to the phenomenon of global warming (Nişancı, 2007).
The climate which has a dynamic structure shows continuous variation in temporal and spatial scale, hence, a large part of the earth is subject to changes due to the nature of the climate in short or long periods. On the other hand, the idea of global climate change, which is expressed as the increase of global temperature and the change of rainfall pattern, has started to be accepted by the scientists due to the findings obtained in recent years (Karabulut, 2009).
Climate change has both positive and negative effects. These impacts influence human health and quality of life at greater extent with changes in water resources, natural ecosystems, agriculture, forestry, and fishing activities. The negative impact start dominating as the changes in the climate patterns increase (Demirci, and Karakuyu, 2002; Türkeş, 2012).
The elements of heat and precipitation are of the most important climatic elements that affect directly or indirectly other air elements such as evaporation, condensation, atmospheric pressure, etc. Any change in temperature or lack of rain can cause a change in the general that affects regional or even local climate. Temperature and precipitation that represents the main elements of climate have both spatial and temporal variability.
The oscillations in the temperature and precipitation parameters show evidence of the general characteristics of the climate and they are of great importance. Accordingly, recent studies on climate change have focused on the trend analysis of temperature and precipitation parameters. The studies revealed that during the period between 1850-2016, the year 2000 represented the hottest ten years on a global scale (Cosun, 2009 andTürkeş, 2012).
This definition of the climate as representative of conditions over several decades should, of course, not mask the fact that climate can change rapidly. Nevertheless, a substantial time interval is needed to observe a difference in climate between any two periods. In general, the less the difference between the two periods, the longer is the time needed to identify any changes in the climate between them with confidence.
Following the World Meteorological Organization (WMO), a period of 30 years is the classical period for performing the statistics used to define climate. This is well
data while still providing a good sample of the different types of weather that can occur in a particular area.
However, when analyzing the most distant past, such as the last glacial maximum around 20.000 years ago, climatologists are often interested in varied characteristic of longer time intervals. Consequently, the 30-year period proposed by the WMO should be considered more as an indicator than a norm that must be followed in all cases (Brohan, 2006).
The analysis of previous literature has revealed that there is an absence of scientific studies regarding trend analysis of temperature and precipitation in Libya. Therefore, in present study the trend analysis was applied to temperature and precipitation data of north Libya from 16 meteorological stations for the period between 1971-2010, to identify general trends along with present and future climate predictions in the study area. Besides, the dimensions of climatic changes related to these climate parameters were determined in order to make accurate inferences about future situations on the climate. In this study, trend analysis was performed on temperature and precipitation parameters instead of evaluating all climatic parameters which best reflect the changes in climate with time.
The study area is located in North Africa in Libya extending from 28.00 to 33.10 latitudes in north and 09.20 to 25.00 longitude in the east. Mediterranean sea lies in the north, desert of Libya in the south, Tunisia and Algeria in the west and Egypt in the east of the study area. There is about 1900 km long coastline in the north of study area extending from Berdya gulf in the east to Ras Ajdir in the west.
The study area covers an area of about 538,495 square kilometers comprising two different regions. First region comprises coastline area, Green Mountain in Northeast, and West Mountain in northwest, while the second one is southern region which is a dry desert area making the largest part of the study area. This diversity and extension in the surface features resulted in a variety of climatic conditions prevailing in the region from semi-humid climate in the north and semi-arid climate in the center to the very-arid climate in the south.
Map 1. Location Map of Northern Libya
II. PURPOSE AND SUB-AIMS OF THE RESEARCH
Present research aims to identify the trend of temperature and precipitation data of long period and find the direction and dimensions of these trends. For this purpose, the following questions have been sought:
What are the planetary and local factors affecting the climate of northern Libya?
In which trends (increase/decrease) the trend has occurred in meteorological stations (Desert stations or Coast stations)?
Which meteorological stations show strong trends and are these stations show changes in temperature and precipitation data?
Is there any relationship between the temperatures and precipitationtrends in Libya and global climate change and climatic phenomena such as Atlantic oscillations and El Niño?
A number of studies have recommended the study of trends for different climate variables (Nalley, 2012) to understand the relationship between human activities and climate. In the light of this, the main objective of this research is to analyze the trends that may exist in the time series of climatic variables. These parameters serve as good indicators of how the climate has evolved as the studies on climate change indicate an increase in patterns of temperature and precipitation experienced in different parts of the world. Therefore, information about the impacts of climate change on the spatiotemporal characteristics of temperature and precipitation is required to understand the effects of climate change on scarcity of water resources in region.
III. SIGNIFICANCE AND LIMITATIONS OF THE RESEARCH
The subject of the study is important because it is the first study that provides a clearer understanding of climatic trends in Libya with such extent the obtained results are thought to provide an important contribution to the development of climate plans and policies.Climatic characteristics, climate change and trends have a very decisive influence on human activities and ecosystems. These effects are mostly manifested by temperature and precipitation elements. This issue demonstrates the necessity of the subject taken in the study and shows the importance of taking the basis of temperature and precipitation data for trend analysis. Besides, it is also important to analyze the trends of heat and rain in the region to identify the causes of drought and how to treat them by sound scientific methods as the study area suffers from the problem of water shortage and the spread of drought in agricultural land.
During the course of research, some difficulties were encountered in terms of accuracy of the results of the study. In order to carry out the trend analysis which constitutes the subject of the research, there is a need for at least 30 years of temperature and precipitation data continuously. While the number of meteorological stations in North Libya is more than the number of stations included in the study, all of these stations were not included in the study. This is because some stations did not have long-year data and data sets containing long years did not show uninterrupted measurements and in some cases the data for 5 years or more were not taken
consecutively in these stations. Besides, the most important difficulties faced during the research were the lack of sources and references of climate.
IV. RESEARCH HYPOTHESIS
The hypotheses created within the scope of the research are as follows:H0: Observation sequences of North of Libya temperatures (mean, average maximum
and average minimum) show trends.
Ha: Observation sequences of the North of Libya temperatures (mean, average
maximum and average minimum) do not show any trend.
H0: Observation sequences for the precipitation of the North of Libya show a trend.
Ha: Observation sequences of the precipitation of the North of Libya do not show any
trend.
H0: There is a relationship between Temperatures and Precipitation trends, Atlantic
oscillations, and El Niño.
Ha: There isn't a relationship between Temperatures and Precipitation trends, Atlantic
oscillations, and El Niño.
V. MATERIALS AND METHODS OF THE RESEARCH
Within the scope of the research, a detailed literature review was conducted including local and international sources of information. In light of the literature, features and characteristics of physical geography were determined as they have an influence on climatic properties and necessary preliminary works were made about the evaluation processes of the programs, methods, and analyses used in the trend analysis. Following actions were taken after collection of secondary data of climate obtained from the Libyan National Meteorological Office, The steps regarding the organization and evaluation of the scattered data are given below:
Monthly and long-year average and total values of temperature, solar duration, humidity, precipitation, pressure and wind velocity were calculated with Microsoft Excel 2007 program. Tables and graphs were created through this program to visualize these numerical data including solar radiation, temperature, atmospheric pressure, wind directions, humidity, evaporation, clouds, precipitation, SPI index, and all classifications of climate.
The Excel (QI Macros) was used to extract the standard deviations of temperature and precipitation variables and graphs were made.
IBM SPSS 20 program was used in creating selective statistics, analysis of data distribution, determination of differences and correlation analysis. In the determination of the distribution of data Kolmogorov-Smirnov, Mann-Whitney U for the difference and Spearman Rho test for correlation analysis were used. SPSS 20 program was used to determine the homogeneity of variances on
temperature and precipitation data and Kruskal-Wallis H test was preferred. Trend values of temperature and precipitation data were determined using
Trend Analysis for Windows program. Microsoft Word 2007 program was used to table these values.
Simple linear regression analyses for temperature and precipitation data were performed on the IBM SPSS 20 program and results were visualized by graphs on Microsoft Excel 2007 program.
Mann-Kendall-rank correlation graphs were created on the Microsoft Excel 2007 program using the u(t)-u'(t) values obtained from the Trend Analysis for Windows software.
App of XmR Trend Control Chart in Excel (QI Macros) was used to identify the trends of maximum and minor temperatures and general averages for seasons, and years, and also was used to identify the monthly and annual precipitation trends.
The tabulation of the values obtained from these formulas and the creation was carried out via Microsoft Excel 2007.
Mapping was done through GIS program (Arc map 10.3).
* Climate Data, consists of a groups of time series, a simple model of data in a time series is to view each observation as being the realization of a random variable made up of a trend through time, (one or more) seasonal effects, and remaining effects that are not a function of time (Tamra et al., 2013).
Climatic data for 16 synoptic stations across Libya were collected from the Libyan National Meteorological Centre (LNMC), for periods of 1971-2010 from 16 stations except for ALFATAIAH station 1981-2010 and TOBRUK station 1984-2010. as most
2011 due to the political circumstances of the country. The following table 1 and map2 show the geographical characteristics of the selected stations.
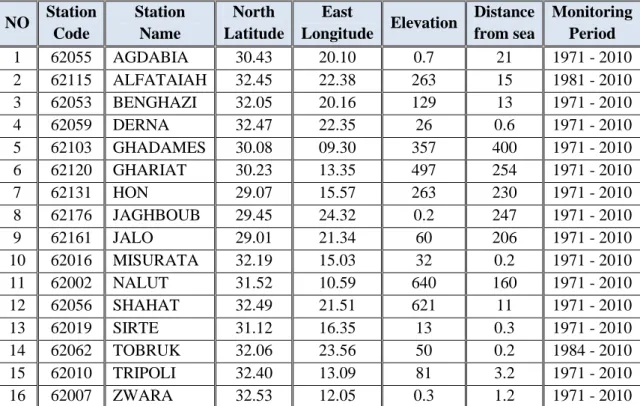
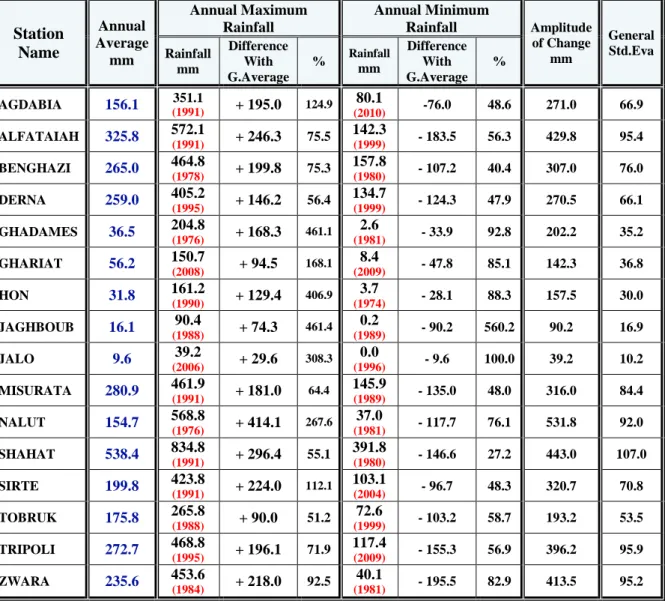
Table 1. Geographical Information about Meteorological Stations
NO Station Code Station Name North Latitude East Longitude Elevation Distance from sea Monitoring Period 1 62055 AGDABIA 30.43 20.10 0.7 21 1971 - 2010 2 62115 ALFATAIAH 32.45 22.38 263 15 1981 - 2010 3 62053 BENGHAZI 32.05 20.16 129 13 1971 - 2010 4 62059 DERNA 32.47 22.35 26 0.6 1971 - 2010 5 62103 GHADAMES 30.08 09.30 357 400 1971 - 2010 6 62120 GHARIAT 30.23 13.35 497 254 1971 - 2010 7 62131 HON 29.07 15.57 263 230 1971 - 2010 8 62176 JAGHBOUB 29.45 24.32 0.2 247 1971 - 2010 9 62161 JALO 29.01 21.34 60 206 1971 - 2010 10 62016 MISURATA 32.19 15.03 32 0.2 1971 - 2010 11 62002 NALUT 31.52 10.59 640 160 1971 - 2010 12 62056 SHAHAT 32.49 21.51 621 11 1971 - 2010 13 62019 SIRTE 31.12 16.35 13 0.3 1971 - 2010 14 62062 TOBRUK 32.06 23.56 50 0.2 1984 - 2010 15 62010 TRIPOLI 32.40 13.09 81 3.2 1971 - 2010 16 62007 ZWARA 32.53 12.05 0.3 1.2 1971 - 2010
Source: Unpublished data from General Administration of Meteorology and Climate, Tripoli, Libya, 2012.
Methods
The following are the stages for the regulation and evaluation of the data. The longest observational periods of meteorological stations were first determined and the data sets were evaluated in this context.
Applied Statistical Methods
Various statistical methods were used in the research. Firstly, descriptive statistics of the data were determined and then the distribution of the data was examined with the Kolmogorov-Smirnov test. Following this process, the data were subjected to the Kruskal Wallis H test to determine the homogeneity of the variances and whether there was a difference between the variables.
The difference between the average temperature and precipitation data was considered separately and the Mann Whitney U test was used for this. Limiting the number of groups to two required the use of the Mann Whitney test instead of Kruskal Wallis test. Correlation analysis was performed with Spearman Rho test on temperature and precipitation data before the trend analysis.
The normal distribution of the data and the lack of homogeneity necessitate the use of this method. Mann-Kendall and Spearman's Rho tests were used for the analysis of temperature and precipitation data. In the determination of trend start year, Mann-Kendall Order Correlation test statistic and Trend Linear Regression and Sen's Trend Slope tests were used (Yılmaz, 2018).
In the analysis of trend analysis, it is very important to obtain data containing long-term measurements and to delong-termine the increase or decrease in trend of time series in terms of parametric and nonparametric methods (Gümüş, 2006).
It is possible to obtain better results with the use of parametric tests in cases where the data have a normal distribution and the variances are homogeneous. In non-parametric tests, the time series generally shows a non-normal distribution. Therefore, The use of nonparametric methods in the determination of the trend in the climatic data where continuous variables such as temperature and precipitation are concerned provides more accurate results than parametric methods (Yılmaz, 2018).
Within the scope of this study, descriptive statistics were performed primarily on average temperature and precipitation data. After descriptive statistics, Kolmogorov-Smirnov test was used to investigate the distribution of the data. Then, temperature and precipitation data were tested for Kruskal-Wallis H correlation analysis by Spearman Rho for the homogeneity of variance. The determination of the normal distribution of the data required the use of these methods. As a result of these stages, Mann-Kendall, Spearman's Rho, Sen-Trends and Mann-Kendall Correlation tests and Simple Linear regression analysis were applied to the data.
Kolmogorov-Smirnov
It is a method used to investigate the normality of data. It is preferred when the group size is greater than 30. The evaluation of the test is carried out by comparing the obtained p value with the desired level of significance. If the group size is less than 30, the Shapiro-Walks test is suitable (Yılmaz, 2018).
Kruskal Wallis H Test
In studies of climatic change, change types such as the form of sudden or step climatic fluctuation or periodicity, strong tendency and change in atmospheric or hydrological series, constitute the main alternatives of homogeneity. Some of the aforementioned types of change may reflect non-homogeneity. The observation records obtained from the applications performed on the data are often not homogeneous (Yılmaz, 2018; Türkeş, 2013).
In scientific studies, the data to be included in the research must be absolutely reliable. One of the ways to provide valid information on the reliability of the data is the quality control and homogeneity analysis for meteorological measurements. Climatologically data are not always homogeneous. Such data show occasional non-homogenous characteristics depending on urbanization, measuring instrument problems and station location change factors. However, when the discontinuities and values observed do not have a normal distribution, the precipitation parameter differs from many other meteorological parameters. Depending on the nature of the precipitation parameter, it is inconvenient to use the one-way variance test (ANOVA) in the homogeneity analysis of precipitation data. One-way variance test is applicable for cases where normal distribution is seen and the variances of the series are accepted
One way variance test is a parametric test. The Kruskal Wallis H test refers to the non-parametric response of the one-way analysis of variance where the samples exhibit independent irrelevant characteristics. An alternative non-parametric Kruskal Wallis H test is preferred when one-way analysis of variance is not possible. The assumptions adopted by the ANOVA test are invalid and when the number of groups to be compared exceeds two, the Kruskal Wallis test is applied. In the Kruskal Wallis analysis, first the values are sorted, the difference between the independent tools of the ranking values is compared and the difference between them is tested (Büyüköztürk, 2016).
The Kruskal Wallis H homogeneity test is performed on averages and variances to demonstrate the homogeneity of these values and reflects a non-parametric effective homogeneity test. In this homogeneity test, it is not possible to use original observations containing each of the analyzed sequences. In the Kruskal Wallis H homogeneity test, the sequence numbers of the total sequential sequence formed by ordering the original observations from small to large are used (Türkeş, 2013).
The following hypotheses were considered to test the homogeneity of the mean:
H0: Group variances are homogeneous.
Ha: Group variances are not homogeneous.
Mann Whitney U-Test
Mann-Whitney U test is used to determine whether the data of two non-related samples differ significantly from each other. In order to be able to apply this test, the dependent variable must be at least on the ranking scale and the observation results must be independent from each other. In the evaluation of the analysis, the total number of the values of the two groups is taken as the basis (Büyüköztürk, 2016 and İçel, 2009).
Mann-Kendall Test
The statistical methods used to determine the degree and direction of the relationship between variables and the dependent and independent variables of the variables are defined as correlation. In this respect, Mann-Kendall and Spearman Rho tests are applied when the parametric Pearson Correlation test is not possible to use
The Mann-Kendall test is one of the commonly used methods for determining the trend occurring in time series for study areas such as climatology and hydrology(Salamiet al., 2016). The Mann-Kendall test is a statistical method proposed by the World Meteorological Organization (WMO). In many studies on trend analysis, this method has demonstrated superiority among other methods used (Pielke, 2002 and Hendricks, 2015). The Mann-Kendall test statistic (S statistic) is formulated with the following equation (Bulutet al., 2006; Al-Tahir et al., 2010;Bonfils, 2012andKhomsiet al., 2016).
∑ ∑
The S value in the equation shows almost normal distribution with the mean and variance values stated below in cases where n is greater than or equal to eight (n> 8). The value of n corresponds to the data length in the equation in years. If the value of n is greater than or equal to thirty (n ≥ 30) the z test approaches the t-test. The sign function is indicated by a sign data test performed on an (xj) data set, which is sorted by a set of (xi) and (xj)data as specified in the following equation (Özfidaner, 2007).
{
}
The variance determination of S is determined by the following equation:
∑
In the above equation, the numbers of the relative groups in the data set are denoted by the value of p and the connected observations in a series i are indicated by the value of t. The use of the collection term shown in the equation only occurs if there is observation in the data.
series corresponding to the null hypothesis (H0), it shows the standard normal
distribution with a mean of zero and variance (Özfidaner, 2007).
{ √ √ }
Null-hypothesis is accepted when the 1-α/2 condition is satisfied, while Z is indicated by the plus (+). The Z value indicated by minus (-) reflects the decrease. Depending on the results of the Mann-Kendall test the corresponding value of Z value was determined as 1.96 for the two-way 95% confidence interval.
Mann-Kendall Correlation Coefficient
The sequential analysis of the Mann-Kendall u (t) test sample value was used to determine the beginning of the trend in the observation sequences with significant trend and the point or points of change in the observation sequence (Türkeş, 2013 Yılmaz, 2018 and Gozalan 2019) and test results were shown graphically.
Test sample value t:
∑
The average of distribution function E (t):
and has variance (t):
Equations are given. Test sample value u (t): [ ] √
As shown in the equation, the null hypothesis is rejected for the large values of u (t) according to the bi-lateral shape. If the obtained u (t) value is significant at 95% or 99%, trend can be determined depending on whether u (t) is greater than or equal to 0.
If u (t)> 0, the trend is increasing, if u (t) <0, the trend is decreasing. The determination of the u(t') test sample value was also determined in a similar way to u(t') by applying the inverse of the current process performed in series (Yılmaz, 2018).
The successive analysis of the Mann-Kendall rank correlation test was used to graphically show the trends detected in the temperature and precipitation from the u(t) and u(t‟) test sample values. While the curves of u(t) and u(t') trend values on the charts intersect at one point, they provide evidence for the existence of a significant trend. The intersection of u(t) and u(t') several times indicates that there are no trends in the sequence. In order to determine the starting date of the trends in the direction of increase or decrease, attention is paid to the points where the u (t) and u (t‟) curves overlap (Papadimitrio, 1991).
Spearman's Rho Test
The Rho test of Spearman is one of the tests to detect the correlation between two observation sequences. It is used because it has fast and simple application in determining the Simple Linear trend in observation series. The determination of Rxy
which represents the sequence statistics, takes place from small to large, or from large to small. The rs correlation coefficient symbolizes Spearman's Rho test statistic
(Gümüş, 2006, Zarei, 2017 and Gozalan 2019). Spearman's Relationship Coefficient:
[∑ ]
The rsdistribution approach is normal when n> 30. Accordingly, normal distribution
tables were used to determine rs test statistic. The Z value corresponding to the test
statistic of rs is calculated by the following equation (Gümüş, 2006).
√
The higher Z value obtained as a result of the equation compared to the Zα / 2 value
shown in the standard normal distribution tables at the α significance level is the evidence for the existence of a trend towards increase or decrease.
the sample value is significant then the trend is calculated to be increased if rs> 0 while
trend decreases in the direction of decreasing if rs<0 (Türkeş, 2013).
Sen's Trend Slope Method
Sen's trend slope method is a nonparametric statistical method which is used to determine the change of the slope in unit time in the case of determination of Simple Linear trend presence for time series. The lack of data in the time series does not constitute an obstacle to the implementation of this test. The size of the trend observed in the time series is calculated by the following formulas in the following order (Demirci, 2008, Karpouzos, 2010, Aziz, 2017 and Ay, 2017).
The Qi value corresponds to the data between xi and xk. (xj), and (j)are values that
were determined at the time, (xk), and (k) are the time determined value, and (j) is the
next time for the (k) time. N value is calculated by N= n(n - 1)/2 equation and the median values of N and Qiare used to determine the trend of Sen (Polat, 2017 and Saplıoğlu, 2013).The N values of the Qi are primarily sorted from small to large, and
then the trend curve of Sen is calculated by the following equation:
( )
And if N is an even number, the amount of change of the slope in time series is calculated using the following formula:
( )
Simple Linear Regression Analysis
Simple linear regression analysis is a parametric method, assuming that the data is normally distributed. With this test, the relationship between the variables determined as X and Y is tried to be analyzed whether there is a linear trend (Cosun, 2008 and Şen, 2013).
The simple linear regression equation is established as y = ax + b, where a is constant in the simple linear regression equation that indicates the direction and
amount of change. A positive value shows change in the direction of change, a negative value indicates that the change occurred in the direction of change. The fact that a is not far from zero shows that there is no change (Bulutet al., 2006).
In the regression analysis, the cause-effect relationship between two or more variables is examined in order to make predictions or to make inferences and this relationship is characterized by a regression model which is a mathematical modeling model (Yılmaz, 2018). It can be expressed in the model using the equation (Agresti, 2011):
where E indicates a mean; Y |x, which indicates possible values of Y when x is restricted to some single value; B0, is the intercept parameter, and B1 is the slope
parameter.
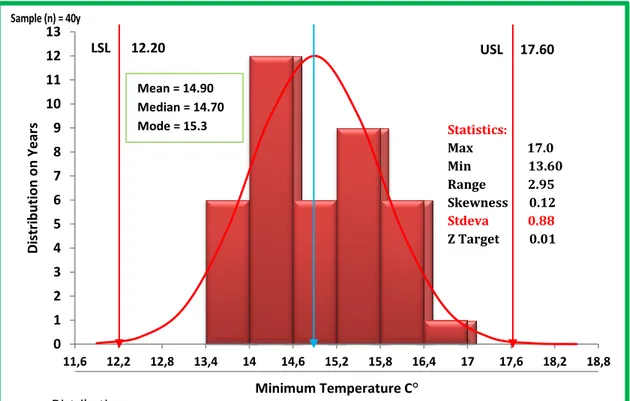
Statisticswithin the Constraints of ExcelURL:1and Analyze data using the XmR Trend Control Chart in Excel with (QI Macros)URL:2.
In the application of (QI Macros) run chart is used to study collected data for trends or patterns over a specific period of time. A run chart will help:
Monitor data over time to detect trends.
The Figures (Charts) is a record of a process over time.
The vertical axis represents the process being measured precipitation. The horizontal axis represents the time units during which measurements are made. Middle of the chart is average or average, and here are the formulas used to
calculate Figure:
UCL: mt + b + A2R CL: mt + b
LCL: mt + b – A2R
This sample format explains the above codes:
The Charts calculates the fit of the data to the trend, As follows: -R² gives the fit of the line to the trend. Greater than 0.80 is a good fit.
-Ryx is the linear correlation coefficient. Compare to probability for df = n -2.
-The slope is the positive or negative slope of the trend. -Sigma is the estimated standard deviation of R bar/d2.
-Probability is a critical value for Ryx. If Ryx > Probability then a statistically significant correlation exists.
Figure 1. Explaining How to Extract Results from Trend Control Chart
Control Limits are used to determine if a data is stable or not. Control limits are the "key ingredient" that distinguish control charts from a simple line graph to the charts of trend analysis and are calculated from input data. The years and stations that did not show a trend through the upper and lower limit line of the precipitation are identified by positive control line and the negative control line (two red lines).
These four equations were applied to annual Precipitation Data, and equations are as follows: (1)
*∑ ( ∑ ∑ )+ *∑ ( ∑ )+ (2)
∑ (3)
(4)
∑
∑
Standard Precipitation Index (SPI)
(McKeeet al., 1993) developed the Standardized Precipitation Index (SPI) which can be calculated at different time scales to monitor droughts in the different usable water resources. Due to its robustness it has already been widely used to study droughts in different regions like USA, (Hayes,1999), Italy (Bonaccorso,et al., 2003), and Turkey (Sönmezet al.,2005). Present study tries to identify the droughts locations in the
northern half of Libya as lack of rainfall and its fluctuation has had a significant impact on the region.
The computation of SPI requires long-term data on precipitation to determine the probability distribution function which is then transformed to a normal distribution with mean zero and standard deviation of one. Thus, the values of SPI are expressed in standard deviations, positive SPI indicating greater than median precipitation and negative values indicating less than median precipitation (McKee et al., 1993).
The Standardized Precipitation Index (SPI) method converts the precipitation parameter into a single numerical value in order to define the drought of regions with different climates. This method is obtained by the following equation 1 by dividing the difference from the mean (Xi) to the standard deviation (σ) in a selected time period.
Climate Classification of ERINÇ
Evaluating average temperatures when a region is considered wet or dry leads to incorrect results. For this reason, it is necessary to base the precipitation activity on the average maximum temperatures rather than the average temperatures. In the determination of Erinç precipitation activity, temperatures below 0 degree are excluded due to the fact that evaporation has not occurred.
It is possible to reach the right conclusions on Turkey's climatic conditions by using Erinç precipitation activity index (Erinç, 1996). For this reason, this index was utilized when the climate classification for North of Libya stations was carried out.
Average i iX
X
SPI
Table 2.Standardized Precipitation Index (SPI) Values
SPI Values Drought Category
≥ 2 Very Heavy Rainy 1.50 ~ 1.99 Very Rainy
1.00 ~ 1.49 Moderate to Moderate 0.99 ~ 0 Normal
0 ~ -0.99 Close to Normal Drought -1.00 ~ -1.49 Moderate-severe Drought -1.50 ~ -1.99 Severe Drought
Turkish climate scientist Erinç developed the equation in 1965 to identify simple Bora drought index is as follows:
1. The annual drought index:
2. To find the monthly Drought Index:
(P) it means amount precipitation in year or month, and (TOM) mean The average temperature in the year or month. And this table identifies climate rankings as a result of the previous equations. URL: 5
Table 3.Determining Drought Indicators in Erinç's Equation
Index value Climate class vegetation
From 8 small Very Arid Desert
8- 15 Arid Desert Steppe
15- 23 Semi Arid Steppe
23- 40 Semi Humidity Dry Forest
40- 55 Humidity Humidity Forest
From 55 upper Very Humidity Very Humidity Forest Source: URL:2.
Climate Classification of L. EMBERGER (Coefficient of Thermal – Rain) There are two equations for Emberger, the first equation of the summer months is used for total amount of rain for months of June, July, and August with the highest temperature during these months. The second equation is used in annual average maximum temperature and the minimum temperature and average amount of rain in area (Neira, 2006). In the study area, the second equation will be used, because rainfall in the summer is almost completely absent. The equation is as follows:
Q = Coefficient of thermal rain. P = Total annual rain.
M = Average maximum temperature. m = Average minimum temperature. 2000 = Constant No.
The index of equation as follows:
Q = < 20 and P = < 300 mm = Very arid Mediterranean climate. Q = 20–32 and P = 300- 400 mm = Arid Mediterranean climate. Q = 32–63 and P = 400 – 600 mm = Semi arid Mediterranean climate. Q = 63–98 and P = 600 – 800 mm = Mediterranean climate little rain. Q = > 98 and P = > 1000 mm = Mediterranean rainy climate.
Index of JOHANSSON for Continental Climate and Oceanity Climate The climatic equations of the Continental and Oceanity are important in the study area. The study area comprises of two geographically different regions. One region has continental climate (Desert) while the other region possesses marine climate that include the coastal area of the Mediterranean Sea. Therefore, the Johnson equation will be used to determine the difference between Continental and Oceanity areas.
The Johansson Continentality Index is used for the climatic classification between continental and oceanic climates. The index is calculated by the following formula (Toroset al., 2008).
Where E is the annual range of monthly mean air temperatures, in (°C), (difference between the maximum and minimum monthly mean air temperatures) and Sin ƒ is the latitude of the stations. The value of the annual difference of maximum and minimum air temperature is used to determine the Continentality of the climate. The climate is characterized as marine when k varies between 0 and 33, as continental when k varies between 34 and 66, and exceptionally continental when k varies between 67 and 100.
Index of KERNER for Continental Climate and Oceanity Climate
Kerner was motivated by the fact that in marine climates the spring months are colder than the autumn months which led to formulation of the Thermodynamic fraction (Baltas, 2007).
Where To and Ta are the October and April mean values of air temperatures,
respectively. E is the annual range of monthly mean air Temperatures in (°C). Small or negative values of k1 imply a continental climate, while larger ones imply Oceanity, More specifically, in the present study, when the Kerner Oceanity is higher than 10 the climate is characterized as an oceanic. The following table and graph shows the branches of the equation and the values in Study areas.
The index of equation as follows: O - 33 Oceanity climate. 34 - 66 Continental climate. 67 - 100 very Continental climate.
VI. PREVIOUS STUDIES
Some related studies to the subject of research are given below:Table 4. Some Studies in the Scope of Trend Analysis Researcher Name
and Year The Topic Method
Papadimitrio(1991)
Some Statistical Characteristics of Air
Temperature Variations at Four Mediterranean Stations
Mann-Kendall Pattern Correlation Test
Pielke (2002)
Evaluating regional and local trends in temperature: an example from eastern Colorado, USA.
Mann-Kendall's test
Çiçek (2003) The Statistical Analysis of Precipitation in Ankara
Wald-Wolfowitz Serial Correlation, and Mann-Kendall Norrant (2006) Monthly and Daily Precipitation Trends in The
Mediterranean (1950-2000) Mann-Kendall's test
Cosun (2008) Climate Change Trend Analysis in
Kahramanmaraş Province
Mann- Kendall Test and Linear Regression test
İçel(2009)
Trend Analysis for Temperatures and Precipitation in Eastern Coast of Mediterranean in Turkey
ANOVA, and Mann-Whitney U Karpouzos(2010) Trend Analysis of Precipitation Data in Pieria
Region (Greece)
Mann-Kendall and Sen's Slope Al-Tahir(2010)
Statistical properties of the Temperature, Relative Humidity, and Solar Radiation in the Blue Nile-Eastern Sudan Region
Mann-Kendall's test
Bahadır (2011)
Determination of Seasonal Changes of Rainfall in Trabzon and Rize with Marginal and Matrix Methods and Trend Analysis
ARIMA
Nalley (2012)
Trend Analysis of Temperatures and
Precipitation Data Over Southern Ontario and Quebec Using The Discrete Wavelet
Transform, Master Thesis, McGill University, France.
Mann-Kendall Trend test, and Discrete Wavelet Transform (DWT) Applications on Different Time Series.
Karabulut(2012) Trend Analysis of Extreme Maximum and Minimum Temperatures in the Eastern Mediterranean
Mann-Kendall and Linear Regression Analysis
Karmeshu (2012)
Trend Detection in Annual Temperature & Precipitation Using the Mann Kendall test – A Case Study to Assess Climate Change on Select States in the Northeastern United States.