Contents lists available atScienceDirect
Results in Physics
journal homepage:www.elsevier.com/locate/rinp
In
fluence of 1.25 MeV gamma rays on optical and luminescent features of
Er
3+
doped zinc bismuth borate glasses
Vinod Hegde
a, Nimitha Prabhu
a, Akshatha Wagh
a, M.I. Sayyed
b, O. Agar
c, Sudha D. Kamath
a,⁎aDepartment of Physics, Manipal Institute of Technology, Manipal Academy of Higher Education, Manipal, India bDepartment of Physics, Faculty of Science, University of Tabuk, Tabuk, Saudi Arabia
cKaramanoğlu Mehmetbey University, Department of Physics, 70100 Karaman, Turkey
A R T I C L E I N F O
Keywords: Absorption Erbium
Optically Stimulated Luminescence Thermoluminescence
Scanning Electron Micrograph Trap parameters
A B S T R A C T
Glasses based on 10ZnO-5Na2CO3-10Bi2O3-(75-x)B2O3-xEr2O3with x = (0, 0.1, 0.3, 0.5, 0.7, 1.0) mol%, were
synthesized by melt quenching technique and characterized through optical and luminescent features, before and after irradiating them with high energy (1.25 MeV) gamma rays. The amorphous nature of the glasses and the presence of various structural groups like BiO6, BO3and BO4were confirmed through XRD and FTIR
measurements. Optical properties were studied through UV–VIS–NIR absorption spectra. Decrease in band gap values after gamma irradiation confirmed the creation of color centers in the glass matrix. Thermally stimulated Luminescence (TL) and Optically Stimulated Luminescence (OSL) spectroscopy techniques were used to study the trap centers induced after irradiation. The number of peaks and their trapping parameters were assessed using the Computerized Glow Curve Deconvolution (CGCD). The linearity in dose response proves their suit-ability in usage for dosimeter and shields in radiation zones within the dose.
Introduction
Rare earth (RE) doped glasses occupy a strategic position in the development of new luminescent and optical materials [1,2]. These glasses are famous for their emissions in NIR and visible regions. Er3+
rare earth ion has its potential in green emission devices, IR lasers, Erbium Doped Fiber Amplifiers, etc[1,3]. Different glass matrices like borate, phosphate and silicate containing bismuth were evaluated owing to their ultra-band emission covering 1100–1600 nm. Based on the technological and scientific applications, borate formers have re-markable characteristics. Borate glasses possess high rare earth solu-bility, easy bulk and low cost glass fabrication, high moisture resistance and suitable amorphous matrix for noble optical devices, followed by high melting point and large vibrational phonon energy which makes visible up conversion detrimental[4,5]. Heavy metal oxide glasses have the features of high refractive index, high density and excellent radia-tion shielding properties [6,7]. Bismuth-erbium co-doped zeolite showed very good emission due to enhancement of Er3+ions after
in-corporation of bismuth [8]. Europium doped bismuth borate glasses were found to be stable as radiation shielding glass materials[2]. Ad-dition of ZnO to matrix further increases refractive index and moisture resistance[9].
Recently, usage of radiation on effect of high-energetic X-rays or
gamma photons for various glasses have increased of interest owing to having basic applications such as space technology, agriculture, nuclear engineering, photonics, healthcare and medical products[10,11]. RE doped glasses derived in opticalfiber structure have a usage area in nuclear and space applications where they are exposed to high energy radiation. The basic issues in choosing a superior shielding feature without affecting optical fiber performance are: radiation, mechanical loads, vacuum, high temperature difference and atomic oxygen (O) corrosion in low earth orbit. Effect of gamma radiation on glasses is applicable in thefield of photonics, space, nuclear science and health-care. Glasses are also developing as high level waste disposal con-tainers, radiation shields and dosimeters[10,11]. In this paper, influ-ences of irradiation by gamma photons on Er3+doped zinc bismuth borate glasses are surveyed to study the response of glasses to gamma irradiation. These changes help in examining their appropriateness as shielding and dosimetry materials. After irradiation, the defects oc-curred in the glass system is illustrated with help of Thermo-luminescence (TL) and Optically Stimulated Luminescence (OSL) techniques.
Experimental
Series of Er3+doped zinc bismuth borate glasses: 10ZnO-5Na 2
O-https://doi.org/10.1016/j.rinp.2019.02.003
Received 31 December 2018; Received in revised form 29 January 2019; Accepted 1 February 2019
⁎Corresponding author.
E-mail address:[email protected](S.D. Kamath).
Available online 07 February 2019
2211-3797/ © 2019 Published by Elsevier B.V. This is an open access article under the CC BY-NC-ND license (http://creativecommons.org/licenses/BY-NC-ND/4.0/).
10Bi2O3-(75-x)B2O3-xEr2O3where x = (0, 0.1, 0.3, 0.5, 0.7, 1.0 in mol
%) were prepared through melt quenching. The chemicals with purity < 99%, procured through Sigma Aldrich, were used for the preparation of optical quality glasses. Initially, five chemicals (ZnO, Na2CO3, Bi2O3, B2O3,Er2O3) in appropriate weights were mixed in
agate mortar and heated in Proportional–Integral–Derivative [PID] temperature controlled furnace at temp 450 °C for duration of 30mins in order to decarbonize from Na2CO3. Thefinal five components (ZnO,
Na2O, Bi2O3, B2O3,Er2O3) thus produced,once again, were completely
grinded in an agate mortar and melted in Indfurr Electric furnace at temp of 980 °C for duration of 2 h. Post retirement of the melting duration, molten mass was quenched rapidly at temp 350 °C on a stainless steel mould. Samples were annealed for 3hrs at 350 °C. Glasses were then polished using silicon carbide sheets on Chennai Metco Polishing machine. Each transparent glass was made 2 mm thick by polishing. These quality glasses were labeled as ZNBBEr-0, ZNBBEr-1, ZNBBEr-2, ZNBBEr-3, ZNBBEr-4, and ZNBBEr-5, respectively corre-sponding to 0, 0.1, 0.3, 0.5, 0.7 and 1 mol% erbium doping.
Before and after gamma irradiation, the polished glasses with equal thickness of 2 ± 0.1 mm were analyzed utilizing different spectroscopy methods. Perkin Elmer lambda 750 s double beam spectrophotometer with resolution of 1 nm was used to record absorption spectra in the wavelength range 250–1800 nm. A 60Co radio-isotope source with a
dose rate of 5 kGy/hour at room temperature was used for irradiation of the samples. The glasses were put in a dosimetric point to expose to same sequence to total absorbed dose of 0.25 to 50 kGy with mean photon energy of 1.25 MeV. Thermo-luminescence properties of the glasses were recorded using automated RISØ TL/OSL reader DA-20.
Results and discussion
Initially, the basic parameter namely the density of the sample was calculated using the formula
= − ρ W ρ W W a a b b (1)
where WA (weight of glass in air), WB (weight of glass in distilled
water), ρb (density of distilled water). The density values of the ZNBBEr-0, ZNBBEr-1, ZNBBEr-2, ZNBBEr-3, ZNBBEr-4, and ZNBBEr-5 glasses were respectively found to be 3.3056, 3.3287, 3.4159, 3.4558 3.5998 and 3.6840. This increase in density is due to replacement of low density B2O3element (2.46 g/cm3) by high density Er2O3element
(8.64 g/cm3).
UV–Vis-NIR absorption spectra
The spectra consists of nine electro static and spin orbit interaction of 4f-4f energy level transitions from the ground state4I
15/2to various
excited states such as2G
11/2,2H9/2,4F3/2,4F5/2,4F7/2,2H11/2,4S3/2,4F9/ 2, 4I13//2, respectively observed at 381 nm, 410 nm, 440 nm, 450 nm,
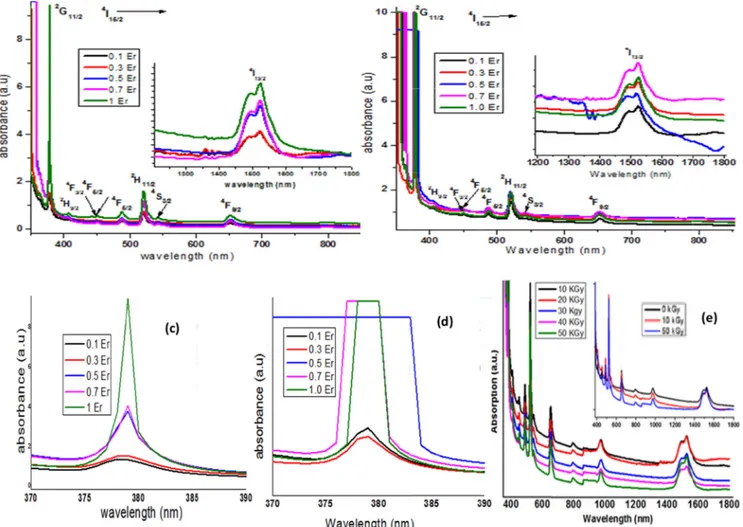
485 nm, 514 nm, 532 nm, 653 nm and 1493 nm.Fig. 1(a) shows over-laid absorption spectra in UV–Vis-NIR of erbium doped zinc bismuth borate glasses pre gamma rays irradiation. The intensity of each ab-sorption peak gradually increased with increasing Er3+addition into the matrix. Overlaid absorption spectra in UV–Vis-NIR of these glasses after 50 kGy gamma rays irradiation is given inFig. 1(b). Intensity of each peak reduced slightly post irradiation. This may be due to the formation of NBOs which are responsible for increasing the total ab-sorption of the glass.Fig. 1(c &d) show overlay of an UV absorption peak at 385 nm (2G11/2) pre and post 50 kGy gamma irradiation. Pre
irradiation, the intensity of this peak continuously increased with in-crease in Er3+ions without any shift in the peak position. After
irra-diation, peak intensity slightly improved up to 0.3 mol% and increased drastically after 0.3 mol%, reaching a saturated value and the absorp-tion edge was significantly red shifted. This peak was completely sup-pressed for higher concentrations (0.5, 0.7 and 1.0 mol%). This
observation clearly shows the strong increment in the total glass ab-sorption of the glass due to NBOs formation in the network upon irra-diation. Fig. 1(e) depicts overlaid absorption spectra of 1.0 mol% Er3+doped zinc bismuth borate glasses irradiated with 10–50 kGy. Peak
intensity decreased with dose and was found to be minimal for 50 kGy irradiated glass. This clearly indicates the increase in the total absorp-tion post gamma irradiaabsorp-tion. It is due to the formaabsorp-tion of trap/electron centers in the glasses after photons interactions. We have presented the properties of the trap/electron centers studied through Optically Sti-mulated Luminescence (OSL) and Thermo Luminescence (TL) techni-ques in the later part of this paper.
Nephelauxetic ratioβ and bonding parameter δ corresponding to the observed absorption bands were calculated[1,6].
Positive values of δ pre and post gamma irradiation (Table 1), clearly indicates that covalent bond between Er3+ions and surrounding ligands continue even after irradiation.
The study of optical absorption and band edge is a helpful method for getting information about the band structure and energy gap of crystalline and amorphous materials[4,12]. Indirect band gaps of the samples were obtained by Davis and Mott relation[4,12].
The plot between (αhυ) and energy (hυ) known as Tauc plot has been used to calculate the band gap energy [Eg]. The relationship
be-tween the absorption coefficient α υ( )and the incident photon energy can be written as = − α υ ν υ ( ) A(h E ) h gn (2) where‘A’ is an energy independent constant, ‘Eg’ is the band gap
en-ergy,‘n’ is a constant equal to ½ for direct band gap semiconductor and 2 for indirect bad gap semiconductor[4,12]. The value of‘α’ is obtained from the relation:
=
α υ( ) 2.303A/t (3)
where‘A’ is the absorbance and ‘t’ is the thickness of the glass sample. The variation of (αhυ)(1/2)versus the photon energy (hυ) plot for the
glass sample were not a linear one at the absorption edge which con-firms that the sample has indirect optical band gap energy[4,12]. The optical band gap energies were obtained from extrapolating the straight portion of the (αhυ)(1/2)versus (hυ) plot on the (hυ) axis at
=
α υ
( h )(1/2) 0 (4)
The value of (hυ) at the point where (αhυ)(1/2) becomes zero as
shown in above formula yields a direct measure of the optical band gap energy[4,12].
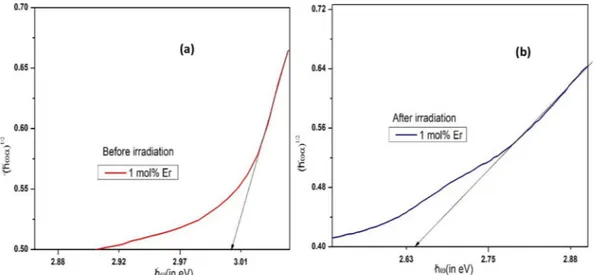
Fig. 2(a & b) show Tauc’s figure by plotting αhν( )1/2v/shν for
ZNBBEr-5 glass.
Optical band gap values were obtained by extrapolating the linear region of the curve to the absorption at(αhν)1/2=0. These values for ZNBBEr-0, ZNBBEr-1, ZNBBEr-2, ZNBBEr-3, ZNBBEr-4, and ZNBBEr-5 glasses, as shown inTable 2were found to be 2.91, 2.98, 2.99, 3.00, 3.00 and 3.00 eV respectively. Their values were 2.91, 2.64, 2.65, 2.74, 2.61 and 2.64 eV after 50 kGy gamma irradiation. Thus, band gap va-lues post irradiation was found to be slightly lesser than their respective values pre irradiation except for undoped glass. This decrease reveals increase in the creation of localized energy states between conduction and valence bands due to the formation of NBOs post irradiation[6,10].
Thermally stimulated luminescence (TL)
As know, the atoms in any glass are ionized when interacting bound electrons with high-energetic photons. This phenomenon leads to pair productions (electron-hole) which both have energy states within the forbidden band of the glassy materials and trapped at pre-existing de-fects. Recombination of charges results in thermo-luminescence glow curve when heat stimulates the glass.
Fig. 1. . Overlaid absorption spectra in UV–Vis-NIR of erbium doped sodium zinc bismuth borate glasses (a) before and (b) after 50 kGy gamma rays irradiation (c) & (d) overlaid UV absorption peak at 385 nm (2G
11/2) before and after 50 kGy gamma irradiation. (e) Overlaid absorption spectra of ZNBBEr-5 glasses irradiated with
10–50 kGy. Table 1
Observed band positions, calculated average Nephelauxetic ratio (
−
β), bonding parameter (δ) of 10ZnO-5Na2CO3-10Bi2O3-(75-x) B2O3-xEr2O3glasses pre and post
irradiation.
Band Positions (in cm−1)
Transitions Aqua ion ZNBBEr-1 ZNBBEr-2 ZNBBEr-3 ZNBBEr-4 ZNBBEr-5
4I1 5/2→2G11/2 Pre 26,315 26,246 26,385 26,385 26,385 26,385 Post 26,385 26,315 – – – 4I1 5/2→4H9/2 Pre 24,390 24,509 24,570 24,570 24,570 24,570 Post 24,570 24,630 24,691 24,570 24,570 4I1 5/2→4F3/2 Pre 22,727 22,624 22,675 22,573 22,573 22,573 Post 22,675 22,624 22,624 22,624 22,624 4I1 5/2→4F5/2 Pre 22,222 22,172 22,172 22,172 22,172 22,172 Post 22,172 22,172 22,222 22,172 22,172 4I1 5/2→4F7/2 Pre 20,618 20,491 20,491 20,491 20,491 20,449 Post 20,491 20,449 20,533 20,449 20,449 4I1 5/2→2H11/2 Pre 19,455 19,157 19,193 19,157 19,157 19,157 Post 19,157 19,120 19,193 19,157 19,157 4I1 5/2→4S3/2 Pre 18,796 18,416 18,416 18,416 18,416 18,416 Post 18,416 18,416 18,416 18,450 18,450 4I1 5/2→4F11/2 Pre 15,313 15,313 15,313 15,313 15,337 15,337 Post 15,290 15,197 15,313 15,319 15,319 − β Pre 0.9972 0.9989 0.9988 0.9988 0.9999 Post 0.9947 0.9971 0.9976 0.9945 0.9945 δ Pre 0.0028 0.0011 0.0012 0.0011 0.0001 Post 0.0053 0.0029 0.0024 0.0054 0.0054
with 1.25 MeV gamma photons with 1 Gy, 100 Gy, 500 Gy, 1 kGy, 2 kGy, 3 kGy, 4 kGy, 5 kGy, 10 kGy, 20 kGy, 30 kGy, 40 kGy, 50 kGy doses to study the thermoluminescence characteristic of the sample. The TL glow curve of glass sample was obtained after treating them with heat at a rate of 2 K/sec using RISO-20 TL Reader. Investigations on the influences of gamma ray photons through TL glow curves were recorded in open window spectral region with BG-39filter used. Fig. 3(a) shows the overlaid TL glow curves of 1 mol% erbium doped glass after gamma irradiation. The TL glow curves obtained were broad which is because of the overlapping of several peaks. Computer Glow Curve Deconvolution (CGCD) method has been utilized for deconvo-luting the TL glow curve. With help of this method, it has deconvoluted the curve by Levenberg-Marquardt algorithm using Wolfram Mathe-matica program. Kitis general order relation was selected for least squarefitting.
Using activation energy (E), the halflife (τ) and frequency factor (s), Figure of Merit (FOM) of the trapped electron at any temperature was determined[6].
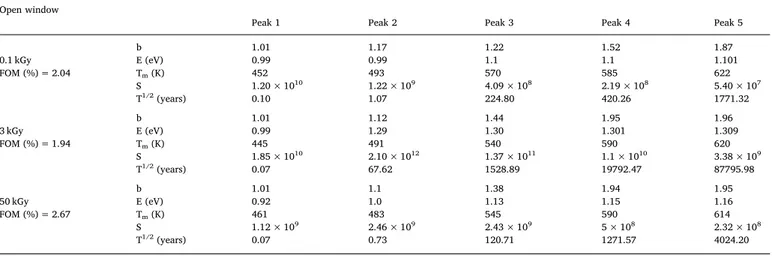
In order to study the component peaks, the curve of TL glow has been deconvoluted for the dose values of 0.1–50 kGy using Kitis general order equation. FOM value less than 5% generally proffers, which the curve is wellfitted. In this study, this parameter is below 3% for the irradiated glasses. The values of b, E, Tm, S and T1/2 for 0.1, 3 and
50 kGy are tabulated in theTable 3. A plot of variation of the TL in-tensity with gamma ray doses of the two peaks obtained at 491 K and 619 K inFig. 3(a) was plotted inFig. 4.
The deconvoluted 3 kGy gamma dose sample is represented in Fig. 3(b). Each TL glow curve wasfitted with five component peaks at temperatures 445 K, 491 K, 545 K, 590 K, 620 K with FOM values. Half-life of the charges trapped at 491 K is around 68 years and at 620 K is in the order of some thousand years. Trap center response at 590 K and 620 K TL glow peaks show higher lifetime. This indicated that some structural defects were present pre irradiation.
Fig. 2. Tauc’s plot illustration of indirect allowed transition of ZNBBEr-5 glass (a) before irradiation (b) after 50 kGy gamma irradiation.
Table 2
Calculated band gap values pre and post irradiation for 10ZnO-5Na2CO3-10Bi2O3-(75-x) B2O3-xEr2O3glasses.
Sample code ZNBBEr-0 ZNBBEr-1 ZNBBEr-2 ZNBBEr-3 ZNBBEr-4 ZNBBEr-5 Band gap (Egin eV) Pre-irradiation 2.91 2.98 2.99 3.00 3.00 3.00
Post-irradiation 2.91 2.64 2.65 2.74 2.61 2.64
Optically stimulated luminescence (OSL)
Recombination of charges causes luminescence when stimulating any glass by light. The traps with low-energy keep electrons and holes loosely and at room temperature, the charges in the traps are easily de-trapped[13]. However, in order to release tightly the bound electrons from the defect centers, the stimulant energy (UV/Blue) in the form of optical energy is needed. In this process, OSL glow curve indicates the luminescence observed by optical stimulation. As a stationary wave-length/energy is given in OSL, the traps which have energy trap depth lower than the any energy will be stimulated with an exponential re-duce in the charge concentrations in traps resulting in OSL decay curve. To extract the low energy unstable traps, the glasses were warmed up to 60 °C. The luminescence decay curves were recorded in UV/Blue win-dows with Hoya U-340 (7.5 mm total thickness & transmission range 270–380 nm) using BG39 + CS7-59 filters respectively in RISO-20 OSL reader.
Overlaid OSL decay curves for gamma photon irradiated with doses of 0.25–50 kGy on ZNBBEr-5 glass in blue and UV windows are shown in Fig. 5(a & b). It was observed that, OSL counts decreased ex-ponentially with increase in the radiation dose.
The OSL decay curves were deconvoluted to get information on
Table 3
Kinetic parameters viz. b-kinetic order, E-activation energy (eV), Tm-peak temperature (K), S-frequency factor (s−1) andτ1/2-, the half life (years) of charge in trap
center of ZNBBEr-5 glass recorded in open window for different gamma radiations doses.
Open window
Peak 1 Peak 2 Peak 3 Peak 4 Peak 5
b 1.01 1.17 1.22 1.52 1.87 0.1 kGy E (eV) 0.99 0.99 1.1 1.1 1.101 FOM (%) = 2.04 Tm(K) 452 493 570 585 622 S 1.20 × 10¹⁰ 1.22 × 10⁹ 4.09 × 10⁸ 2.19 × 10⁸ 5.40 × 10⁷ T1/2(years) 0.10 1.07 224.80 420.26 1771.32 b 1.01 1.12 1.44 1.95 1.96 3 kGy E (eV) 0.99 1.29 1.30 1.301 1.309 FOM (%) = 1.94 Tm(K) 445 491 540 590 620 S 1.85 × 10¹⁰ 2.10 × 10¹² 1.37 × 10¹¹ 1.1 × 10¹⁰ 3.38 × 10⁹ T1/2(years) 0.07 67.62 1528.89 19792.47 87795.98 b 1.01 1.1 1.38 1.94 1.95 50 kGy E (eV) 0.92 1.0 1.13 1.15 1.16 FOM (%) = 2.67 Tm(K) 461 483 545 590 614 S 1.12 × 10⁹ 2.46 × 10⁹ 2.43 × 10⁹ 5 × 10⁸ 2.32 × 10⁸ T1/2(years) 0.07 0.73 120.71 1271.57 4024.20
Fig. 4. Plot of variation of TL intensity with gamma ray doses for peaks at 491 K and 619 K respectively.
Fig. 5. Overlaid OSL decay curves of 0.25–50 kGy gamma irradiated ZNBBEr-5 glass in (a) blue and (b) UV window. (For interpretation of the references to color in thisfigure legend, the reader is referred to the web version of this article.)
count of traps contributing towards OSL. The count in OSL components can be lower than the count of the observed TL traps since all of the TL traps may not be the OSL traps. In addition, some of the traps may have nearly same photo-ionization cross-section owing to which their decay quantities are nearly same and then, may not be recognizable by mathematical deconvolution. A decay equation was used for the ana-lysis as given below:
∑
= A e− IOSL i i x Ti/ (5) where IOSL, Ai and Ti’s represent the OSL intensity, the amplitudecoefficients and the lifetime of traps, respectively.
With help of the exponential decay equation applied in Origin program, the components have removed byfitting the curves of OSL decay. Thefit parameter was obtained by minimum Chi-square value. Normalized decay curves fitted well to 2 exponentials decay
Fig. 6. . (a) Exponential second order decayfitting for OSL curve of 3 kGy gamma irradiated ZNBBEr-5 glass in blue window (b) Decay components for the same curve. (For interpretation of the references to color in thisfigure legend, the reader is referred to the web version of this article.)
Fig. 7. . (a) Exponential second order decayfitting for 3 kGy gamma OSL UV window for ZNBBEr-5 glass (b) Decay components for the same curve.
Table 4
Amplitudes and time constants for OSL in blue window.
Gamma dose (kGy) A1 T1 A2 T2
0.25 0.29 5.43 0.21 12.16 0.5 0.58 4.22 0.10 25.58 1 0.22 0.37 0.45 7.07 2 0.56 2.32 0.32 11.77 3 0.64 2.42 0.30 11.27 4 0.62 3.97 0.10 29.54 5 0.34 11.17 0.60 2.35 10 0.60 2.10 0.35 9.82 20 0.30 11.21 0.65 2.38 30 0.59 2.00 0.33 10.05 40 0.32 8.99 0.61 1.87 50 0.25 12.03 0.68 2.49 Table 5
Amplitudes and time constants for OSL in UV window.
Gamma dose (kGy) A1 T1 A2 T2
0.25 0.34 11.42 0.47 1.53 0.5 0.24 10.85 0.71 1.93 1 0.65 2.21 0.27 11.88 2 0.69 1.92 0.25 11.17 3 0.71 1.73 0.25 8.49 4 0.75 2.39 0.20 12.99 5 0.23 10.01 0.71 1.94 10 0.22 10.47 0.75 1.87 20 0.76 1.66 0.20 9.8 30 0.27 7.2 0.68 1.47 40 0.21 9.78 0.76 1.89 50 0.77 1.65 0.19 9.65
components. The deconvoluted OSL decay curves of the 3 kGy gamma irradiated for ZNBBEr-5 sample recorded in blue window are indicated Fig. 6(a & b).Fig. 7(a & b) represent the deconvoluted OSL decay curves of the same glass sample recorded in UV window. The OSL decay curve is formed of two components namely fast and slow component. Theo-retically, the sum of these components is thefitted curve, given by
= − + −
IOSL A e1 1( x/T )1 A e2 2( x/T )2 (6)
where A1and A2are amplitudes, and T1and T2are time constants. The
theoreticallyfitted curves are illustrated inFig. 6(b) and7(b).Tables 4 and 5show the amplitude and time constants for 0.25 to 50 kGy gamma ray doses in the blue and UV windows respectively.
Relative error of OSL intensity for 3 kGy gamma irradiation on ZNBBEr-5 glass was calculated using
=z −z
z
Relative error exp fit
exp (7)
where zexpand zfitare the experimental andfitted values of OSL
in-tensity for the curve respectively. Plots of relative error v/s time in blue and UV windows are shown inFig. 8(a & b) respectively.
TL/OSL process
The gamma irradiation of ZNBBEr-5 glass creates the pairs (elec-tron-hole) by breaking the Bi-O, B-O and B-O-Bi bonds in glass struc-tural units BO3, BO4, and BiO6, respectively. Absorbance study has
confirmed the formation of radiation-induced trap centers which cap-tures the charges (-e/h) in metastable states within the forbidden gap. In borate glasses, the bridging and non-bridging oxygen are hole centers act as recombination centers for TL/OSL In the present study, the gamma irradiated ZNBBEr-5 glass has exhibited 5 TL components for the TL glow curve at the given temperature between 400 and 700 K. After thermal and optical energy stimulation, the OSL decay curve has represented2 decay components in two windows. Observed TL/OSL result could be the result of recombination of electrons from traps such as metal ions at Bridging Oxygen Hole Centers (BOHC) and Non-Bridging Oxygen Hole Centers (NBOHC) after thermal and optical sti-mulation. At higher doses glow curve intensity is expected to saturate byfilling of charges in the available traps in the irradiated glass. In the present study, after 3 kGy glow peak intensity decreased and peak shifted to higher order temperature (615 K), indicating the formation of defect centers formed during gamma irradiation. These defect centers acted as trap/recombination centers in the glass matrix which may be responsible for dropping of TL intensity for higher gamma doses (> 3kGy). Conversion of boron-oxygen hole center to non-bridging oxygen hole center after high gamma dose irradiation might be the reason for rupturing the TL glow peak at 491 K.
Conclusion
The present study explores the effects of high dose gamma rays ir-radiation on Er3+doped zinc bismuth borate glasses studied through UV–Vis-NIR optical absorption spectra, thermally stimulated lumines-cence and optically stimulated lumineslumines-cence. The values of optical band gap indicated the increase in randomness of the glass network after irradiation. The formation of defect centers in the matrix post gamma irradiation was evident from the shift in the absorption edges spectra. TL glow curve for gamma irradiation showed two peaks obtained at 491 K and 619 K. Deep insight into defect centers in terms of number of traps, their energy, life time in the trap, and activation energy, was obtained by deconvoluted TL spectra. Each deconvoluted TL glow curve of the gamma irradiated ZNBBEr-5glass wasfitted with five TL com-ponents and OSL decay curve showed two decay comcom-ponents after thermal and optical energy stimulation. Linearity in intensity of TL and OSL curves with gamma doses of the glass proves their suitability for radiation dosimeters and shields in radiation zones. The peak centered at 500 K (CP2) in the deconvoluted TL curve, showed linear dose-re-sponse up-to 3 kGy, endorsing these glass as dosimetry material for the estimation of delivered dose in the range 0.25–3 kGy.
Appendix A. Supplementary data
Supplementary data to this article can be found online athttps:// doi.org/10.1016/j.rinp.2019.02.003.
References
[1] Annapoorani K, Suriya Murthy N, Ravindran TR, Marimuthu K. Influence of Er3+ ion concentration on spectroscopic properties and luminescence behavior in Er3+ doped Strontium telluroborate glasses. J Lumin 2016;171:19–26.
[2] Wagh A, Manjunath K, Hegde V, Kamath SD. Gamma irradiation on bismuth borate glasses doped by Eu3+ ions: structural, optical and mechanical investigations. Optik (Stuttg) 2018;160:298–306.
[3] Umar SA, Halimah MK, Chan KT, Latif AA. Polarizability, optical basicity and electric susceptibility of Er3+ doped silicate borotellurite glasses. J Non Cryst Solids 2017;471(August):101–9.
[4] Ashur Z, et al. Concentration dependent luminescence quenching of Er3+-doped zinc boro-tellurite glass. J Lumin 2013;144:139–45.
[5] Swapna K, et al. Visible, up-conversion and NIR (∼1.5 μm) luminescence studies of Er3+ doped zinc alumino bismuth borate glasses. J Lumin
2015;163(March):55–63.
[6] Hegde V, Viswanath CSD, Chauhan N, Mahato KK, Kamath SD. Photoluminescence and thermally stimulated luminescence properties of Pr3+-doped zinc sodium bismuth borate glasses. Opt Mater (Amst) 2018;84(April):268–77.
[7] Hegde V, Wagh A, Hegde H, Vishwanath CSD, Kamath SD. Spectroscopic in-vestigation on europium doped heavy metal borate glasses for red luminescent application. Appl Phys A Mater Sci Process 2017;123(5):302. 1–13.
[8] Bai Z, et al. Efficient near-infrared luminescence and energy transfer in erbium/ bismuth codoped zeolites. Opt Lett 2010;35(11):1926–8.
[9] Nanda K, Kundu RS, Sharma S, Mohan D, Punia R, Kishore N. Study of vibrational
Fig. 8. Relative error plots of OSL intensity in (a) Blue window (b) UV window for 3 kGy gamma irradiated ZNBBEr-5 glass. (For interpretation of the references to color in thisfigure legend, the reader is referred to the web version of this article.)
spectroscopy, linear and non-linear optical properties of Sm3+ ions doped BaO-ZnO-B2O3 glasses. Solid State Sci 2015;45:15–22.
[10] Wagh A, Hegde V, Dwaraka Viswanath CS, Lakshminarayana G, Raviprakash Y, Kamath SD. The effect of 1.25 MeV γ rays on Sm3+doped lead fluoroborate glasses for reddish orange laser and radiation shielding applications. J Lumin
2018;199(March):87–108.
[11] Mohapatra M, et al. Electron beam irradiation effects in Trombay nuclear waste glass. Nucl Instrum Methods Phys Res Sect B Beam Interact Mater Atoms
2011;269(19):2057–62.
[12] Annapoorani K, Basavapoornima C, Suriya Murthy N, Marimuthu K. Investigations on structural and luminescence behavior of Er3+ doped lithium zinc borate glasses for lasers and optical amplifier. J Non Cryst Solids 2016;447:273–82.
[13] Hegde Vinod, Chauhanb Naveen, Kumar Vinayak, Dwaraka Viswanath CS, Mahato KK, Kamath Sudha D. Effects of high dose gamma irradiation on the optical prop-erties of Eu3+ doped zinc sodium bismuth borate glasses for red LEDs. J Lumin 2019;207:288–300.