158
The Utilizing Rock Salt of Inorganic Filler in Medium Density
Fibreboard (MDF) Production
Osman ÇAMLIBEL1* , Mehmet AKGÜL2
1Kırıkkale University, Kırıkkale Vocational School, Department of Materials and Materials Processing
Technology, Yahsihan / Kırıkkale, TURKEY
2Karamanoglu Mehmetbey University, Yunus Emre Campus, 70100 Karaman, TURKEY
*Corresponding author: [email protected]
Received Date: 25.07.2019 Accepted Date: 23.07.2020
Abstract
Aim of study: To research the usage opportunities of the inorganic rock salt mineral in MDF production.
Area of study: The materials were collected rock salt from Çankırı region, wood from the Western
Black Sea region, respectively. The production was performed in a private company in Düzce. The tests were performed at Duzce Forest Faculty Laboratory and Gazi Woodworking Industrial Engineering Laboratory.
Material and methods: In the Asplund Defibrator, chips were baked wtihin 7-7.5 bar vapor pressure and 180 ° C temperature for 4-5 minutes. According to the weight of dry fiber, 1.5% paraffin was given before fibrillation, fibrillation later was given 1% ammonium sulfate solution. Inorganic fillers prepared in a separate tank in order to use rock salt instead of lignocellulosic fibers in the production of 1 m³ MDF. After that urea-formaldehyde glue is prepared as three different solutions which include the rock salt respectively with 3% (20 kg), 6% (40 kg), 9% (60 kg). This press applies 185-190 °C temperature and 32-34 kg/cm² pressure to the mixture material in 270 second pressing time. MDF panels (2100x4900x18 mm) were produced in the process. Physical, mechanical and combustion tests experiments are performed over boards.
Main results: MDF products which were added percent 3 with the rock salt have more performance
than the other MDF panels in this study.
Highlights: The usage of the rock salt with percent 3 is recommended in MDF products.
Keywords: Rock salt, MDF, physical properties, mechanical properties, colour properties, fire
retardants
Orta Yoğunlukta Liflevha (MDF) Üretiminde İnorganik Dolgu
Maddesi Kaya Tuzu Mineralinin Kullanılabilme Olanaklarının
Araştırılması
ÖzÇalışmanın amacı: İnorganik kaya tuzunun MDF üretiminde kullanılabilirliliğini araştırmaktır.
Çalışma alanı: Malzemeler sırasıyla Çankırı yöresinden kaya tuzu, Batı Karadeniz bölgesinden odun toplanmıştır. Üretim Düzce'de özel bir firmada gerçekleştirildi. Testler Düzce Orman Fakültesi Laboratuvarı ve Gazi Ağaç İşleme Endüstri Mühendisliği Laboratuvarından yapılmıştır.
Materyal ve yöntem: Asplund Defibrator'da cipsler 7-7.5 bar buhar basıncında, 180°C sıcaklıkta 4-5 dakika pişirilmiştir. Kuru lif ağırlığına göre liflendirmeden öncesi% 1.5 parafin, liflendirmeden sonra % 1 amonyum sülfat solüsyonu verildi. 1m³ MDF üretiminde lignoselülozik liflerin yerine; inorganik dolgu minerali kaya tuzu kullanmak için ayrı bir tankta hazırlanmıştır. Üre formaldehit tutkalı ile birlikte sırasıyla % 3 (20 kg), % 6 (40 kg), % 9 (60 kg) kaya tuzu solusyonu liflere blow line hattında verilmiştir. Lifler pasta haline getirildikten sonra sıcak preste 185-190°C sıcaklık, 32-34 kg/cm² basınç uygulanarak ve 270 saniyede levhalar üretilmiştir. Presleme sonrasında MDF paneller (2100x4900x18 mm) ölçülerinde üretilmiştir. Fiziksel, mekanik ve yanma testleri gerçekleştirilmiştir.
Temel sonuçlar: Yüzde 3 kaya tuzu katkılı MDF ürünleri bu çalışmadaki diğer MDF panellerinden daha iyi performansa sahiptir.
Araştırma vurguları: Kaya tuzunun yüzde 3 oran ile MDF üretiminde kullanımı önerilir.
Anahtar kelimeler: Kaya tuzu, MDF, fiziksel özellikler, mekanik özellikler, renk özellikleri, yangın
geciktiriciler
Citation (Atıf): Camlibel, O. & Akgul, M. (2020). The Utilizing Rock Salt of Inorganic Filler in Medium Density Fibreboard (MDF) Production. Kastamonu University Journal of Forestry Faculty, 20 (2), 158-174.
This work is licensed under a Creative Commons Attribution-NonCommercial 4.0 International License.
159 Introduction
Rapid population growth in the world, rapidly increasing the demand for wood raw materials and the need for fiber raw materials for developing countries could become a very important problem in the future. The growing population of the world and also developing technology increased the demand for wood-based materials in the last century.
Reduction of natural forest resources and human-made forests, which were limited, caused by the growing importance of non-wood raw materials (Ganapathy, 1997). A lot of scientific and experimental studies are made in our country and in other countries about this topic. The using of the agricultural wastes in the production of wood-based panels as raw materials has become significantly important in the industry.
The study over the production of MDF was performed by using Rhododendron Ponticum L. tree species (Akgul & Camlibel, 2008). Akgul did the research on the MDF production from corn stalks (Akgül, 2009).
In the forest products industry, the wood chips or lignocellulosic materials can be produced smooth-surfaced panels by mixing in suitable proportions with cement, water and chemicals. Wood composite products with binding inorganic materials were generated by using plaster, magnesium cement and Portland cement. Guller produced the inorganic material-binding fiberboards and particle boards (Guller, 2001). Kalaycıoğlu et. al. (2012) performed some studies on the cement composites and wood wool. Ashori & Nourbakhsh (2009) produced the board which had added nanoclays layered silicates as reinforced adhesive with 0%, 2%, 4%, 6%, 8% mixing ratios.
Hafızoglu et al. (1994) researchers have investigated various fire retardants to be used with MDF panels. The effects of fire retardants over the fire performance of MDF and plywood were determined and the results showed that the fire performance of MDF and plywood increased nearly 6.4% and 1.6% respectively. Istek et al. (2013) investigated the effect of fire retardants on the combustion performance of medium-density fiberboards that were coated with mixtures of water, binder, calcite, and
various fire-retardant coatings. Kurt et al. (2012) studied the effects of many boron compounds (boric acid, borax, ammonium etc.) used as fire retardants in wood.
According to LeVan et al. (1990) the inorganic salts such as di-ammonium phosphate, mono ammonium phosphate, zinc chloride, ammonium sulphate, borax, and boric acid are the most common fire-retardant chemicals used for wood. Ozcıfcı et al. (2007) studied the fire properties of laminated veneer lumber (LVL) prepared from beech (Fagus orientalis L.) veneers treated with some fire retardants. According to their study, the lowest temperature and mass loss were obtained for specimens treated with di-ammonium phosphate and boric acid–borax mixture. Tondi et al. (2014) studied the comparison of disodium octaborate tetrahydrate-based and tannin-boron-based formulations as fire retardant for wood structures. When the ratio of fire retardants in wood panels was increased, it was found that their fire performances were improved even more (Tsunoda, 2001). Such improvement is a significant outcome in wood industry.
Usta et al. (2012) examined the effect of some boron compounds for the physical and the mechanical properties of medium density fiberboard (MDF) panels in terms of the fire-retardant properties such as melamine urea-formaldehyde (MUF) resins having different melamine contents (10%, 15%, and 20%). Valcheva et al. (2015) studied the effect of thickness of medium density fiberboard produced of hardwood tree species on their selected physical and mechanical properties.
Xian-Qing et al. (2016) researchers have investigated proper technical process parameters, proper sanding process paratemers at straw particleboard product line. Yang et al. (2019) researchers have investigated the quality evaluation of agricultural and forestry products based on display processing technology is possible. Basta et al. (2006) researchers have investigated assess some starch derivatives as scavengers of free formaldehyde. Basta & El-Saied (2008) studied carboxymethyl cellulose–copper complexes [CMC–Cu (II)], as paper additive in wood pulp paper product. Zuo et al. (2018) studied to
160 reformed the water resistance, fire-retardant performances and mechanical strength of the straw-magnesium cement (SMC) composites. Hosny et al. (1997) researchers have investigated two kind of monologue and complexes of FeCl3, Fe(NO3)3 and Fe2(SO4)3 with hydroxyethyl cellulose (HEC) and carboxymethyl cellulose (CMC).
Basta et al. (2013) studied high performance, agro-based composites from rice straw, using eco- polyalcohol polymer-based adhesive system. Basta & El-Saied (2017) studied the role of activated carbons (ACs), additives to enhance the application of a low-cost urea formaldehyde (UF) adhesive for production of rice straw boards. Basta et al. (2014) studied high-performance rice-straw-based composites, the effect of deashing or dewaxing on the bonding behavior of rice straw fibers by eco-urea formaldehyde.
Özdemir (2019) produced three different minerals (sepiolite, dolomite, and perlite) using five different ratios (3%, 6%, 9%, 12%, and 15%) according to the oven-dry wood fiber weight. Dönmez Çavdar et al. (2019) investigated ammonium zeolite and ammonium phosphate as fire retardants for microcrystalline cellulose thermoplastic composites. Dönmez Çavdar (2020) studied zeolite and natural zeolite, at contents of 4%, 8%, and 12%, based on dry resin amount, as filler fiberboard production with urea formaldehyde and melamine formaldehyde.
The production of MDF was about 4.910 million m³/year in 2018 in Turkey. However, this figure was about 99.443 million cubic meters/year in the World (URL 1). Some researchers handled a lot of study in order to reduce raw materials in MDF industry. These researchers were about the usage possibilities for the rock salt minerals instead of lignocellulosic raw materials.
The inorganic rock salt mineral which has the mixing ratio respectively 0%, 3%, 6%, 9% was produced for boards in MDF production process. In this study, the experimental investigations handled in order
to realize the physical, colour, mechanical and combustion properties of the produced boards which have rock salt mineral according to the reference board.
Material and Method
Used Wood Species in the Production of MDF
The wood species are beech (Fagus orientalis L.), Oak (Quercus robur L) and Pine (Pinus sylvestris L). These species were brought from Düzce province forestry, West Black Sea region and Bolu province, respectively.
Rock Salt
Rock salt has been used as a nutrient since ancient times. Rock salt is the most important product in our modern chemical industry. It consists of Na and Cl ions. It is a mineral with a specific weight of 2.1-2.55 gr/cm³. The melting point of rock salt is 800 ºC and the boiling point is 1412 ºC. It is usually colourless. When rock salt is produced, the colour may be grey, yellow, red, even blue and green. The rock salt, which is used in this study, was brought from the Çankırı region in Turkey. Turkey is very rich in terms of rock salt reserves (URL 2).
Chemicals
The used chemicals which are used in this study are urea formaldehyde, liquid paraffin and ammonium sulphate. These chemicals were brought from Polisan Company in Gebze, Mercan Chemistry in Denizli and another company in Gebze, respectively. Establishment of the Production Process and Determination of the Parameters Affecting the Process
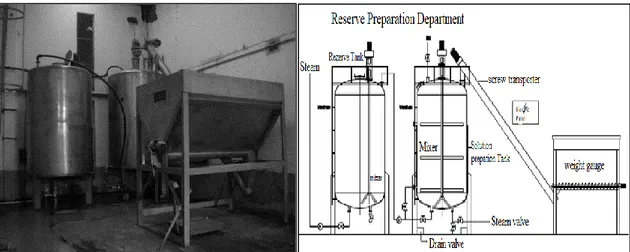
Provided that the other production conditions are the same, the test boards which are produced by changing the ratio of the rock salt mixture are the general-purpose boards. These products were produced by Divapan Integrated Wood Company. The method is showed in Figure 1.
161
Figure 1. Product process flow sheet The resins and other chemicals are
prepared in the glue unit. The rock salt inorganic mineral solution is prepared in the solution preparing tank. After that these chemicals, which are prepared in the tank,
are mixed each other and this mixture is sent blow line. This process and application is the main topic of this study, and these applications are shown in Figure 2.
Figure 2. The preparation of the resin, inorganic rock salt solution and other chemicals Product Processing Parameters
MDF board manufacturer provided these wood species very easily from the western black sea region. Therefore, these tree species were preferred. The acceptance of 70/30 ratio of hardwood/softwood fibers used in the production of MDF provide the properties of MDF boards in optimum quality.
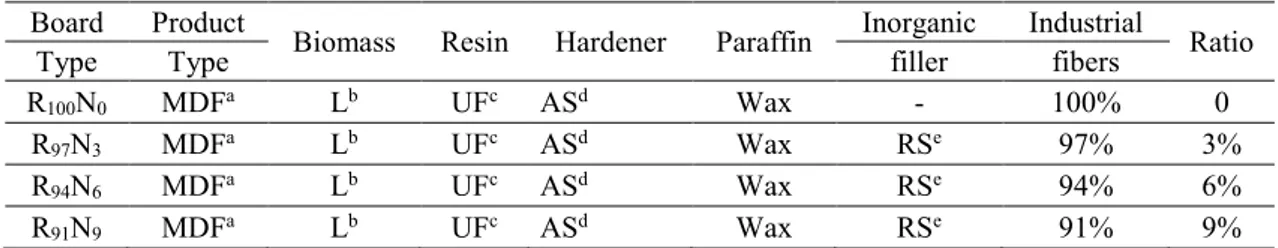
Production parameters are given in Table 1. This table shows the addition of inorganic
rock salt solution and other chemicals to lignocellulosic biomass.
The symbols in Table 1 respectively correspond that R defines the consumed wood fibers for 1 m3 board, N defines the consumed rock salt minerals for 1 m3 board, x and y subscripts define percentage (%) of the mixture.The percent 0% rocksalt in the methodology is control board.
162 Table 1. Board content
Board Product Biomass Resin Hardener Paraffin Inorganic Industrial Ratio
Type Type filler fibers
R100N0 MDFa Lb UFc ASd Wax - 100% 0
R97N3 MDFa Lb UFc ASd Wax RSe 97% 3%
R94N6 MDFa Lb UFc ASd Wax RSe 94% 6%
R91N9 MDFa Lb UFc ASd Wax RSe 91% 9%
aMedium density fibreboard. bLignocellulosic. cUrea formaldehyde. dAmmonium sulphate. eRock salt.
Fiber Analysis
Wood fiber contains 70% hardwoods and 30% softwood fibers in this study. These
fibers are sieved with Imal Ultrasonic Analysis machine. The hot press diagram and analysis of the fiber is shown in Figure 3.
Figure 3. Analysis of the fiber and press diagrams Chemicals Parameters
The urea-formaldehyde glue has the following technical specs:
Solid 65%
Formaldehyde / urea molar ratio: 1.25 Density (at 20 0C g/cm3):1.227 Viscosity (20 0C cps) 185 seconds
Gel time (1000C) (20% (NH4)2SO4): 25-40 sec
pH: 7.5 to 8.5
Free formaldehyde content 0.5% max Methylol groups 12-15%
Average shelf life is 45 days
Product and Hot Multiple Press Parameters Firstly, The hardwood and softwood species had brought from the Western Black Sea forests, and then these species were chopped and stored one by one in silos according to the production parameters.
Chips used in fiber products have been subjected to the process of cooking for 4-5
minutes in Asplund defibrator with the vapour pressure of 7-7.5 bar, and 180 ºC temperature. The solid ratio of the urea-formaldehyde is reduced to 50% solid level in the production process. The colour of ammonium sulphate crystal grains is off-white. It is prepared for hardener with 20% solution, and then it is injected from a single point to blow line. The colour of liquid paraffin is cream and the fat content is up to 2%. The penetration of liquid paraffin is 32, and then it is stored in reserve tank as liquid state. The liquid paraffin is mixed with the maximum ratio up to 1.5% to dry fiber. The mixture whose definition is given above is made with fiber in Asplund defibrator. The hardener, rock salt solution and urea-formaldehyde are injected from blow line to the biomass fiber. Fibers which are included the rock salt and the chemical are dried at the drier line up to 11-12%. Dried fibers are made up to mat in the
163 mechanical station. The mat is produced by pressing in the multi hot press. The pressing parameters are 180-190 0C, 32-34 kg/cm2, 275 sec. The dimensions of the panel are 2100x4900x18 mm. After the panels are produced in the process, the panels are rested in pre-storage on 5 days. The panels are acclimatized here. The level of moisture is adjusted to 7.5%. After these processes, the top and bottom surfaces of panels are sanded with 40-80-120 degrees sandpaper.
Physical Test Methods
Physical properties are tested according to TS 642 ISO 554, (1997), TS EN 326-1 (1999) and the density of panels is tested TS EN 323 (2008). The water absorption test and thickness swelling test of the specimens are measured TS EN 317 (2008). The sheet surface toluene is tested TS EN 382-1 (1999). TS EN 325 (1999) standards, sample thickness and length of specimens are measured by using a digital micrometre and compass with 0.01 mm gradients.
Color Properties
Color measurements are measured by using the tristimulus photoelectric colorimeter Elrepho Spectrophotometer, with a measuring head of 50 mm in diameter according to TS 642 ISO 554 (1997) and ASTM D 2244-07e1 (2007) standards. The Elrepho spectrophotometer measures the color of any material in a three-dimensional color area (Figure 4). This system which is called CIE L*a*b* operates according to the CIE Standard. The part of the coordinate system interested in this study is the first quadrant which corresponds positive values of a* and b*. The color parameters L*, a*, and b* were determined by the CIE L*a*b* method on the surface fiberboards. Their variations concerning the treatment (ΔL*, Δa*, Δb*) was calculated. The color sphere as the circle of the cross-section at L* = 50 was defined. The color difference, ΔE total color difference is the distance between two color points in the color sphere. To the right: Cross section at L* = 50 showing the axis from green to red (a*) and from blue to yellow (b*), the coordinates chroma (C*) and hue [h = arctan (b*/ a*)] is the hues of color: 0 or 360 is red, 90 is yellow, 180 is green and
270 is blue. L* is the lightness; 100 = white and 0 = black. C* is the chroma or saturation; 0 represents only greyish colors and 60. The three measured co-ordinates, L*, a*, and b*, were transformed to L*, C*, and h co-ordinates and ΔE values, according to the Eq (1) (Temiz et al., 2005).
Figure 4. CIELAB the coordinate system shows the color changes in three coordinates which are represented as L*, a* and b* it gives the total color difference equation as
2 2 2E
L
a
b
(1) The L*a*b system has been chosen, since only one color variable is needed to donate hue, i.e. red, green, blue, or yellow and furthermore, this system is easy to refer to our experience of colour characteristics such as lightness, saturation, and hue. Each colour parameter L*,a*,b and ΔE, was measured for each material, time, and temperature. The average colour values, standard deviations, and 5% significance level based on distribution were calculated assuming normal distribution. The lower value of ΔE* indicates that the colour is either not changed or the change is negligible equation (Akgül, 2013).Mechanical Test Methods
Mechanical properties were tested according to TS 642 ISO 554 (1997) and TS EN 326-1 (1999). The specimens were also tested for bending strength TS EN 310 (1999), internal bond TS EN 319 (1999) and
164 screw withdrawal perpendicular to the plane of the panel ASTM D 1037-78 (1994). A universal tester (Imal Mobiltemp shc22, model ib400) was used to assess mechanical properties. The TS EN 326-1 (1999) standard was used to obtain panel samples. Following TS EN 325 (1999) standards, sample thickness and length were measured using a digital micrometre and compass having 0.01 mm gradients.
Combustion Test Method
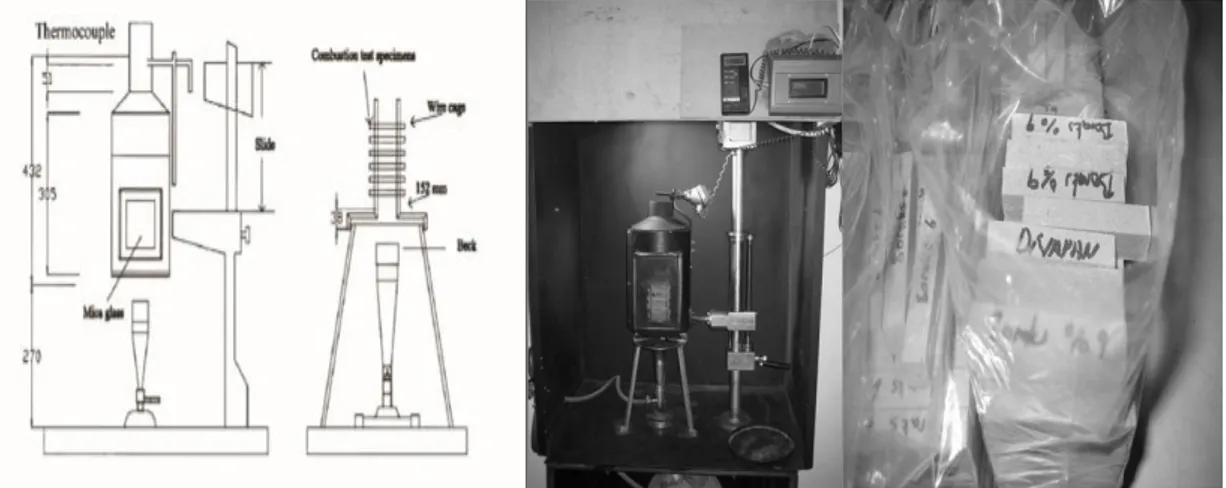
Samples 13x13x76 mm (radial x tangent x length) dimensions were prepared for each type of experiment. Combustion test of rock salt MDF specimens was determined according to TS 642 ISO 554 (1997) and ASTM E 160–50 (1976). Specimens were conditioned at 27±2°C and 30–35 % relative humidity to the targeted equilibrium moisture content of 7 % prior to the combustion test. Twenty four specimens were stored to make 12 layers which formed a square prism (Figure 6).
Figure 6. Combustion test apparatus and samples The fire of the heating flame was derived
from an LPG tank controlled by a sensitive bar gauged valve. The flame was balanced to the standard height before combustion test samples’ frame. The combustion test method was performed subsequently the flame stage (FS), the without a flame stage (WFS), and the glowing stage (GS) according to ASTM E 160–50. (1976). Temperatures were recorded at the combustion column by using thermocouples at 15 and 30 s time intervals for combustion with flame stage, without a flame stage, and glowing stage, respectively. The mass loss of test specimens after combustion test was calculated from the following equation:
Mass loss = Wbf Waf 100
Wbf
(2) where Wbf is the weight (g) of a wood specimen before combustion test, and Waf is
the weight (g) of a wood specimen after combustion test.
The 936 pieces board which have additive rock salt were burned according to standards ASTM E 160–50 (1976). The applied tests are FIC (flame-induced combustion), FIC lux (flame-induced combustion lux), SC (self combustion), SC lux (self combustion lux), SC time (self combustion time), ESC (ember situation combustion), ESC lux (ember situation combustion lux), ESC time, mass loss, IST (initial starting temperature), IST time (initial starting temperature time), IST lux, FC (full Combustion), FC time, (full Combustion time), FC lux (full combustion lux).
The obtained data test results were evaluated by a computerized statistical program composed of an analysis of variance and following ANOVA Duncan tests at the 95 % confidence level by using SPSS 17 statistical software package.
165 Results and Discussion
Physical Properties of Fiberboard
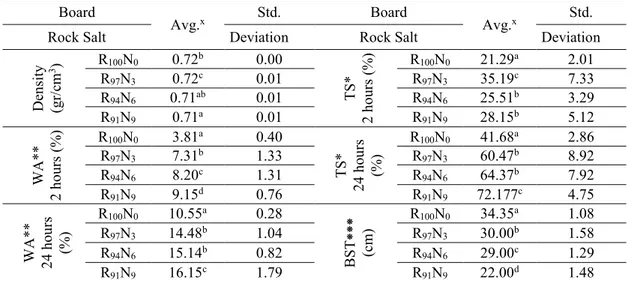
The results of ANOVA and Duncan mean that the separation test for density, the toluene surface, the thickness swelling (TS, 2-24 hours) and water absorption (WA, 2-24 hours) percent of the fiberboards made from rock salt addictive fiber and control fiberboards are shown in Table 2. Each test was measured with 20 different samples in this study.
Physical and surface properties of fiberboards statistical tests (ANOVA) with Duncan's test are made in the 95% confidence interval analysis. The results are shown in Table 2. There is a low degree difference between densities for rock salt added panels (R100N0, R94N6), (R97N3) and (R94N6, R91N9) according to this statistical
analysis result. The results of MDF densities stays in 0.65 g/cm³<MDF<0.85 g/cm³ according to standards TS EN 622-5 (2008). The results of densities stay in standards TS EN 622-5 (2008).
The density of fiberboards affects the used types of lignocellulosic raw materials, density, moisture content, the width of the heartwood, the width of sapwood, fiber structure and fiber dimensions, the annual ring width, types of cells and quantity. Mat moisture of the draft of the laying unit, density, fiber distribution and press parameters affect the density during production. The difference between the density of the fiberboard influences the physical and technological properties
(Ayrılmış, 2000).
Table 2. The results of ANOVA and Duncan mean separation test for density, the toluene surface, the thickness swelling (TS, 2-24 hours) and water absorption (WA, 2-24 hours) percent of the fiber boards are made from rock salt addictive fiber boards and control fibreboard
Board
Avg.x Std. Board Avg.x Std.
Rock Salt Deviation Rock Salt Deviation
Den sity (g r/cm 3 ) R100N0 0.72 b 0.00 TS* 2 ho ur s ( %) R100N0 21.29a 2.01 R97N3 0.72c 0.01 R97N3 35.19c 7.33 R94N6 0.71ab 0.01 R94N6 25.51b 3.29 R91N9 0.71a 0.01 R91N9 28.15b 5.12 W A* * 2 ho ur s ( %) R100N0 3.81a 0.40 TS* 24 h ou rs (%) R100N0 41.68a 2.86 R97N3 7.31b 1.33 R97N3 60.47b 8.92 R94N6 8.20c 1.31 R94N6 64.37b 7.92 R91N9 9.15d 0.76 R91N9 72.177c 4.75 W A* * 24 h ou rs (%) R100N0 10.55a 0.28 BST⁕ ⁕⁕ (cm ) R100N0 34.35 a 1.08 R97N3 14.48b 1.04 R97N3 30.00b 1.58 R94N6 15.14b 0.82 R94N6 29.00c 1.29 R91N9 16.15c 1.79 R91N9 22.00d 1.48
X: The average value of the samples * 95% confidence interval for the average ANOVA. a, b, c, d values with the same letter are not significantly different (Duncan's test); *Thickness swelling; **Water absorption; ⁕⁕⁕Board surface toluene.
The ratio between the densities for the lowest fiberboard with the average fiberboard is always desired between 0.85 to 0.95 values. The efficiency of process parameters and applied hot press diagram in MDF production affect the optimum homogenous density of the fiberboard. If the ratio between the densities for the lowest fiberboard with the average fiberboard goes to one, then this ratio represents that the
density of the fiberboard is the optimum homogeneous density.
The Result of the Swelling in Water for 2 Hours Test of the Fibreboard (TS-2h)
There is a significant difference between (R100N0), (R97N3) and (R94N6, R91N9) according to the percentage of TS-2h. The brief results of Table 2 could be explained as follows.
166 The ratio for this test is 91.62% for R97N3 according to R100N0. Therefore, the percentage of TS-2h increases for R97N3. Similarly, the ratio is 114.65% for R94N6 according to R100N0. Therefore, the percentage of TS-2h increases for R94N6. The ratio is 140.15% for R91N9 according to R100N0. Therefore, the percentage of TS-2h increases for R91N9.
Since the anisotropic swelling of the secondary wall fibers in the cell wall and these fibers in board lie with different directions and angels, the swelling of the board is the smallest. Hydrophobic materials and water-resistant resin could be used in order to increase the resistance of the board against to swelling effect. The percentage of swelling of MDF depends on the density of the board, the chemical structure of inorganic rock salt, the geometrical shape of the rock salt and the amount of the rock salt. The quantity of the surface of the board, the density profile of the board, the adhesion strength between the fibers, the length of fibers, the shortness of the fibers depend on the type and the amount of the paraffin which is added to MDF.
The Result of the Swelling in Water for 24 Hours Test of the Fiberboard (TS-24h)
There is a significant difference between (R100N0), (R97N3, R94N6) and (R91N9) according to the percentage of TS-24h. The brief results of Table 2 could be explained as follows.
The ratio for this test is 37.21% for R97N3 according to R100N0. Therefore, the percentage of TS-24h increases for R97N3. Similarly, the ratio is 43,46% for R94N6 according to R100N0. Therefore, the percentage of TS-24h increases for R94N6. The ratio is 53.04% for R91N9 according to R100N0. Therefore, the percentage of TS-24h increases for R91T9.
Softwood fibers are longer than the hardwood fibers. For softwood fibers the felting ratio, the elasticity ratio and F factor are higher than the hardwood fibers. On the contrary, for hardwood fibers the rigid coefficient, the muhlsteph ratio, the runkel ratio and the bulk density value are higher than softwood fibers. As the contact angle increases, the adhesion ability increases for
softwood fiber according to hardwood fiber. Thus, the entering of the water and moisture between fibers are more difficult softwood fiber according to hardwood fiber. As the amount of hydrophobic material in fiberboard product increases, the swelling in thickness decreases. But there is a negative effect on the adhesion of fibers.
The Results of the Water Absorption for 2 Hours Test of the Fibreboard (WA-2h)
There is a significantly difference between (R100N0), (R97N3), (R94N6, R91N9) according to the percentage of WA-2h. The brief results of Table 2 could be explained as follows.
The ratio for this test is 8.31% for R97N3 according to R100N0. Therefore, the percentage of WA-2h increases for R97N3. Similarly, the ratio is 19.76% for R94N6 according to R100T0. Therefore, the percentage of WA-2h increases for R94N6. The ratio is 32.22% for R91N9 according to R100N0. Therefore, the percentage of WA-2h increases for R91N9.
The Results of the Water Absorption for 24 Hours Test of the Fibreboard (WA-24h)
There is a significant difference between (R100N0), (R97N3, R94N6) and (R91N9) according to the percentage of WA-24h. The brief results of Table 2 could be explained as follows.
The ratio for this test is 45.10% for R97N3 according to R100N0. Therefore, the percentage of WA-24h increases for R97N3. Similarly, the ratio is 54.43% for R94N6 according to R100N0. Therefore, the percentage of WA-24h increases for R94N6. The ratio is 73.17% for R91N9 according to R100N0. Therefore, the percentage of WA-24h increases for R91N9. As the amount of inorganic rock salt increases in MDF production, the absorption of the water in fiberboards increases.
The Results of Toluene on the Surface of the Board Test of the Fibreboard (BST)
There is a significant difference between (R100N0), (R97N3), (R94N6) and (R91N9) and according to the percentage of toluene on the surface of the board test. The brief results of Table 2 could be explained as follows.
167 The ratio for this test decreases 14.50% for R97N3 according to R100N0. Therefore, the percentage of BST decreases for R97N3. Similarly, the ratio decreases by 18.45% for R94N6 according to R100N0. Therefore, the percentage of BST decreases for R94N6. The ratio is 56.14% for R91N9 according to R100N0. Therefore, the percentage of BST decreases for R91N9.
The factors which are affected the surface quality of MDF board before production are the amount of the inorganic rock salt filler, the geometry of the inorganic rock salt filler, the chemical structure, amount of lignin type of cellulosic raw material, density, fiber structure, fiber dimensions, the ratio of fiber moisture, the kind of the resin, the amount of the resin and the other included chemicals.
The factors which are affected the surface quality during the production of MDF board are mat fiber moisture, pulverized sprayed water amount of the top and bottom of the
mat, pre-press pressure, hot-pressing parameters and hot press. The applied temperature press and time diagrams during the hot press of the board are very important. Sanding of MDF, the sanding paper properties, sanding method and sandpaper affect the smoothness of the board surface. Colour Properties of Fiberboard
Standards are applied in this test ASTM D2244-07e1 (2007). The surface colour analysis of fiberboards is calculated by using Eq.(1). The results are tabulated in Table 3.
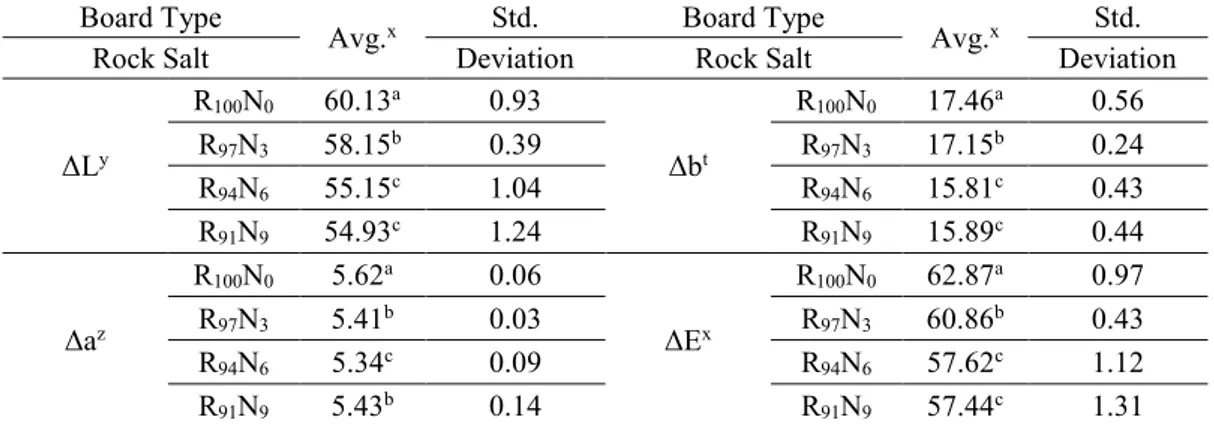
The results of ANOVA and Duncan mean separation test for ΔL black-white colour change, Δa red-green colour change, Δb yellow-blue colour change, ΔE total colour difference percent of the fiberboards made from rock salt addictive fiber and control fiberboards are shown in Table 3. Each test is measured with 20 different samples in this study.
Table 3. The results of ANOVA and Duncan mean separation test for ΔL black-white colour change, Δa red-green colour change, Δb yellow-blue colour change, ΔE total colour difference percent of the fiberboards made from rock salt addictive fiber and control fiberboards.
Board Type Avg.x Std. Board Type Avg.x Std.
Rock Salt Deviation Rock Salt Deviation
ΔLy R100N0 60.13a 0.93 Δbt R100N0 17.46a 0.56 R97N3 58.15b 0.39 R97N3 17.15b 0.24 R94N6 55.15c 1.04 R94N6 15.81c 0.43 R91N9 54.93c 1.24 R91N9 15.89c 0.44 Δaz R100N0 5.62a 0.06 ΔEx R100N0 62.87a 0.97 R97N3 5.41b 0.03 R97N3 60.86b 0.43 R94N6 5.34c 0.09 R94N6 57.62c 1.12 R91N9 5.43b 0.14 R91N9 57.44c 1.31
X: The average value of the samples * 95% confidence interval for the average ANOVA. a, b, c, d values with the same letter are not significantly different (Duncan's test); ΔEx total colour difference; ΔLy black-white colour change;
Δaz red-green colour change; Δbt yellow-blue colour change.
The Variation of L
There is a significant difference between (R100N0), (R97N3) and (R94N6, R91N9) in the variation of L. The brief results of Table 3 could be explained as follows.
This variation decreases by 3.40% for R97N3 according to R100N0. Similarly, the variation decreases by 7.08% for R94N6 according to R100N0. Therefore, the variation decreases for R94N6. The variation decreases 9.46% for R91N9 according to R100N0. Therefore, the variation decreases for R91N9.
The Variation of
a
There is a significant difference between (R100N0), (R97N3, R91N9), (R94N6) and in the variation of
a
. The brief results of Table 3could be explained as follows.
This variation decreases by 3.88% for R97N3 according to R100N0. Similarly, the variation decreases by 5.29% for R94N6 according to R100N0. Therefore, the variation decreases for R94N6. The variation decreases
168 3.49% for R91N9 according to R100N0. Therefore, the variation decreases for R91N9. The Variation of
b
There is a significant difference between (R100N0), (R97N3) and (R94N6, R91N9) in the variation of
b
. The brief results of Table 3could be explained as follows.
This variation increases by 1.80% for R97T3 according to R100T0. Similarly, the variation decreases 10.43% for R94T6 according to R100T0. Therefore, the variation decreases for R94T6. The variation decreases 9.88% for R91T9 according to R100T0. Therefore, the variation decreases for R91T9. The Variation of E
There is a significant difference between (R100N0), (R97N3) and (R94N6, R91N9) in the variation of E. The brief results of Table 3 could be explained as follows.
This variation decreases by 3.30% for R97N3 according to R100N0. Similarly, the variation decreases by 9.11% for R94N6 according to R100N0. Therefore, the variation decreases for R94N6. The variation increases by 9.45% for R91N9 according to R100N0. Therefore, the variation decreases for R91N9. As the amount of inorganic rock salt increases in MDF production, E the value decreases.
Mechanical Properties of Fiberboard
The results of ANOVA and Duncan mean separation test for bending strength, modulus elasticity, internal bond, surface screw holding ability, Jank hardness measured vertically to the plate surface of the fiberboards made from rock salt addictive fiber and control fiberboards are shown in
Table 4.
Table 4. The results of ANOVA and Duncan mean separation test for density and mechanical properties of the rock salt addictive fiberboards and control fibreboard
Rock salt
Board Type Avg.x Deviation Std. Rock salt Type Board Avg.x Deviation Std.
Ben din g str en gth (MO R) (N/m m 2) R100N0 36.89 d 2.44 Mo du lu s elasticity (MO E) (N/m m 2) R100N0 3,482.91a 218.22 R97N3 32.87c 2.23 R97N3 3,164.58b 153.36 R94N6 26.93b 2.75 R94N6 2,637.68c 178.04 R91N9 23.87a 1.23 R91N9 2,474.19d 148.02 In ter nal bo nd (IB ) (N/m m 2) R100N0 0.58a 0.03 Su rfac e scr ew ho ld in g ab ilit y (N) R100N0 10.07a 0.30 R97N3 0.48b 0.03 R97N3 8.77b 0.65 R94N6 0.38c 0.05 R94N6 7.34c 1.22 R91N9 0.32d 0.02 R91N9 6.40d 0.33 Jan k har dn ess (N) R100N0 81.05a 1.23 R97N3 79.64b 1.85 R94N6 77.64c 1.14 R91N9 75.53d 2.07
X: The average value of the samples. *95% confidence interval for the average ANOVA. a, b, c, d values with the same letter are not significantly different (Duncan's test).
Mat moisture of the draft of the laying unit, density, fiber distribution and press parameters affect the density during production. The difference between the density of the fiberboard influences the physical and technological properties (Ayrılmış, 2000).
The ratio between the densities for the lowest fiberboard with the average fiberboard are always desired between 0.85 to 0.95 values. The efficiency of process
parameters and applied hot press diagram in MDF production affect the optimum homogenous density of the fiberboard. If the ratio between the densities for the lowest fiberboard with the average fiberboard goes to one, then this ratio represents that the density of the fiberboard is the optimum homogeneous density.
The Results of the Bending Strength (MOR) (N/mm2) Test
169 There is a significant difference between (R100N0), (R97N3), (R94N6, R91N9) according to the percentage of bending strength test.
The brief results of Table 4 could be explained as follows. The ratio for this test is 12.22% for R97N3 according to R100N0. Therefore, the percentage of bending strength decreases for R97N3. Similarly, the ratio is 36.98% for R94N according to R100N0. Therefore, the percentage of bending strength decreases for R94N6. The ratio is 54.54% for R91N9 according to R100N0. Therefore, the percentage of bending strength decreases for R91N9.
The mechanical properties of the MDF are significant to the bending strength. MDF is required to be resistant to places of use. The bending strength is made according to the relevant standard. All measurement results of the test boards which are measured above TS EN 622-5 (2008) standard value.
Fiber length is the most important factor affecting bending strength. As the fiber length and the fibers contact degree increases with each other's fibers. Thus, a more effective adhesion area is formed. Thus, it boosts the bending strength of the board. The softwood fiber length is between 6-7 mm. The hardwood fiber length is between 0.5 and 2 mm. The hardwood fiber wall thickness is thick and the lumen is narrow. This negatively affects fiber-to-fiber bonding and compression. The softwood fiber wall thin, lumen wide and elipse close. Therefore, it affects the fiber-fiber bonding and compression factor positively. The bond ratio of MDF to fiber-fiber increases the tensile strength.
Factors affecting surface quality and bending strength (MOR) of MDF are type of lignocellulosic raw material, density of raw material, fiber structures, fiber sizes, fiber moisture content, type of glue, amount of glue, other chemical material, mat moisture content, refineer fibrillation degree, amount of pulverize water spray of up and down of mat, pre-press pressure, hot press type, hot press factors, hot press specific values, hot press temperature, hot press pressure and hot press time are effective.
During hot pressing, draft (mat) moisture is an important factor. Mat humidity is 9-11% preferred. At this humidity value, the
top and bottom surface of the boards are plasticized during the hot press. The press heat is transferred to the centre of the board. The resin becomes a cure. The sheet becomes stable. The most important factor in wood is the cellulose chain.
The Results of the Internal Bond (IB) (N/mm2) Test
There is a significant difference between (R100N0), (R97N3), (R94N6) and (R91N9) according to the percentage of internal bond (IB) test. The brief results of Table 4 could be explained as follows.
The ratio for this test is 20.82% for R97N3 according to R100N0. Therefore, the percentage of the internal bond decreases for R97N3. Similarly, the ratio is 52.20% for R94N6 according to R100N0. Therefore, the percentage of the internal bond decreases for R94N6. The ratio is 82.25% for R91N9 according to R100N0. Therefore, the percentage of the internal bond decreases for R91N9.
The IB strength of the board decreases as the amount of inorganic minerals increases. The mechanical properties for the 9% inorganic mineral added to board is the lowest because rock salt inorganic filler minerals reduce the between fibers contact and adhesion strength.
The increase in the density of MDF positively affects the internal bond of the board. Optimum efficiency is achieved in the press diagram. The press diagram in Fig. 3 was applied. During pressing; temperature, pressure and time diagrams are applied. The Results of the Modulus Elasticity (MOE) (N/mm2) Test
There is a significant difference between (R100N0), (R97N3), (R94N6, R91N9) according to the percentage of modulus elasticity test. The brief results of Table 4 could be explained as follows:
The ratio for this test is 10.05% for R97N3 according to R100N0. Therefore, the percentage of modulus elasticity decreases for R97N3. Similarly, the ratio is 32.04% for R94N6 according to R100N0. Therefore, the percentage of modulus elasticity decreases for R94N6. The ratio is 40.76% for R91N9 according to R100N0. Therefore, the
170 percentage of modulus elasticity decrease for R91N9.
In MDF production the fiber length increases the modulus of elasticity of the board. The important factors affecting the modulus of elasticity are the chemical, anatomical structure, density, amount of extractive substance, extractive content, pH, the humidity of the mat fiber, press temperature, press pressure and timing diagram, respectively. The more contact and sticking surface between the fibers, the greater the elasticity modulus. As the contact surface between the fibers and the area of adhesion decreases, the elastic modulus of the sheet decreases. Ayrılmış (2000) measured between 2857-3494 N/mm² the elasticity modulus of the board produced from black pine, beech, oak fiber
The Results of the Surface Screw Holding Ability (N) Test
There is a significant difference between (R100N0), (R97N3), (R94N6) and (R91N9) according to the percentage of the surface screw holding ability test. The brief results of Table 4 could be explained as follows.
The ratio for this test is 14.82% for R97N3 according to R100N0. Therefore, the percentage of the surface screw holding ability decreases for R97N3. Similarly, the ratio is 37.20% for R94N6 according to R100N0. Therefore, the percentage of the surface screw holding ability decreases for R94N6. The ratio is 57.17% for R91N9 according to R100N0. Therefore, the percentage of the surface screw holding ability decreases for R91N9.
The screw holding resistance is the most important for mechanical properties. The surface screw holding strength of the board is related to the strength of the between fibers adhesive. The screw holding test results are standardized in TS EN 622-5 (2008). Akgül & Çamlıbel (2008) tested the surface screw holding strength of MDF produced from Rhododendron ponticum L wood fibers between 121.07-125.42 kp. As the amount of inorganic rock salt increases in MDF, the surface screw holding ability decreases. The Results of Jank Hardness (N/mm2) Test
There is a significant difference between (R100N0), (R97N3), (R94N6) and (R91N9) according to the percentage of Jank hardness test. The brief results of Table 4 could be explained as follows.
The ratio for this test decreases 1.82% for R97N3 according to R100N0. Therefore, the percentage of Jank hardness decreases for R97N3. Similarly, the ratio decreases by 4.45% for R94N6 according to R100N0. Therefore, the percentage of Jank hardness decrease for R94N6. The ratio is 7.35% for R91N9 according to R100N0. Therefore, the percentage of Jank hardness decreases for R91N9. Akgul et al., (2013) measured the elasticity modulus of the board produced burned pine woods between 2567-2733 N/mm².
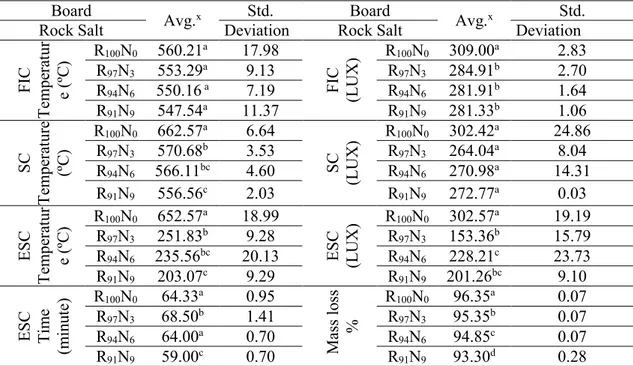
The Combustion Properties of Fiberboard Table 5 shows FIC, FIC lux, SC, SC lux, ESC, ESC lux ESC time and mass loss experiments results according to ANOVA Duncan for MDF board which have additive rock salt.
The temperature has been measured as R100N0 (560,21ºC), R97N3 (553.29ºC), R94N6 (550.16ºC), R91N9 (547.54) in the FIC experiment for the produced in the process line. When the FIC temperature of the panels with addictive inorganic mineral is compared, the panel resists to the FIC temperature as the amount of the addictive inorganic mineral is increased. The highest FIC temperature in the control panel is measured as 560,21°C in %100R. The FIC temperature decrease as the amount of the addictive inorganic mineral in MDF. Therefore, the heat is absorbed in MDF which is produced with rock salt mineral, and the MDF has resistive properties against the combustion.
SC temperatures are measured as 662.58ºC for R100N0, 570.68ºC for R97N3, 566.11ºC for R94N6, 556.56ºC for R91N9 in the SC temperature experiment. The value of temperature decreases. This reduction is responsible for the chemical properties of the rock salt mineral. ESC temperatures are measure 652.57ºC for R100N0, 251.83ºC for R97N3, 235.76ºC for R94N6, 203.07ºC for R91N9 in the ESC temperature experiment.
171 ESC temperature decreases as the ratio of inorganic mineral usage increases.
The light density is measured as 309.00 lux for R100N0, 284.91 lux for R97N3, 281.91 lux for R94N6, 281.33 lux for R91N9 in FIC lux experiment. FIC light density decreases and releases light fog as the number of inorganic material increases in the addictive MDF. The light density is measured as 302.42 lux for R100N0, 264.04 lux for R97N3, 270.98 lux for R94N6, 272.77 lux for R91N9 in
SC lux experiment. The results of the ESC lux experiment are 302.57 lux for R100N0, 154.36 lux R97N3, 228.21 lux R94N6, 201.26 lux R91N9. As the amount of the inorganic filling material increases the density of ESC decreases. The results of the mass loss experiment are 96.35% for R100N0, 95.35% for R97N3, 94.85% for R94N6, 93.30% for R91N9. After MDF which has inorganic mineral is burned, the ash amount is more surplus according to the test panel.
Table 5. The statistical results for FIC, FIC lux, SC, SC lux, ESC, ESC lux ESC time and mass loss experiments of MDF board.
N: Number of samples, x: average value of samples, * 95% confidence interval for average ANOVA. a,b,c,d values with the same letter are significantly different (Duncan’s test).
Table 6 shows FIC temperature, FIC lux, SC temperature, SC lux, IST temperature, IST time, IST lux, FC temperature, FC time, FC lux, IST time and mass loss experiments results according to ANOVA Duncan for
MDF board which have additive rock salt. The mass loss analysis of fiberboards is calculated by using Eq.(2). The results are tabulated in Table 5.
Tablo 6. Combustion experiment of MDF produced in the production process
x: average value of temperature. Conclusions
Board Avg.x Std. Board Avg.x Std.
Rock Salt Deviation Rock Salt Deviation
FIC Tem pe ra tur e ( ºC ) R100N0 560.21a 17.98 FIC (LUX ) R100N0 309.00a 2.83 R97N3 553.29a 9.13 R97N3 284.91b 2.70 R94N6 550.16 a 7.19 R94N6 281.91b 1.64 R91N9 547.54a 11.37 R91N9 281.33b 1.06 SC Tem pe ra tur e (ºC ) R100N0 662.57 a 6.64 SC (LU X ) R100N0 302.42a 24.86 R97N3 570.68b 3.53 R97N3 264.04a 8.04 R94N6 566.11bc 4.60 R94N6 270.98a 14.31 R91N9 556.56c 2.03 R91N9 272.77a 0.03 ESC Tem pe ra tur e ( ºC ) R100N0 652.57a 18.99 ESC (LUX ) R100N0 302.57a 19.19 R97N3 251.83b 9.28 R97N3 153.36b 15.79 R94N6 235.56bc 20.13 R94N6 228.21c 23.73 R91N9 203.07c 9.29 R91N9 201.26bc 9.10 ESC Tim e (m inu te) R100N0 64.33a 0.95 Ma ss lo ss % R100N0 96.35a 0.07 R97N3 68.50b 1.41 R97N3 95.35b 0.07 R94N6 64.00a 0.70 R94N6 94.85c 0.07 R91N9 59.00c 0.70 R91N9 93.30d 0.28 Bo ar
d FIC Average. SC Average. ESC Average. IST Average FC Average IST Mass loss
Tempx (ºC) (Lux) Temp x (ºC) (Lux) Temp x (ºC) (Lux) Temp x
(ºC) (minute) Time (Lux) Temp x
(ºC) (Minute) Time (Lux) Minute (dk) (%) %100R 560.21 309 662.58 302.42 652.57 302.57 654 150 321 614 540 301 64.33 96.35 R97N3 553.29 284.92 570.68 264.04 251.83 154.36 560 210 251 133.5 780 180 68.5 95.35 R94N6 550.17 281.92 566.11 270.98 235.76 228.21 394 465 240.5 194.5 720 234.5 64 94.85 R91N9 547.54 281.33 556.56 272.77 203.07 201.26 201.5 495 175.5 155 720 218 59 93.30
172 As the amount of inorganic rock salt increases in MDF production both the mechanical tests and the physical test consequences decrease. pH of the rock salt, the chemical structure of the rock salt mineral is affected by the mechanical and the physical tests quality of the board. The rock salt inorganic filler minerals reduce the between fibers contact and adhesion strength.
As the amount of inorganic rock salt increases in MDF production, both the percentage of TS-2h and the percentage of TS-24h increase. As the amount of inorganic rock salt increases in MDF production, the percentage of the WA-2h and WA-24h increases. WA values of fiberboard increase according to standards. This reason is the usage amount of rock salt mineral and its geometrical structure. As the amount of inorganic rock salt increases in MDF, the quality of BST decreases. Therefore, the amount of rock salt mineral must be within acceptable limits.
As the amount of inorganic rock salt increases in MDF, the surface total colour difference of the board increases in terms of the result of colour parameters (E,L,
a
and
b
) according to the control board.As the amount of inorganic rock salt increases in MDF, the total colour difference and whiteness (black-white colour change) over the surface board increase. The rock salt inorganic mineral is suitable for the production of MDF board. It is suggested that rock salt inorganic mineral could be used within acceptable limits according to the alternative biomass.
Rock salt inorganic minerals reduce the ability to bond fiber-fiber bonds on the board. The mechanical properties of the board decrease as the amount of inorganic minerals increases. The mechanical properties for the 6- 9% inorganic mineral added to the board is the lowest because rock salt inorganic filler minerals reduce the between fibers contact and adhesion strength. It is suggested that rock salt inorganic mineral could be used within acceptable limits according to the alternative biomass. The experiments give positive results according to FIC, SC, ESC, FIC lux, SC lux, ESC lux, IST, ESCS, mass loss tests for
MDF which has rock salt mineral addictive. As the amount of the inorganic filling mineral increases, the resistive against combustion increases. The rock salt additive which has 9 percent ratio has raised against to combustion both 23.76% at FIC temperature and 19.06% in SC temperature. It is concluded that rock salt mineral can be used against the fire as a resistive in the production of MDF.
Acknowledgements
This study was supported by T.C. Ministry of Science Industry and Technology, Duzce University, and Divapan Integrated Wood Company and Wood Chemistry and Technology Department in Faculty of Forestry at Duzce University. References
Akgul, M. (2009). Medium density fiberboards manufactured from corn stalks. Duzce
University Journal of Forestry, 5(2) 95-103.
Akgul, M., Ayrılmış, N., Camlıbel, O. & Korkut, S. (2013). Potential utilization of burned wood in manufacture of medium density fibreboard.
The Journal of Material Cycles and Waste Management, 15(2), 195-201.
Akgul, M. & Çamlıbel, O. (2008). The Manufacture of medium density fiberboards using rhododendron (R. Ponticum L.) biomass. Building and Environment, 43, 438-443.
ASTM D 2244-07e1 (2007). Standard practice for calculation of color tolerances and color differences from instrumentally measured color coordinates. American Society for Testing and Materials, West Conshohocken, PA.
ASTM D 1037-78 (1994). Standards methods of evaluating the properties of wood-based-fiber and particle panel materials The American Society for Testing and Materials USA. ASTM E 160–50 (1976) Standard test method for
combustible properties of treated wood by the crib test.
Ayrılmış, N. (2000). Impact of tree varieties on the technological features of MDF, Master Thesis. İstanbul University Institute of Science and Technology, İstanbul.
Basta, A. H., El-Saıed, H., Gobran, R.H. & Sultan, M.Z. (2006). Enhancing environmental performance of formaldehyde-based adhesives in lignocellulosic composites, part III: evaluation of some starch derivatives.
173
Designed Monomers and Polymers, 9(4),
325–347.
Basta, A.H. & El-Saied, H. (2008). New approach for utilization of cellulose derivatives metal complexes in preparation of durable and permanent colored papers. Carbohydrate
Polymers, 74, 301–308.
Basta,, A.H., El-Saied, H. & Lotfy, V.F. (2013). Performance of rice straw-based composites using environmentally friendly polyalcoholic polymers-based adhesive system. Pigment &
Resin Technology, 42(1) 24–33.
Basta, A.H., El- Saied, H. & Lotfy, V.F. (2014). Performance assessment of deashed and dewaxed rice straw on improving the quality of RS-based composites. RSC Advances, 4(42) 21794-21801.
Basta, A.H. & El-Saied, H. (2017). Beneficial effect of new activated enhancing the performance of particle boards from UF-rice straw. Pigment & Resin Technology, 46(2) 139–147.
Dönmez Çavdar, A., Boran Torun, S., Ertas, M. & Mengeloglu, F. (2019). Ammonium zeolite and ammonium phosphate applied as fire retardants for microcrystalline cellulose filled thermoplastic composites.
Fire Safety Journal, 107, 202-209.
Dönmez Çavdar, A. (2020). Effect of zeolite filler in medium density fiberboards bonded with urea formaldehyde and melamine formaldehyde resins. Journal of Building
Engineering, 27, 101000.
Ganapathy, P. M. (1997). Sources of nonwood fiber for paper, board and panels production: status, trends and prospects for India, Working Paper No: APFSOS/WP/10, Asia Pacific Forestry Sector Outlook Study, Bangalore.
Guller, B. (2001). Wood composites. Suleyman
Demirel University Forest Faculty Journal, 2,
135-160.
Hafızoglu, H.; Yalinkilic, M.K.; Yildiz, U.C.; Baysal, E.; Peker, H.; Demirci, Z. 1994.
Utilization of Turkey’s Boron Reserves in Wood Preservation Industry. Project of
Turkish Science and Tech. Council (TUBITAK), Code: TOAG-875, 377.
Hosny, W. M., Basta, A.H. & El‐Saied, H. (1997). Metal chelates with some cellulose derivatives: v. synthesis and characterization of some ıron(ııı) complexes with cellulose ethers. Polymer International, 42(2) 157-162. Istek, A, Aydemir, D. & Eroğlu, H. 2013.
Combustion properties of medium-density fiberboards coated by a mixture of calcite and various fire retardants. Turkish Journal of
Agriculture and Forestry, 37, 642-648.
Kalaycıoğlu, H., Yel, H. & Dönmez Çavdar, A. (2012). Wood wool cement boards and its applications. Kastamonu University Forest
Faculty Journal, 12(1), 122-133.
Kurt, R. Mengeloglu, F. & Meric, H. (2012). The effects of boron compounds synergists with ammonium polyphosphate on mechanical properties and burning rates of wood-HDPE polymer composites. European Journal of
Wood and Wood Products, 70, 177-182.
LeVan, S. & Tran, H.C. (1990). The role of boron in flame retardant treatments. In: Proceedings of first international conference on wood protection with diffusible preservatives. First International Conference on Wood Protection with Diffusible Preservatives: Nashville, Tennessee, November 28-30, 1990. Madison, WI: Forest Products Research Society, 39-41. Ozcıfcı, A., Toker, H. & Baysal, E. (2007). Fire
properties of laminated veneer lumber treated with some fire retardants. Wood Research, 52(4), 37-46.
Özdemir, F. (2019). Effect of mineral materials content as filler in medium density fiberboard. BioResources, 14(1), 2277-2286. Ashori, A & Nourbakhsh. (2009). Effects of
nanoclay as a reinforcement filler on the physical and mechanical properties of wood-based composite. Journal of Composite
Materials, Vol. 13, issue:18 pp:1869-1875.
Temiz, A., Yildiz, U.C., Aydin, I., Eikenes, M., Alfredsen, G. & Colakoglu, G. (2005). Surface roughness and color characteristics of wood treated with preservatives after accelerated weathering test. Applied Surface
Science, 250 (1-4), 35-42.
Tondi, G., Haurie, L. & Wieland, S. (2014). Comparison of disodium octaborate tetrahydrate-based and tannin-boron-based formulations as fire retardant for wood structures. Fire and Materials, 38(3), 381-390.
TS EN 317 (2008). This standard specifies a method of determining the swelling in thickness of flat pressed or drum pressed particleboards, fibreboards and cement bonded particleboards. TSE, Ankara.
TS 642 ISO 554 (1997). Standard atmospheres for conditioning and/or testing; specifications. TS EN 310 (1999). Wood-based-panels
determination of modulus of elasticity in bending and of bending strnght, TSE, Ankara. TS EN 319 (1999). Particleboards and fibreboards Determination of tensile strength perpendicular to the plane of the board. TSE, Ankara.
TS EN 323 (2008). Wood- based- panels density specifications, TSE, Ankara
174 TS EN 325 (2008). Wood-based Panels the
Determination of dimensions of the test pierces. TSE, Ankara.
TS EN 326–1 (1999). Wood-Based Panels- Sampling, cutting and inspection- Part 1: Sampling test pieces and expression of test results. TSE. Ankara.
TS EN 382–1 (1999). Fibreboards- Determination of surface absorption Part 1: Test method for dry process fibreboards (MDF). TSE, Ankara. TS EN 622–5. (2008).
Fibreboards-specifications-part-5 Requirements for dry process boards (MDF). TSE, Ankara.
Tsunoda, K. (2001). Preservative properties of vapor-boron-treated wood and wood-based composites. Journal of Wood Science, 47: 149–153.
Usta, M. & Ustaömer, D. (2012). Boron compounds for MDF. BioResources, 7(1), 437-446.
Valcheva, L. & Savov, V. (2015). The effect of thickness of medium density fiberboard produced of hardwood tree species on their selected physical and mechanical properties,
Key Engineering Materials Submitted. 688,
115-121
Xian-Qing, X., Wenting, Q., Lu, F., Zhihui, W. & Feng, W. (2016). Producing process for veneer decorative straw particleboards, Wood
Research. 61(3), 465-474.
Yang, J., Zheng, X., Yao J., Xiao J. & Yan, L. (2019). 3D Surface Defects Recognıtıon of Lumber and Straw-Based Panels Based on Structure Laser Sensor Scannıng Technology,
Inmateh Agricultural Engineer. 57(1).
Zuo, Y., Xiao, J., Wang, J., Liu, W., Li, X. & Wu, Y. (2018). Preparation and characterization of fire retardant straw/magnesium cement composites with an organic-inorganic network structure, Construction and Building Materials. 171, 404–413.
URL1.http://http://www.fao.org/faostat/en/#data/ FO accessed: 24.01.2020.
URL 2.www.maden.org.tr › resimler › ekler accessed:10.04.03.2020