*Corresponding author: e-mail: [email protected]
https://doi.org/10.18494/SAM.2019.2324
ISSN 0914-4935 © MYU K.K. https://myukk.org/
Room-temperature Sensing of Volatile Organic Compounds
Using Graphene
Zafer Şen,
1*Sadullah Öztürk,
2Mika Harbeck,
1and Zafer Ziya Öztürk
31Materials Institute, TÜBİTAK Marmara Research Center,
P.O. Box 21, 41470 Gebze, Kocaeli, Turkey
2Faculty of Engineering, Fatih Sultan Mehmet Vakif University,
Golden Horn Campus, 34445 Beyoglu, Istanbul, Turkey
3Department of Physics, Gebze Institute of Technology,
P.O. Box 141, 41400 Gebze, Kocaeli, Turkey (Received February 8, 2019; accepted April 8, 2019) Keywords: graphene, chemical sensor, volatile organic compounds, gas sensing
Graphene-based sensors are mostly studied in terms of their responses to inorganic gases such as various nitrogen oxides or ozone. In this work, chemically derived graphene (CDG) is assessed in terms of its gas sensing properties at room temperature for a selected set of volatile organic compounds (VOCs) representing different chemical classes. CDG was coated on gold interdigital electrodes on a glass substrate by drop casting. Structural and morphological analyses were realized by surface electron microscopy and energy-dispersive X-ray spectroscopy techniques. Among the nine test analytes, the highest sensor sensitivities were observed for chlorobenzene, tetrachloroethylene, and triethylamine. The results show that CDG sensors are not only sensitive to rather reactive inorganic gases, but can also be used in the detection of a wide range of VOCs.
1. Introduction
Volatile organic compounds (VOCs) can be found everywhere in our life, e.g., in food products as part of their aroma, in many industrial products or from natural sources. They may have different adverse effects on our health depending on the duration of exposure and are often responsible for lowering our quality of life. These chemicals originate, among others, from solvents, plastics, paints, or glues contained in many products or used during their production. It is of utmost importance that these dangerous chemicals, which are so intertwined with our daily life, are detected before reaching hazardous levels for human health and environmental safety.(1,2) For this reason, the interest in sensing and monitoring with simple, reliable,
stable, and cost-effective methods is continuously increasing. The detection and monitoring of chemical gases and vapors is of importance in cases such as environmental monitoring, monitoring of manufacturing processes, medical diagnosis, and maintaining indoor/outdoor air quality and public safety.(3)
atmosphere and then outputs an observable physical signal that can be read, for example, as resistance, capacitance, potential, absorbance, or frequency or changes thereof.(4,5) The design and production of gas sensors of a wide variety of types have been carried out to serve different purposes since the production of the first gas sensor in 1926 until the present day.(6) Particularly in recent years, astonishing improvements have been made in the field. New sensors are introduced into the market with high sensitivity and selectivity, low operating temperatures, and short response and recovery times. Many of the improvements are in parallel with the widespread use of nanotechnology as well as the application of nanomaterials. Different nanostructured structures such as wires, rods, tubes, strips, and plates fabricated using metals, metal oxides, composites, alloys, and organic and inorganic compounds have been produced using various physical and chemical methods and techniques owing to the advancement of nanotechnology.(7,8)
Over the last two decades, graphene and its derivatives have been the focus of great interest owing to their unique and novel properties. Graphene is composed of single-layer carbon atoms that form a honeycomb lattice structure.(4,9) Graphene is used in various applications
including solar cells, light-emitting diodes, transistors, and bio/chemical sensors owing to its favorable physical properties as a two-dimensional monolayered structure, such as high thermal conductivity (5 × 10³ W/m·K), large surface area (2600 m2/g), and high electron mobility (5 × 105 cm2/V·s) at room temperature.(10–13) It is also accepted as a good candidate for a sensitive
material in chemical gas sensors. Even a single molecule can be detected by graphene-based devices.(9,14) Graphene is very sensitive to chemicals owing to its monolayered structure and
high surface-to-volume ratio.(14,15) For this reason, its range of applications as gas sensors is wide. The first research on the gas sensing properties of graphene was realized by Schedin
et al. in 2007.(14) In that study, resistance changes of a graphene-based sensor were observed
even on the ppm order of target analyte concentration owing to adsorption. Most of the graphene-based gas sensor studies are focused on the sensing of inorganic gas species such as NOx, CO, and NH3, and some other toxic industrial gaseous molecules.(16–18) For instance,
Wu et al. investigated the hydrogen sensing properties of palladium-decorated graphene at room temperature and discussed the sensing mechanism.(19) Rarely, VOCs have been used as
target analytes. Rumyantsev et al. investigated the sensing properties of graphene by using a transistor-type transducer structure focusing on selective detection. To enhance the selectivity of the sensor, the resistance change was investigated at different frequencies.(20) The studies on the detection of VOCs using a quartz crystal microbalance (QCM) transducer modified with graphene as a sensitive layer are very attractive. Butanol, isopropanol, acetone, ethanol, and formaldehyde were sensed by graphene coated on the transducer by chemical vapor deposition.(21,22)
In this study, the VOC sensing properties of a chemically derived graphene (CDG) sensor based on an interdigital transducer (IDT)—a chemiresistive sensor—were investigated at room temperature under dry air conditions. The nine test analytes were selected according to their chemical nature representing various chemical classes such as alcohols, esters, hydrocarbons, chlorocarbons, and amines. CDG was coated on the IDT by drop casting. In addition, structural and morphological analyses of the obtained sensor were carried out.
2. Materials and Methods
2.1 Fabrication of the graphene-based sensitive material
The CDG used as a sensing material was produced by the reduction of graphene oxide with hydrazine hydrate. CDG was suspended in N-methyl-pyrrolidone (NMP) at a concentration of 0.5 mg/ml. The suspension was sonicated in an ultrasonic bath for 5 h to obtain a homogeneously dispersed graphene solution.(23) Subsequently, the prepared suspension was centrifuged for 30 min at 500 rpm, and a clear CDG–NMP suspension was collected. In the final step, the CDG–NMP suspension was aged in an ultrasonic bath for 30 min.
2.2 Preparation of the IDT sensor
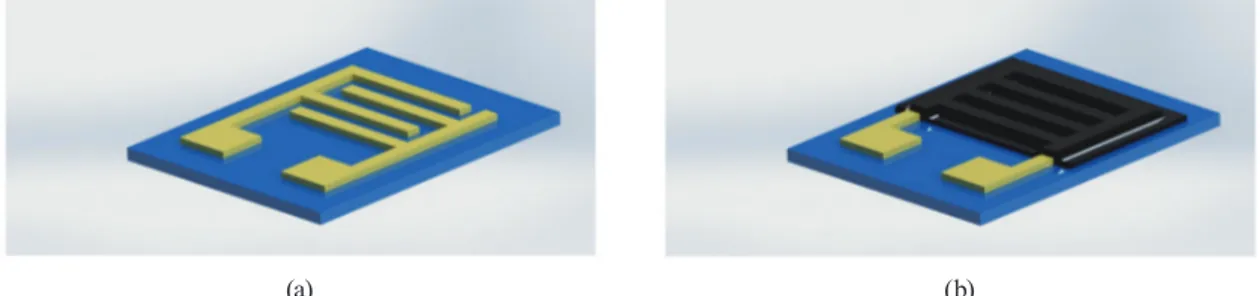
An interdigital electrode structure was used as a transducing element, and a schematic illustration of the IDT is given in Fig. 1. The transducing element was prepared by photolithography. Chromium (5 nm) and gold (100 nm) were coated on the glass substrate by thermal evaporation. Subsequently, metal thin film wet etching was used to obtain gold finger electrodes. The distance between two electrodes and the width of each electrode is 50 µm. The IDT was cleaned with acetone, methanol, and distilled water, and an argon plasma was applied before coating the sensitive material. The sensitive material CDG was coated on the IDT by spin coating at 1000 rpm and then aged for 10 min at 150 ℃ to vaporize NMP off the sensor surface.
2.3 Sensor test procedure
A fully automated sensor test setup including mass flow controllers, a thermal circulator for producing the analyte vapors, a sensor measurement cell with a temperature controller, and an electrometer (Keithley 6517B) were used for investigating the gas sensing properties of the CDG-based sensor samples at room temperature (22 ℃). A computer software program was used for data acquisition and the control of the measurement setup. Dry air of high purity (zero air) was used as a carrier gas and for the vaporization of the analytes. The fabricated gas
(a) (b)
sensor samples were placed in the measurement cell (volume: 400 ml). Before the gas sensing test, dry air was purged through the measurement cell at a flow rate of 200 ml/min to obtain a stable baseline. Subsequently, the target analyte stream was directed to the measurement cell for 30 min. The desired concentration was obtained by adjusting the flow of the carrier gas and vapor stream while keeping the total flow constant. Finally, dry air was purged into the cell to clean the sensor surface of the adsorbed analyte molecules. The sensor was exposed to five different concentrations of each analyte. The nine test analytes are volatile organic compounds including alcohols, hydrocarbons, and amines. The selected analytes represent a wide range of chemical classes with a very wide range of chemical properties expressed in linear solvation energy relationship (LSER) parameters.(24) The test analytes and their concentrations and abbreviations are given in Table 1.
3. Results and Discussion
3.1 Structural properties
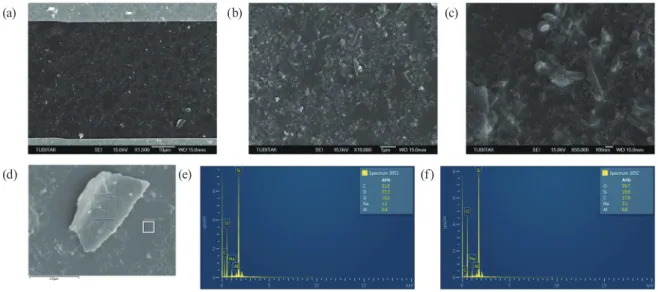
To investigate the structural and morphological properties of CDG on the gold-IDT-electrode-coated glass substrate, surface electron microscopy (SEM) and energy-dispersive X-ray spectroscopy (EDX) were used. The SEM images and EDX results are given in Fig. 2. Figures 2(a)–2(c) show the SEM results obtained at different magnifications.
In Fig. 2(a), two fingers of the gold electrode can be seen on top and at the bottom of the image. The entire surface of the glass substrate is covered homogenously with CDG. Figures 2(b) and 2(c) show higher-resolution images of the CDG surface. EDX analysis was carried out to determine the carbon concentration on the surface and also to find out if the IDT is completely covered with carbon. EDX analyses of two different regions on the CDG-coated surface are presented. Figure 2(d) shows the specific EDX regions as Spectrum 3051 and Spectrum 3052. Although there is a large bright shell structure in Spectrum 3051, a smooth surface can be observed in Spectrum 3052. The EDX spectra of these EDX regions are given in Figs. 2(e) and 2(f), respectively. According to the EDX results, a higher carbon concentration was observed in Spectrum 3051 than in Spectrum 3052. The IDT substrate is fully covered with CDG.
Table 1
Test analytes and their abbreviations and concentrations.
Analyte Abbreviation Concentration (ppm) Chlorobenzene CB 100/200/300/400/500
n-Heptane nC7 390/780/1170/1560/1950
Tetrachloroethylene TCE 150/300/450/600/750
Toluene TLN 240/480/720/960/1200
Ethyl acetate EtOAc 650/1800/2700/3600/4500 Acetonitrile ACN 950/1900/2850/3800/4750 Methanol MeOH 1000/2000/3000/4000/5000 1-Propanol nPAOH 130/260/390/520/650 Triethylamine Et3N 72/126/360/504/720
3.2 Electrical characterization
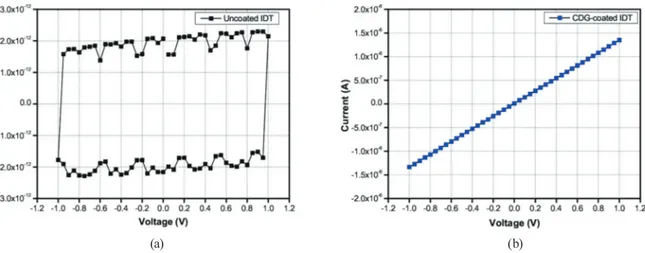
In Fig. 3, the current versus voltage (I–V) characteristics of the IDT between −1 and +1 V in steps of 0.05 V before coating [Fig. 3(a)] and after coating with CDG [Fig. 3(b)] in a dry air ambient at room temperature are plotted. The I–V curve of the bare IDT shows the hysteresis behavior of a capacitor. After coating with the sensitive material, the current increases proportionally to the applied voltage. From the results of these electrical tests, the voltage during the sensor gas tests was set as +1 V. The resistance of the sensor is in the kΩ regime.
3.3 Sensing properties and mechanism
Figure 4(a) depicts the typical real-time response curves of the CDG sensor exposed to repeated 30 min pulses of ethyl acetate and triethylamine vapors of increasing concentration at room temperature. Between two pulses, the sensor was exposed to dry air for baseline recovery. The responses increase with the concentration of the analyte vapor. The responses are negative for all analytes except for triethylamine. The changes in resistance upon analyte exposure are in the range of 2 to 3% relative to the baseline.
The resistances of the bare, NMP-coated, and graphene-coated IDTs versus time during exposure to triethylamine vapor are given in Fig. 4(b) to prove that the observed responses originate from the graphene layer. The resistances of the bare IDT and NMP-coated IDT are on the gigaohm order, while that of the CDG-coated IDT is on the kiloohm order. Moreover, when analyte vapors are fed into the measurement chamber, the resistances of the bare IDT and NMP-coated IDT remain unchanged, whereas that of the CDG-coated IDT changes.
(a) (b) (c)
(d) (e) (f)
Fig. 2. (Color online) SEM images of the CDG-coated glass substrate at (a) X1500, (b) X10000, and (c) X50000. (d) Image of the EDX regions and EDX spectra of (e) Spectrum 3051 and (f) Spectrum 3052.
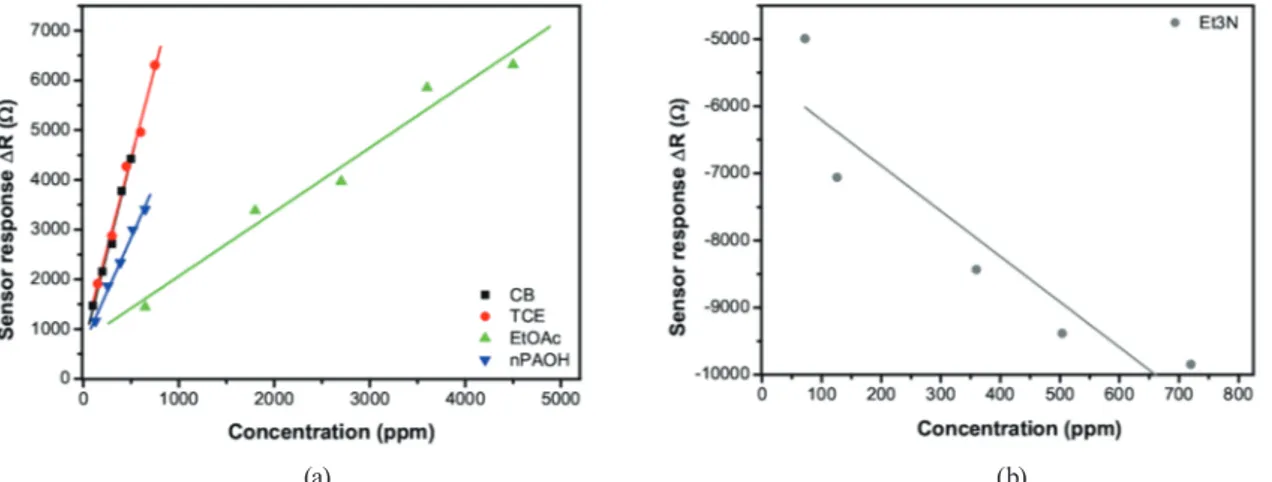
The responses of the sensor to the different test analytes are markedly divergent. According to the VOC sensing tests, the CDG sensor shows a sensing behavior similar to that of ethyl acetate for the other test analytes except for triethylamine. In the latter case, the resistance of the sensor decreases upon analyte exposure. To show the sensor responses, four different VOCs are used (acetonitrile, toluene, tetrachloroethylene, and chlorobenzene) and the results are given in Fig. 5. The sensor responses increase with the concentration of the analyte vapor. The different sensor responses are very valuable for the selective detection of certain species. The calibration curves of the sensor exposed to five different analytes are plotted in Figs. 6(a) and 6(b). The sensor responses show a linear function of the concentration and no saturation effects were observed for all test concentrations. Similar results were observed for other analytes. Moreover, no saturation effect was observed for triethylamine.
(a) (b)
Fig. 3. (Color online) Electrical characterization: I–V response curves of the (a) bare and (b) CDG-coated IDTs in the range from −1 to +1 V.
(a) (b)
Fig. 4. (Color online) (a) Time-dependent response curves of the chemically derived graphene sensor exposed to repeated 30 min pulses of ethyl acetate and triethylamine vapors of increasing concentration. (b) Resistances of the bare IDT, NMP-coated IDT, and CDG-coated IDT versus time during exposure to three pulses of triethylamine vapor.
Triethylamine increases the electrical conductivity of graphene after the sensing layer was doped with more electrons; therefore, triethylamine was evaluated as a donor-type doping adsorbate. On the other hand, the other analytes decreased the electrical conductivity when doped to the sensor surface; they can be adopted as acceptor-type doping adsorbates.
In Fig. 6(a), it can be clearly seen that the sensor is most sensitive to chlorobenzene and tetrachloroethylene. Similar calibration curves of slopes indicate that chlorine atoms are more dominant in the sensing mechanism. Although tetrachloroethylene and chlorobenzene represent different chemical groups, both molecules have chlorine atoms and show similar sensing behaviors and sensitivities.
Fig. 5. (Color online) Responses of the chemically derived graphene sensor during exposure to repeated 30 min vapor pulses of acetonitrile, toluene, tetrachloroethylene, and chlorobenzene of increasing concentration.
(a) (b)
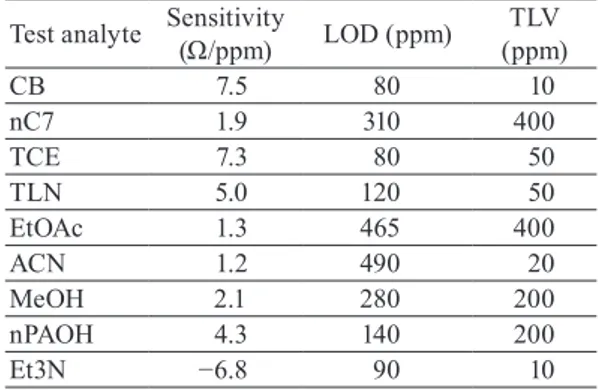
To obtain the sensitivities of the fabricated sensor to all test analytes, the calibration curves were fitted using a linear regression model. The slopes of the calibration curves (sensor response/ppm) are plotted as a bar diagram in Fig. 7. The opposite sensing behavior of triethylamine is a very useful feature for the selective detection of amine-based gas molecules. The calculated limit of detection (LOD) values and threshold limit values (TLVs) are given in Table 2 for comparison.(25,26) LOD values were determined using 600 Ω as the lowest
detectable signal, which is 3 times the standard deviation of the baseline noise. The TLVs are defined as the exposure limits to VOCs for workers in their daily working life without adverse health effects. Despite the high responses of the graphene sensor, the target detection limits cannot be reached for all analytes. For the analytes nC7 and nPAOH, the obtained LOD values are below their respective TLVs, while the target value is only slightly off for TCE, EtOAc, and MeOH. The performance of the sensor is currently limited by the high baseline noise level in the measurement setup.
4. Conclusions
In this paper, the VOC sensing properties of CDG are reported. Works on graphene-based sensors are generally focused on a very few, inorganic gas species, but in this study, a large number of VOCs were examined and a general knowledge of the organic compound sensing properties was obtained. The sensor was tested in terms of its responses to various VOCs with a wide range of chemical properties by considering LSER parameters. As analytes, nine different VOCs of different concentrations were tested to investigate the sensing properties (sensitivity, selectivity, and LOD) of CDG. The gas sensing measurements were carried out at room temperature in a dry air ambient. The CDG sensor selectively detected triethylamine. The
Table 2
Sensitivities and LOD values of the fabricated sensor and TLVs of the test analytes.
Test analyte Sensitivity (Ω/ppm) LOD (ppm) (ppm)TLV
CB 7.5 80 10 nC7 1.9 310 400 TCE 7.3 80 50 TLN 5.0 120 50 EtOAc 1.3 465 400 ACN 1.2 490 20 MeOH 2.1 280 200 nPAOH 4.3 140 200 Et3N −6.8 90 10
Fig. 7. (Color online) Bar diagram of the slopes of the calibration curves (sensitivity) of the CDG-based sensor for all tested analytes.
high selectivity property of the sensor depends on a reverse sensing mechanism. The reverse sensing mechanism of the sensor can be linked to the p-type doping of the graphene by the analytes. On the other hand, the CDG sensor showed higher sensor responses to chlorobenzene and tetrachloroethylene than to the other tested analytes. CDG sensors are not only sensitive to reactive inorganic gases, but can also be used in the detection of a wide range of VOCs.
Acknowledgments
The authors would like to thank Cem Berk and Dr. Özgür Duygulu for the SEM images and Erkan Yiğiter for support in preparing the sensor test system.
References
1 S. O. Baek, L. N. Suvarapu, and Y. K. Seo: Sensors 15 (2015) 19102. https://doi.org/10.3390/s150819102 2 S. Öztürk, A. Kösemen, Z. Şen, N. Kılınç, and M. Harbeck: Sensors 16 (2016) 423. https://doi.org/10.3390/
s16040423
3 S. Öztürk, A. Kösemen, Z. A. Kösemen, N. Kilinç, Z. Z. Öztürk, and M. Penza: Sens. Actuators, B 222 (2016) 280. https://doi.org/10.1016/j.snb.2015.08.083
4 T. Wang, D. Huang, Z. Yang, S. Xu, G. He, X. Li, N. Hu, G. Yin, D. He, and L. Zhang: Nano-Micro Lett. 8 (2016) 95. https://doi.org/10.1007/s40820-015-0073-1
5 K. Arshak, E. Moore, G. M. Lyons, J. Harris, and S. Clifford: Sens. Rev. 24 (2004) 181. https://doi. org/10.1108/02602280410525977
6 W. Göpel, J. Hesse, and J. N. Zemel: Sensors: Micro- and Nanosensor Technology — Trends in Sensor Markets (VCH, Weinheim, 1995) Vol. 8. https://doi.org/10.1002/9783527620180
7 J. Jeevanandam, A. Barhoum, Y. S. Chan, A. Dufresne, and M. K. Danquah: Beilstein J. Nanotechnol. 9 (2018) 1050. https://doi.org/10.3762/bjnano.9.98
8 V. D. Krishna, K. Wu, D. Su, M. C. J. Cheeran, J. P. Wang, and A. Perez: Food Microbiol. 75 (2018) 47. https:// doi.org/10.1016/j.fm.2018.01.025
9 S. G. Chatterjee, S. Chatterjee, A. K. Ray, and A. K. Chakraborty: Sens. Actuators, B 221 (2015) 1170. https:// doi.org/10.1016/j.snb.2015.07.070
10 K. S. Novoselov, A. K. Geim, S. V. Morozov, Y. Z. D. Jiang, S. V. Dubonos, I. V. Grigorieva, and A. A. Firsov: Science 306 (2004) 666. https://doi.org/10.1126/science.1102896
11 A. K. Geim: Science 324 (2009) 1530. https://doi.org/10.1126/science.1158877
12 M. D. Stoller, S. Park, Z. Yanwu, J. An, and R. S. Ruoff: Nano Lett. 8 (2008) 3498. https://doi.org/10.1021/ nl802558y
13 A. A. Balandin, S. Ghosh, W. Bao, I. Calizo, D. Teweldebrhan, F. Miao, and C. N. Lau: Nano Lett. 8 (2008) 902. https://doi.org/10.1021/nl0731872
14 F. Schedin, A. Geim, S. Morozov, E. Hill, P. Blake, M. Katsnelson, and K. Novoselov: Nat. Mater. 6 (2007) 652. https://doi.org/10.1038/nmat1967
15 Y. Liu, X. Dong, P. Chen, and P. Chen: Chem. Soc. Rev. 6 (2012) 2283. https://doi.org/10.1039/C1CS15270J 16 K. R. Amin and A. Bid: Curr. Sci. 107 (2014) 430. https://www.jstor.org/stable/24103495
17 J. D. Fowler, K. M. J. Allen, K. V. C. Tung, Y. Yang, R. B. Kaner, and B. H. Weiller: ACS Nano 3 (2009) 301. https://doi.org/10.1021/nn800593m
18 H. Joong, D. Han, J. Ho, and Z. Zhou: Sens. Actuators, B 157 (2011) 310. https://doi.org/10.1016/j.snb.2011.03.035 19 W. Wu, Z. Liu, L. A. Jauregui, Q. Yu, R. Pillai, H. Cao, J. Bao, Y. P. Chen, and S. S. Pei: Sens. Actuators, B
150 (2010) 296. https://doi.org/10.1016/j.snb.2010.06.070
20 S. Rumyantsev, G. Liu, M. S. Shur, R. A. Potyrailo, and A. A. Balandin: Nano Lett. 12 (2012) 2294. https:// doi.org/10.1021/nl3001293
21 V. V. Quang, V. Ngoc, L. Anh, V. Ngoc, T. Quang, and N. V. Quy: Thin Solid Films 568 (2014) 6. https://doi. org/10.1016/j.tsf.2014.07.036
22 Y. Zhihua, Z. Liang, S. Kaixin, and H. Weiwei: Procedia Eng. 29 (2012) 2448. https://doi.org/10.1016/ j.proeng.2012.01.330
23 Ö. Metin, E. Kayhan, S. Özkar, and J .J. Schneider: Int. J. Hydrogen Energy 37 (2012) 8161. https://doi. org/10.1016/j.ijhydene.2012.02.128
24 J. W. Grate and M. H. Abraham: Sens. Actuators, B 3 (1991) 85. https://doi.org/10.1016/0925-4005(91)80202-U 25 R. Kostiainen: Atmos. Environ. 29 (1995) 693. https://doi.org/10.1016/1352-2310(94)00309-9
26 M. Jakubowski and S. Czerczak: J. Occup. Environ. Hyg. 7 (2010) 429. https://doi.org/10.1080/15459624.2010. 483983
About the Authors
Zafer Şen received his B.S. degree from Marmara University, Turkey, in 2002 and his M.S.
degree from the Gebze Technical University, Turkey, in 2010. Since 2003, he has been a researcher at the TÜBITAK Marmara Research Center, Turkey. His research interests are in chemical gas sensors, gas sensing, and sensor systems. He is currently pursuing his PhD in the field of gas sensing with chemical sensor arrays. ([email protected])
Sadullah Öztürk received his B.S. degree from Marmara University, Turkey, in 2006 and
his M.S. and Ph.D. degrees from the Gebze Technical University, Turkey, in 2009 and 2014, respectively. From 2014 to 2018, he was an assistant professor at Fatih Sultan Mehmet Vakıf University, Turkey. Since 2010, he has been an associate professor at Fatih Sultan Mehmet Vakıf University, Turkey. His research interests are in sensors, organic electronics, and medical devices. ([email protected])
Mika Harbeck received his M.S. and Ph.D. degrees from the Eberhard–Karls–Universität,
Tübingen, Germany, in 2000 and 2005, respectively. He is a chief senior researcher at the TÜBITAK Marmara Research Center in Gebze, Turkey. His research activities are related to chemical gas and liquid sensors based on acoustic transducers for safety and environmental applications as well as the sensing properties of organic materials, mainly phthalocyanines and vic-dioximes. ([email protected])
Zafer Ziya Öztürk is a professor of solid-state physics at the Gebze Technical University,
Turkey. He received his Ph.D. from the Technical University of Darmstadt, Germany, in 1982. He was a postdoctoral fellow at the Institute of Physical Chemistry, University of Tübingen, Germany, and has held several research, teaching, and scientist positions in various institutions including Dicle University, Diyarbakir, TUBITAK Marmara Research Center, Gebze, and Marmara University, Istanbul, Turkey. His research interests include solid-state device sensors, molecular electronics as well as chemical and biochemical sensors. ([email protected])