ISTANBUL BILGI UNIVERSITY
INSTITUTE OF SOCIAL SCIENCES
DEPARTMENT OF FINANCIAL ECONOMICS
STOCK PRICE REACTIONS OF TARGET FIRMS TO
MERGERS AND ACQUISITIONS IN TURKEY
A THESIS SUBMITTED TO THE GRAUDATE SCHOOL OF SOCIAL SCIENCES OF ISTANBUL BILGI UNIVERSITY
BY
Sevda OKUDAN 113624006
Supervisor: Asst. Prof. Ebru REIS
ii
ACKNOWLEDGEMENT
Firstly, I would like to thank my supervisor Dr. Ebru Reis for her guidance and advices. Besides my supervisor, I would also like to thank Dr. Serda Selin Öztürk and Dr. Fırat Gundem for their guidance about the statistical analysis.
I am deeply grateful to my parents and my sisters Selda, Seher and Neslihan for their all supports and love. I am also grateful to my friends Yaprak Salman, Abdurrahman Akay, Ceylan Celik and my cousin Cem Gunes for their valuable comments and supports.
Last but not the least, I would like to thank my nephews Dila and Lavin for their love that motivated me.
iii
ABSTRACT
The study aims to analyze the effect of mergers and acquisitions (M&As) on target stock price over the period 1991-2014. The public target firms' Cumulative Abnormal Returns (CARs) have been examined for several pre-announcement and post-announcement date event windows. 128 completed M&As that include public target firms and public, private and subsidiary acquirer firms, have been examined with event study. Due to the information leakages, insider trading and difficulties of detecting original announcement date (Hekimoglu and Tanyeri, 2011), it is not possible to evaluate the effects of M&As properly in Turkey. In order to capture the pre-announcement date effects, extend the pre- event windows by 30 days prior to the announcement date. The determinants of target CARs have been examined in both univariate and multivariate analysis for different event windows.
The findings of the analyses show that the M&As create statistically significant CARs around the announcement date. For the event window [-30, 0] that include 31 days (announcement date and pre-thirty days of the announcement date), statistically significant CARs have been observed as well. The CARs of the [-30, 0] event window is larger than the shorter event windows’ CARs. This finding may provide support for the argument that the stock market is not efficient in Turkey. In multivariate analyses, the effects of target CARs’ determinants are not statistically significant for all event windows. Although the variables (determinants) are statistically significant for the short event windows that around the announcement date, they are not statistically
iv
significant for the longer pre-event window. All findings may support the information leakages, the absence of original announcement date and inefficient stock market argument for Turkey market.
Keywords: Merger and Acquisition, Cumulative Abnormal Returns (CARs), Target firm, Merger waves, Event window.
v
ÖZET
Bu çalışma 1991-2014 yılları arasında gerçekleşen şirket birleşmelerinin ve satın almalarının hedef şirket hisse senetlerinin fiyatları üzerindeki etkisini incelemeyi hedeflemektedir. Hedef şirketin kümülatif olağandışı getirileri çeşitli ilan tarihi öncesi ve sonrası olay pencereleri için hesaplanmıştır. Halka açık hedef şirketler ve halka açık, özel ve yan kuruluş alıcı firmalardan oluşan 128 adet tamamlanmış işlem olay çalışması yöntemi ile incelenmiştir. Bilgi sızıntıları, içeriden bilgilendirme ve orijinal ilan tarihinin belirlenmesindeki zorluklar (Hekimoglu ve Tanyeri, 2011) nedeniyle Türkiye’de birleşme ve satın almaların yarattığı etkiyi tam olarak incelemek mümkün olmamaktadır. İlan tarihi öncesindeki etkiyi incelemek amacıyla, olay penceresi ilan tarihinden önceki 30 güne kadar genişletilmiştir. Hedef şirketin kümülatif olağandışı getirilerinin determinantları tek değişkenli ve çok değişkenli analizler ile incelenmiştir.
Analizlerin bulguları şirket birleşme ve satın almalarının istatistiksel olarak anlamlı ilan tarihi çevresinde olağandışı getiriler yarattığını gösteriyor. İstatistiksel olarak anlamlı olağandışı getiriler ilan tarihi ve öncesindeki 30 günü içeren [-30, 0] olay penceresinde de gözlemlenmiştir. Bu olay penceresinde gözlemlenen olağandışı getiriler daha kısa olay pencerelerinde gözlemlenen olağandışı getirilerden daha fazladır. Bu bulgu Türkiye’de hisse senedi piyasasının etkin olmadığını ileri süren argümanları destekleyici nitelikte olabilir. Çok değişkenli analizlerde hedef şirket olağandışı getirilerinin determinantları her olay penceresinde istatistiksel olarak
vi
anlamlı sonuçlar vermemektedir. Bu değişkenler (determinantlar) ilan tarihini çevreleyen kısa olay pencerelerinde istatistiksel olarak anlamlı sonuçlar verirken, daha uzun olay pencerelerinde anlamlı sonuçlar vermemektedir. Elde edilen tüm bulgular Türkiye piyasası için, bilgi sızıntılarını, orijinal ilan tarihinin bulunmaması sorununu ve etkin olmayan hisse senedi piyasası argümanını destekleyici nitelikte olabilir.
Anahtar Kelimeler: Birleşme ve Satın Alma, Kümülatif Olağandışı Getiriler, Hedef şirket, Birleşme dalgaları, Olay penceresi.
vii
TABLE OF CONTENTS
ACKNOWLEDGEMENT ... ii
ABSTRACT ... iii
ÖZET ... v
TABLE OF CONTENTS ... vii
LIST OF TABLES ... ix
LIST OF FIGURES ... x
INTRODUCTION ... 1
MERGERS AND ACQUISITIONS ... 5
1.1 Merger and Acquisitions (M&As) and Type of Merger and Acquisitions ... 5
1.1.1 Definitions ... 5
1.1.2. Classification of merger & acquisition (M&A) transactions ... 6
1.2. Motives of M&As ... 7 1.2.1. Synergy gains ... 7 1.2.2. Market Power ... 9 1.2.3. Rapid Growth ... 9 1.2.4. Diversification ... 10 1.2.5. Hubris ... 11 1.2.6 Deregulation ... 11 1.2.7 Globalization ... 11 1.2.8 Other Motives ... 12
MERGER AND ACQUISITION WAVES ... 13
2.1. Merger Waves in the World ... 13
2.1.1. First Wave 1893-1904 ... 14 2.1.2. Second Wave 1920s ... 14 2.1.3. Third Wave 1950s – 1970s ... 15 2.1.4. Fourth Wave 1980s ... 16 2.1.5. Fifth Wave 1990s ... 16 2.1.6. Sixth Wave 2003- 2007 ... 17
2.2. The M&A Activities in Turkey ... 18
viii
2.2.2 The Industrial distribution of Target and Acquirer Firms ... 21
2.2.3. The Features of the M&A Wave Periods ... 23
LITERATURE REVIEW ... 25
3.1 Literature Review of Target CARs ... 25
3.1.1 Developed Markets ... 25
3.1.2 Emerging Markets ... 28
3.2 Determinants of Target Abnormal Returns ... 31
3.2.1 Cross-border ... 31
3.2.2 Industry Relatedness ... 34
3.2.3 Firm Size (Market Capitalization of Target Firm) ... 35
3.2.4 The Experience of Acquirer Firm ... 36
3.2.5 Bank M&As ... 38
3.2.6 Private vs Public Acquirers ... 40
ANALYSIS OF TARGET CARs ... 43
4.1 Methodology ... 43
4.1.1 Introduction ... 43
4.1.2 Capital Asset Pricing Model (CAPM) ... 44
4.1.3 Abnormal Returns (ARs) and Cumulative Abnormal Returns (CARs) ... 46
4.1.4 Event Windows ... 47 4.2 Sample ... 49 4.2.1 Sample Description ... 50 4.3 Results ... 53 4.3.1 Univariate Analyses ... 53 4.3.2 Multivariate Analyses ... 66 CONCLUSION ... 74 REFERENCES ... 76
APPENDIX A: Variable Description ... 89
APPENDIX B: Table 4.1. Sample Description ... 91
APPENDIX C: Table 4.2. Target Cumulative Abnormal Returns (CARs) ... 96
APPENDIX D: Table 4.3. Target CARs According to the M&A Waves ... 103
APPENDIX E: Table 4.4. Correlation Matrix ... 105
ix
LIST OF TABLES
Table 4.1 Sample Description………...91
Panel A : Deal Characteristics ... 91
Panel B: Distribution of M&As Years ... 93
Panel C: Distribution of Target Industries ... 94
Panel D: Distribution of Acquirer Industries ... 95
Table 4.2. Target Cumulative Abnormal Returns(CARs) ... 96
Panel A: Full Sample ... 96
Panel B: Merger vs. Major Acquisition ... 96
Panel C: Merger vs. Partial Acquisition ... 97
Panel D: Major Acquisition vs. Acquisition of Partial Interests ... 97
Panel E: Domestic vs. Cross-border M&As ... 98
Panel F: Europe vs Other Acquirer Region ... 98
Panel G: Same vs. Different Industries... 99
Panel H: Public vs. Private Acquirer Firm ... 99
Panel I: Public vs. Subsidiary Acquirer Firm ... 100
Panel J: Private vs. Subsidiary Acquirer Firm ... 100
Panel K: Acquirer Experience Status ... 101
Panel L: Experienced with Same-Different Firm ... 101
Panel M: Overlapped Data ... 102
Panel N: Bank vs. Other Industries... 102
Table 4.3. Target CARs According to the M&A Waves in the Sample ... 103
Panel A: M&A Waves ... 103
Panel B: After 2005 vs. Before 2005 ... 104
Table 4.4. Correlation Matrix ... 105
Table 4.5. Multivariate Analyses of Target CARs ... 106
Panel A: Determinants of Target CAR for [-1,+1] event window ... 106
Panel B: Determinants of Target CAR for [-2,+2] event window ... 107
Panel C: Determinants of Target CAR for [-15,+15] event window ... 108
x
LIST OF FIGURES
Figure 2.1: Number of M&As on Yearly Basis ... 20
Figure 2.2: The Distribution of M&As between 1990-2014 ... 21
Figure 2.3: Industrial Distribution of Target Firms ... 22
Figure 2.4: Industrial Distribution of Acquirer Firms ... 22
1
INTRODUCTION
M&As were used as a strategy since nineteen century. The M&A activities emerged firstly in U.S. and then spread to U.K., Europe and lastly the emerging countries. The companies use the M&As as a strategy for economies of scale, economies of scope, financial synergies, market power, expanding into new markets, growth and diversifying the risks.
The M&As occurred as waves in the World. There are six waves that started in 1893 and extended over the 2000s. The first and second waves took place mostly in U.S. and with the third wave the M&As spread to Europe. The fifth wave spread to the emerging markets with globalization.
The Turkey M&As emerged in 1987 and increased after 1990. However, the increase was not substantial. After 2000 the M&As became more explicit and surged after 2005. While the European Union negotiation affected the investment decisions of foreign investors, the political stability and reform of economic liberalization also affected the domestic and foreign investors’ decisions. The M&As are less risky and less costly than completely new investments. Thus the investors preferred M&As rather than completely new investments.
The wealth effects of M&As are widely studied for developed markets and recently studied for emerging markets. Both in developed and emerging markets the target firms’ CARs are larger than acquirer firms’ CARs. Generally, the acquirer firms gain negative abnormal returns in U.S.. However for Europe and emerging markets,
2
generally the acquirer firms' abnormal returns are zero or positively low. The magnitude of the target firms' CARs is significantly changeable for developed and emerging markets. The target firms’ CARs are significantly larger in developed markets compared to emerging markets. Moreover the difference of developed and emerging markets’ CARs is substantially large for short event windows that include a few days around the announcement date. The M&A related returns are gained prior to the announcement date. Thus it is very difficult to capture all effect of M&As in emerging markets. In order to capture the effect of M&As, pre-event windows are used.
Due to the late emergence of M&As in Turkey, there are a few studies that examine target shareholders wealth effect (Arslan and Simsir, 2015; Hekimoglu and Tanyeri, 2011; Kılıc and Akın, 2008; Yılmaz, 2010; Mandacı 2004). The studies do not analyze the determinants of target firms’ return. The study aims to examine the target CARs especially for pre- announcement event windows and also aims to analyze the determinants of target firms’ returns. The determinants consist of mostly pronounced determinants that include target, acquirer and deal characteristics. However, some mostly used determinants are not used in this study. For instance method of payment and hostile deals are not used in this study. Because the stock payments and hostile deals rarely occur in Turkey. In my sample, there is not any stock payment and hostile deals. Thus the determinants are not used.
3
i. The target firm is publicly traded firm on the Turkish Stock Exchange Market(İMKB).In order to examine target return with share price, the firm should be publicly traded.
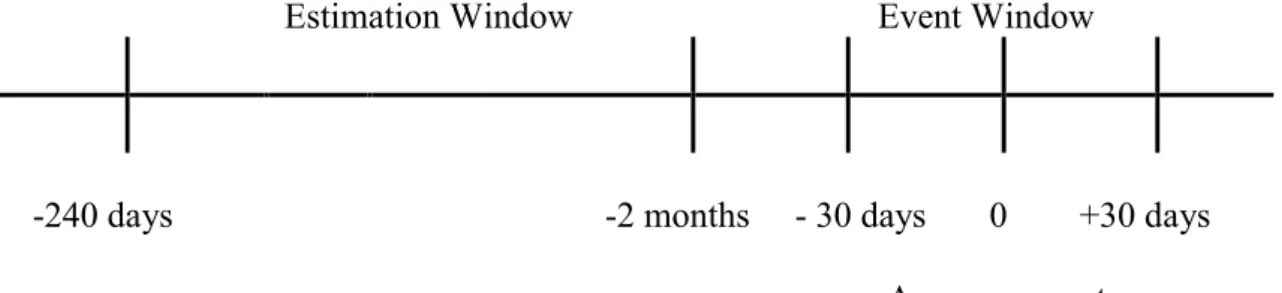
ii. The target firm should be traded for at least 100 trading days pre-two months of the announcement day. For the estimation window, it should include at least 100 trading days.
iii. The transaction should be announced between 1991 and 2014. There is not enough information for earlier years.
iv. The transaction should be completed. In order to examine short-term effects of M&As after the announcement date.
v. If there are any other M&A transactions that related with the target firm, at least two months should be between two announcement dates of the target. If it is less than two months only earlier deal is added to the sample.
vi. For acquisitions, the acquirer should be acquired at least 30% interest of target firm.
After the limitations, the target firms' CARs are calculated by using event study methodology. The event study method eliminates the need of profitability analysis that based financial analysis and became popular method (McWilliams and Siegel, 1997). The advantage of event study method is that the event study method measures the shareholders' wealth effect before and after an event. After the announcement of the event, the market reacts to the new information and the price is readjusted with the new information. The event study method is based on Efficient Market Hypothesis and suggesting that the share prices do not only reflect the firms' value but also the prospects of profit.
4
The study consists of four chapter. In chapter one, the definitions, classifications of M&As and M&A motives are explained. In chapter two, the M&A waves of World and Turkey are explained. In chapter three the literature review of target CARs and literature review of Target CARs' determinants are explained. In chapter four the study methodology is explained and the sample is introduced. Then the univariate and multivariate analysis are presented. And lastly, in the conclusion, the findings are evaluated.
5
CHAPTER 1
MERGERS AND ACQUISITIONS
1.1 Merger and Acquisitions (M&As) and Type of Merger and
Acquisitions
1.1.1 Definitions
Merger as argued by Brockington (1986), is "the amalgamation of two or more businesses which were separate". In other words, if the acquirer acquires the entire target, the transaction will be considered as a merger. After the completed merger, only one company remains, the other one no longer exist. If the acquirer buys only part of the target firm interest, then it is considered as an acquisition. Takeover or major acquisition refer to the acquisition of major interest, namely acquisition of target firm control (Danbolt, 1996).
There are three type of integration as the statutory merger, subsidiary merger and consolidation. In a statutory merger, the acquirer buys target's all assets and liabilities. Thus the target no longer exist. This integration generally occurs when the target firm smaller than the acquirer. In a subsidiary merger, the target firm becomes a subsidiary of the acquirer firm. This integration generally occurs when the target firm has a well-known brand. In a consolidation, both target and acquirer firm are no longer exist and create a new firm. The integration generally occurs when the acquirer and target firm have similar size.
6
1.1.2. Classification of merger & acquisition (M&A) transactions
Hoang and Lapumnuaypon (2007) argue that M&As may be classified in terms of the value chain (horizontal, vertical and conglomerate M&As), relationship (friendly and hostile M&As) or Economic area (domestic and cross-border M&As).
M&A classification in term of value chain
The M&As are classified as horizontal, vertical and conglomerate M&As in terms of the value chain. In horizontal M&A, the acquirer and target are in the same industry and competing firms. The horizontal M&As are done in order to benefit from synergy gains and achieve market power. Moreover, Chunlai Chen and Findlay (2003) suggest that Horizontal M&A surged because of the global industry reconstruction in the poor technological innovations and liberalization.
In Vertical M&A, the acquirer acquires its supplier or client that classified as forward integration and backward integration. If a firm acquires its client or distributor, it is identified as forward integration that moves up the product supply chain. However, if the firm acquires its supplier, then it is identified as backward integration that moves down the product supply chain. The acquirer seeks to reduce its transaction cost and take advantage of economies of scope (Chunlai Chen and Findlay, 2003).
Lastly, in conglomerate M&A, the acquirer and target operate in completely different industries. In spite of no expectation of synergies from this M&A, it is expected to diversify risks and obtain economies of scope.
7 M&A classification in term of relationship
The M&As are classified as ‘friendly' or ‘hostile' in terms of relationship (Chunlai Chen and Findlay, 2003). "When an M&A transaction is undertaken in a friendly manner, the board of the target company agrees to the transaction.” (Hoang and Lapumnuaypon, 2007). Jenkinson and Mayer (1994) state that when the manager of the target firm initially refuses the acquisition offer, the acquisition turns into hostile.
M&A classification in term of economic area
The M&As are also classified as domestic and cross-border which indicate that the parties of M&A are from same or different countries. If the acquirer firm is operating in the different country, it is referred to a cross-border acquisition. If the target and acquirer operate in the same country, then it is referred to a domestic acquisition.1
1.2. Motives of M&As
1.2.1. Synergy gains
Synergy gains may be identified as assuming that all other conditions remain same, the free cash flows that firm is expected to gain with the acquired or merged firm are larger than the cash flows that the acquiring firm gains on its own. The empirical evidences argue the synergy being the common aim of acquisitions (Berkovitch and Narayanan, 1993; Gupta et. al. 1997; Bruce and Christopher, 2000;
8
Goergen and Renneboog, 2004). Synergy gains' motive consists of operational synergy and financial synergy.
Operational Synergy
Maksimovic and Phillips (2001) suggest that M&As are mostly motivated by seeking efficiency increase. The operational synergies, which are based on efficiency, resulted from the economies of scale and economies of scope. The economies of scale provide higher production with a lower marginal cost which is a common motive for mergers. The economies of scale may emerge in case of a larger and financially stronger firm invests in new technologies that considerably enhance its production process, research and development areas (Tirole, 1988).
With technological development, the economies of scope emerged that producing different two or more than two products in the same place, became to be pronounced as M&A motive. The economies of scope facilitate to generate new productions and services and also offer the products/services to the market by using the advantages of the product development, advanced production process and distribution channel (Yılmaz, 2010).
Financial synergy
The merger of two firms reveals merger of cash flows of these firms and it creates more debt capacity, namely the low cost of capital. Especially, the firms with high growth rate, seek fund in order to proceed the development process. The firms head towards M&As in order to achieve low-cost funds. For the financial synergy gain, the acquirer firm should have the opportunity of achieving low-cost fund more than target firm.
9 1.2.2. Market Power
The market power is the ability of a firm to raise the market price of a good or service under the competitive conditions. "The market power enhancement related to industry concentration, product differentiation, entry barriers and cost advantages"(Motis, 2007). Market power is regarded as a motive of horizontal mergers. But these kinds of M&As' success depends on the product differentiation that if the products are not differentiated, namely they are perfect substitutes, the horizontal merger is expected to create market power for the acquirer firm. New investors may cause a reduction in the market power of the firm. Thus the sustainable market power also depends on entry barriers that some sectors, such as bank and telecommunication, are regulated against to new investors.
Vertical M&As may also be resulted in market power by acquiring a key supplier of raw materials. By this way, the acquirer firm may exclude the competitor firms which use the same raw materials.
Even though, the M&As are expected to result in market power. Bruner (2002) study which examined the 130 U.S. M&As during 1971- 2001 period, found that the M&As, which occurred in order to increase the market power, are generally failed.
1.2.3. Rapid Growth
The increasing competition, increasing demand, economic conditions, technological developments and managerial hubris induce the firms' growth desire. Hereat, the firms generally seek growth opportunities in their industry and related industry or occasionally in different industries. There are two growth options for these firms and named as organic growth (internal growth) and external growth (M&A). Organic growth is achieved by increasing output and enhancing sales internally. The
10
organic growth is very costly and risky. Moreover, it presents slow growth. In order to receive a lower cost and more rapidly growth, firms use M&As as a means of growth. Furthermore, there are entry barriers for some industries that restrict new investments. Thus the M&As become a unique option when sectors or industries have entry barriers.
This M&A motive arises in the industries that have excess demand and high competition. The high demand and competition create the growth need and these industries prefer to grow by M&A in order to raise the efficiency of available capacity rather than completely new investment.
1.2.4. Diversification
Diversification motives M&As as industrial and geographic diversification. Both of them in an attempt to reduce the risk. The diversification motive is related to modern portfolio theory which suggests that if a firm diversifies its optimal risk by investing uncorrelated or low correlated instruments, the market value of the firm can be increased (Motis,2007).
When the modern portfolio theory is considered, the acquirer firm may diversify the industrial risk by conglomerate M&As. As a supporting statement, Madura and White (1990) suggest that different features of real assets and financial assets can create diversification benefits. Similarly, the geographic diversification is capable of reducing risk, if the markets of the target and acquirer are not highly correlated. Adler and Dumas (1975) argue that firms benefit from geographic diversification in case of the market not being fully integrated. Fatemi (1984) compared multinational corporations (MNCs) and domestic firms and observed that fluctuation of MNCs returns is lower than domestic firms which is supporting the geographic diversification motive.
11 1.2.5. Hubris
Shareholders and managers are separated in the big complex corporate firms. The principle- agent theory, which is based on the conflicts between shareholders and managers, occurs as a result of the asymmetric information. The shareholders aim to maximize firm value but managers aim to maximize firm size rather than value. Hayward and Hambrick (1997) management research shows that the acquisition performance is decreased as a result of large premiums2 in CEO hubris. Malmendier
and Tate (2008) suggest that overconfidence of CEOs cause overpayment and decrease the M&As performance.
1.2.6 Deregulation
Deregulation is an external motive which has done national level and international level. As a national level, deregulation is done in order to remove the barriers for more competition. As an international level, several legislations were promulgated in order to achieve greater competition and benefit from diversification in the U.S., and encourage the integration in Europe (Berger et al., 1999; Group of Ten, 2004). Mitchell and Mulherin (1996) state that deregulation facilitated the fifth wave which emerged in the 1990s. Moreover, Weston and Chung (1990) argue that numerous M&As were done in the industries with ongoing deregulations.
1.2.7 Globalization
Cross-border M&As are usual and the least risky method for increasing global market power. The U.S. cross-border M&As have been stably increased, because of
2 Calculation bid premiums is another method of measuring shareholder wealth of M&A on target
firm which compares the offer price with target’s stock price before the announcement date (Arslan and Simsir, 2015).
12
the globalization of product markets (Lipton, 2006). Globalization is one of the most significant motives for fifth and sixth M&A waves. Martynova and Renneboog (2005) state that significant proportion of cross-border M&As ensued from the increasing globalization of product, services, and capital markets in the 1990s.
1.2.8 Other Motives
There are some other motives which do not influence the M&A decisions as much as the priorly mentioned motives. These motives as follows; tax consideration, know-how, inefficient management.
Tax consideration motive is considered as reducing the tax on the newly merged firm by the tax losses of the target firm.
Firms may diffuse know – how motive by M&As. Indeed, in some studies, the know-how motive is regarded as a synergy motive. Goold and Campbell (1998) specify synergy with six form which includes know-how motive.
The inefficient management hypothesis asserts that the firms with inefficient management will be acquired by firms that could manage it more efficiently (Berger
et al., 2000). Thus for inefficiently managed firms, inefficient management may be a driver to increase their efficiency.
13
CHAPTER 2
MERGER AND ACQUISITION WAVES
2.1. Merger Waves in the World
Mergers and acquisitions emerged at the end of the nineteenth century in the U.S. and then surged as waves (Lipton, 2006). The waves were specified by considering number and value of transactions. When we observe the M&A waves, it is seen that the waves emerged and changed due to the economic cycle and industrial shocks. Harford’s (2005) neoclassical explanation of merger waves suggest that;
"Specific industry shocks that require a great extent reallocation of assets, induce the merger waves. Beside the shocks, there must be enough capital liquidity in order to reallocate of assets. The rise of the capital liquidity and reduction in financing constraints is related to high asset values. He concludes the explanation of merger wave as, the merger waves require both an economic motivation for transactions and relatively low transaction costs for generating the large volume of transactions." Similarly, Rhodes-Kropf and Viswanathan (2004) indicate that the M&As, especially with stock payment M&As, increased as a result of the overvaluation of the firms' share price. This statement shows a positive relationship between the overvaluation and frequency of M&As.
14
In addition, Toxvaerd (2008) indicates that the external factors such as deregulation, globalization, and the technological developments, make the M&As more attractive by changing the industrial environments and conditions.
The motives of waves are presented in this section for each wave separately. Six M&A waves were observed over the period 1893-2007 and each wave was named with its feature that indicates the density of M&A type or specific industries' M&As (Motis, 2007).
2.1.1. First Wave 1893-1904
The first wave occurred as a result of economic constriction at the end of the nineteenth century that prompted the firms to enhance the market power (Yılmaz, 2010) and reduce the price competition rather than benefit from scale economies (Lamoreaux, 1985). Thus the first M&A wave mostly consists of horizontal mergers in steel, telephone, oil, mining, railroad industries in the U.S.. Due to many small firms being consolidated with horizontal mergers, the wave is called as the merger for monopoly (Motis, 2007). Against to this big monopolies, antitrust laws emerged in U.S. which enacted in 1904. However, the First World War had influenced the first wave to end.
2.1.2. Second Wave 1920s
The second merger mostly occurred as vertical mergers. Both first and second M&A waves took place mostly in the U.S.3. Sudarsanam (2003) suggest that execution
3 Thus vast of M&A literature mostly search U.S. M&As. The early U.S. merger waves documented
but reliable documents of UK M&As are available from the 1960s and 1980s for Continental Europe (Martynova and Renneboog, 2005)
15
of the anti-trust laws led to second merger wave that started in the late 1910s and proceeded through the 1920s. While in the first wave firms were seeking for market power in order to reduce the price competition, in second wave firms had aimed to benefit from scale economies through vertical mergers. Stigler (1950) states that the second wave led an oligopolistic structure that is dominated by two or more giant companies. The second wave continued until 1929, the emergence of Great Depression.
2.1.3. Third Wave 1950s – 1970s
The Great Depression and Second World War frustrated the new third M&A wave. The third wave started in the 1950s and culminated in 1968 and collapsed in 1973 (Martynova and Renneboog, 2005). Although the third wave identified as a conglomerate wave, conglomerate M&As were dominated in the U.S. due to the strict antitrust laws and in the UK mostly horizontal M&As took place (Sudarsanam, 2003). Matsusaka (1996) state that even if the absence of strict antitrust policies, the countries as Canada, Germany, and France also experienced conglomerate M&As in the 1960s. Some studies provide the clarification about the reasons of conglomerate M&As. It is suggested that due to the imperfection in the external capital market (Williamson, 1970), the companies solved the liquidity problem by diversification in order to develop the internal capital market. This diversified companies reduce the risk of bankruptcy (Higgins and Schall, 1975; Shleifer and Vishny, 1992) and reduce the variability of revenues (Lewellen, 1971). However, Ravenscraft and Scherer (1987) could not find the evidence of profitability improvements for conglomerate M&As.
16 2.1.4. Fourth Wave 1980s
After the crash of diversified firms' stocks, the fourth wave emerged in 1980 and ended up in 1989. Due to M&As mostly occurring as hostile M&As, the fourth wave is also called as disciplinary mergers (Motis, 2007). The wave is triggered by antitrust policy changes, deregulation of the financial service sector, new financial instruments, new markets (junk bond market), and technological advance in some industries (Martynova and Renneboog, 2005). The imperfection of conglomerate integration led to the emergence of the fourth wave. The problems are created by conglomerate M&As, such as rent-seeking by divisional managers (Scharfstein and Stein, 2000) and bargaining issues within the diversified companies (Rajan et al.2000), were expected to be solved by leaving aside the diversification and focus on core business. Additionally, some failed companies of diversification were restructured by hostile riders.
Due to the economic, technological, and regulatory changes in the 1980s, the external market became more efficient and it resulted in less requirement of the internal capital market which was a motive for diversification (Bhide, 1990). The decrease of conglomerate M&As is considered to be a result of the inefficient internal capital market (Lang and Stulz, 1994; Berger and Ofek, 1995).
2.1.5. Fifth Wave 1990s
The fifth wave emerged in 1993 and continued until the equity market collapse in 2000. The globalization process, deregulation, privatization, technological development, and financial market expansion promoted the fifth wave (Martynova and Renneboog, 2005). According to Mitchell and Mulherin (1996), the most prominent motives in this wave were deregulation and privatization. Andrade et. al. (2001) allege
17
that the other prominent motive was the internet revolution. Banking, Financial Services, Telecommunications, Entertainment, Media and Technology industries were dominated industries in this wave (Motis, 2007). Most of the deals' payment methods are stock payment and generally the acquirer and target firms are in the same industry (Andrade et al., 2001). According to Thomson Financial Securities Data, while 119035 M&A deals were registered in the US, 116925 deals were registered in Europe. When we compare such a substantial wave with the fourth wave, only 34494 and 12729 deals occurred in the U.S. and Europe respectively (Martynova and Renneboog, 2005). Asian M&As also emerged and as a result of globalization, cross-border M&As largely increased in the fifth wave. While the horizontal and vertical M&As were increasing, it decreased the proportion of diversified M&As. Moreover, the hostile bids decreased. Martynova and Renneboog (2005) state that the decrease of hostile M&As may be a result of regulatory changes and also bull markets which indicate that target shareholders more likely to approve lower bids when their shares overpriced. Although the hostile M&As decreased in the U.S. and the UK, it increased in Continental Europe. More interestingly, it emerged in the countries with no experience of hostile M&As in the 1980s (Martynova and Renneboog, 2005).
2.1.6. Sixth Wave 2003- 2007
The sixth M&A wave emerged in 2003 and continued until 2007. The collapse of the sixth wave is attributed to the mortgage crisis which emerged in U.S. and spread around the World. The M&As during the sixth wave induced by the globalization, encouragement by the governments, the availability of low-interest financing, and hedge fund (Lipton, 2006). Martynova and Renneboog (2005) state that the wave started with the recovery of the economy and financial market which collapsed in
18
2000. And mostly it is motivated by the presence of abundant liquidity (Alexandridis et. al., 2012). Alexandridis et. al., (2012) which studied sixth merger wave, state that acquirers are less overvalued relative to target firms in sixth merger wave and the market for corporate control was less competitive. they also state that acquirers were less acquisitive. Malmeinder and Tate (2008) suggest that the managers were less overconfident. Thus fewer premiums and returns occurred for target firm in the sixth wave compared to the fifth wave. Alexandridis et. al., (2012) suggest that the cash payments took place in 2003-2007 (sixth wave) in contrast to the 1990s (fifth wave). This is a result of less overvalued acquirer firms relative to target firms.
2.2. The M&A Activities in Turkey
2.2.1. The M&A Waves
The M&A activities emerged lately in Turkey and in other emerging countries compared to the developed countries. The first, second, third and fourth M&A waves, which were mentioned previously, have not been effective in Turkey, meanwhile the fifth and sixth waves spread around the emerging markets. This spread is attributed to the globalization. The globalization of markets and industries affected the economy globally over the past 25 years. Lifting the trade barriers, cost reduction of international trade and communication, common financial market effect and the reforms promoted the globalization (Wiersema and Bowen, 2008). While the globalization increased the cross-border M&As around the world, it brought with an effective competition process for international competitors. Due to the rugged competition conditions, the firms seek to achieve economies of scale and scope (Wiersema and Bowen, 2008).
19
Although the Turkey M&As emerged in 1987, the number of the deals are very few to analyze properly. Indeed the M&As emerged with the fifth wave in Turkey as a result of globalization and technological development. Turkey M&A waves are specified according to M&A frequency and economic progress. Due to the late emergence of M&As, there are a few studies about M&As in Turkey literature. Thus sources are scarce about Turkey M&A waves. Akdoğu (2011) studied Turkey M&A waves between the period 1988-2008 and presented M&As with the number of observations and value of them for each year. The specified waves in Akdogu's study are in line with my study.
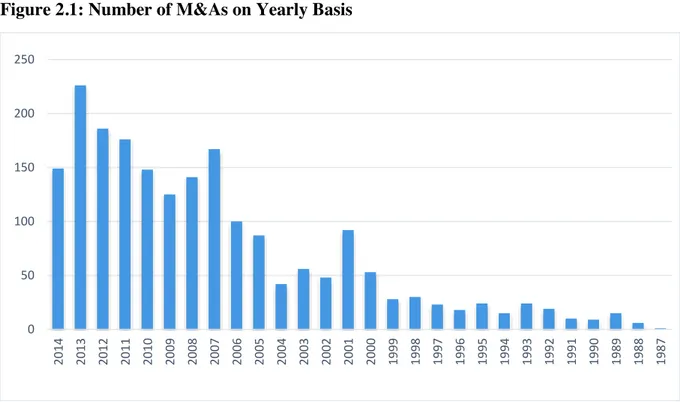
Figure 2.1 presents the M&As distribution on yearly basis. Even if the M&As emerged in 1987 and became more explicit after 1990 in Turkey, there are a few deals during the 1990s. However, after 2000 the number of M&As significantly increased. When we analyze the period of 2000-2001 which indicates Turkey Financial Crisis, only 145 M&As were announced. During 2002-2004 which indicates the crisis recovery period, only 98 M&As were observed. In addition, 85 deals were announced in 2005. After 2005 the increase of M&As became more significant. Thus the periodic increase of M&As implies M&A waves. Figure 2.2 presents the distribution of the completed M&As between 1990 and 2014 by these periods. When analyzed the M&As during the 1990-1999 period, there are only 200 M&As that correspond to 10% of all completed M&As during 1990-2014. There are 1796 M&As between 2000 and 2014 which implies that actually, M&As surged after 2000 in Turkey. The completed M&As, which are announced during 2000-2004, constitute 15% of total completed M&As during 1990-2014. Moreover, 75% of M&As were announced between 2005 and 2014. Additionally, the highest number of M&As are observed in 2013.
20
When M&As are analyzed in terms of deal value, it is seen that the completed M&As that were announced after 2000, constitute a great majority of total deal values between 1990 and 2014. According to the study of Akdogu (2011), the total deal value of M&As, which were announced during 1988-2014, is 187 billion dollar and 163 (87%) billion dollar belongs to the deal that announced after 2000. Moreover, 137 billion dollar of the 163 billion belongs to the M&As which were announced between 2005 and 2008. Also, emphasized that even the deal number of 2000 is lower than deal numbers of 2001, the total deal value of 2000 is higher than the total deal value of 2001.
Figure 2.1: Number of M&As on Yearly Basis
0 50 100 150 200 250 2014 2013 2012 2011 2010 2009 2008 2007 2006 2005 2004 2003 2002 2001 2000 1999 1998 1997 1996 1995 1994 1993 1992 1991 1990 1989 1988 1987
21
Figure 2.2: The Distribution of M&As Between 1990 and 2014
2.2.2 The Industrial distribution of Target and Acquirer Firms
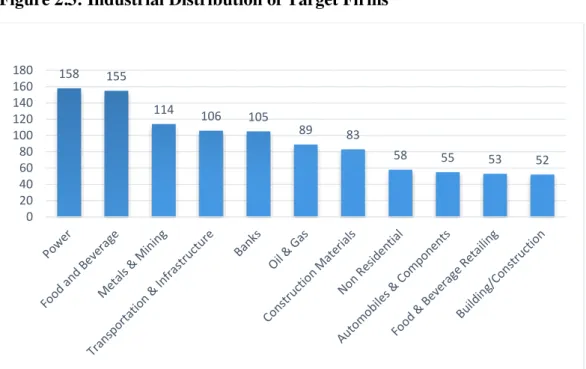
Figure 2.3 presents the mostly observed eleven industries of target firm between 1990 and 2014. The 1028 deals of total 1996 completed deals are with the target firms of these eleven industries. Namely, the industries are the most active industries. The industries of Power and Food & Beverage are most active industries with 158 and 155 deals respectively. The industries of Metals & Mining, Transportation & Infrastructure, and Banks are also mostly observed industries between 1990 and 2014.
Figure 2.4 illustrates the mostly observed eleven industries of acquirer firm between 1990 and 2014. The Other Financials is most active industry but actually, it does not represent an industry. The Other Financials include investor groups, personal investors, holdings and investment companies. Due to these acquirer firms being regarded as other financials, the deal number of Other Financial industries are larger
2005-2014; 1505; 75% 2000-2004; 291; 15% 1990-1999; 200; 10%
22
than other industries. The Food & Beverage, Metals & Mining and Power are also mostly observed industries between 1990 and 2014.
Figure 2.3: Industrial Distribution of Target Firms
Figure 2.4: Industrial Distribution of Acquirer Firms 158 155 114 106 105 89 83 58 55 53 52 0 20 40 60 80 100 120 140 160 180 175 103 87 75 69 57 56 53 50 42 38 0 20 40 60 80 100 120 140 160 180 200
23
2.2.3. The Features of the M&A Wave Periods
The M&A waves did not remain only in the U.S and Europe and spread into emerging markets. The spread is associated with globalization. But as mentioned priorly, Turkey M&As surged in the 2000s.While Akdogu (2011) points out two wave between 1988 and 2008, I observe the increase in 2013 due to observing wider period in the current sample.
Firstly, when 2000-2001 period is analyzed, the mergers of the firms, which attend to recover after 2000 financial crisis in Turkey, indicate a negative shock effect. In fact, the lower deal value of 2001 compared to 2000, may be a result of this shock effect. A more clear expression, the small target firms that were badly affected by the financial crisis, were acquired in 2001. As a result of the small firm acquisitions in 2001, the total deal value of 2001 deals decreased.
After this period, more apparent wave emerged in 2005 and increasingly continue towards 2014. After the dot-com crisis, world markets recently recovered in 2003 and the sixth merger wave appeared. In spite of the sixth wave effect not being so rapid, it is seen in Turkey after 2004. More importantly, the political stability, reform of economic liberalization and entering into negotiations of the European Union full membership induced the M&A wave in Turkey.
After 2008 Global Crisis the M&A decreased and again start to increase after 2010. The increase became more apparent in 2013. The increase that occurred in 2013 is clarified by Earns and Young 2013 M&A report as while the developed economies' growth rates remain limited, Turkey growth rate outperforms the previous growth rate that attracts the foreign investor. Moreover, according to Earns and Young report the increase of credit rating by independent credit rating agency, not only influenced
24
money market and short-term economic indicators but also it strengthened Turkey in term of medium and long-term investments which directly related to M&As.
25
CHAPTER 3
LITERATURE REVIEW
3.1 Literature Review of Target CARs
When viewing the literature, both target and acquirer firms’ returns that occurred before and after the announcement date, are generally analyzed by CAR method. In these analyses, different long- short event windows, estimation periods and methods are used. Some of these studies analyze the completed M&As as I do, while some of them analyze all deals irrespective of it completed. Unlike my sample, U.S., UK, Europe, emerging market and Asia studies have the large sample size and thus it is possible to observe more significant results.
The vast of studies search U.S., UK and developed markets. First of all, we present the developed markets starting with U.S. and then emerging markets’ studies are presented.
3.1.1 Developed Markets
As an earlier study of U.S. mergers by Andrade et. al. (2001) evaluated merger waves between 1973 and 1998. They distinguish the period as 1973-1979, 1980-1989 and 1990-1998 and examine the stock reaction for 3 days [-1, +1] and 21 days [-20, 0] event windows. They found 1.5% and 0.1% average CARs for 1973-1979 wave in these [-1, +1] and [-20, 0] event windows respectively. The average CARs are
26
evaluated as 2.6% and 3.2% for 1980-1989 period and 1.4% and 1.6% for 1990-1998 period for the event windows respectively.
The other earlier U.S. M&A study Swenson(1993) that investigate U.S. targets' CARs between 1974 and 1990, found highly abnormal returns in -1 and 0 (one day prior the announcement day and announcement day) event days but not for 20, 15, -10 event days (20, 15,-10 days prior the announcement day).
The other more recently study for U.S. M&As studied by Kıymaz and Baker (2008), displayed 12.55% average CAR for 1, 0] event window and 11.45 % for [-30,-1] event window. The findings indicate that the shorter event window CARs are higher than longer event window. However, there is not a too large difference between two event windows' average CARs.
Kyei-Mensah (2011) investigates abnormal returns of U.S. targets and bidders over the period 1988-2008. The research based on different estimation methods such as the method CAPM which I use for this study. The methods are standard CAPM model, Fama and French three-factor model and Chart four-factor model within OLS-GARCH estimation method. The pre and post- announcement returns are evaluated 20 days prior and 20 days after the announcement date and results of standard CAPM within OLS estimation method are 0.383%, 5.231% and 5.109% for [-20, -1] , [-1,+1] and [0, +1] event windows respectively. The highest returns are evaluated for the announcement and the next day. After the announcement date, the abnormal returns diminish and become negative.
Alexandridis et al. (2011) analyzed completed M&As of U.S. that announced between 1990 and 2007. They distinguish the target firms as small, medium and large
27
target firms and found respectively 24.46%, 19.76 and 16.74 significant average CARs for [-1,+1] event window.
As an early UK M&A study Archbold (1998) researched UK M&As between the period 1980-1990 and found insignificantly 0.6% average CAR for [-30, 0] event window. Moreover, larger event windows are used in this study as [-80, 0] and the average CAR is evaluated as 1.5% for this [-80, 0] largest event window
Danbolt (1996) analyzed the UK cross-border and domestic acquisitions between the period of 1986 and 1991 with quite large event windows as 8 months prior and 1 month after the announcement date. Through this analysis, cross-border UK acquisitions resulted in significantly positive returns for [-2, +1] event window which indicates 4 months. In addition, the highest abnormal returns are evaluated for the announcement month. But for the remaining prior months, the abnormal returns are observed as negative. However, for the domestic UK acquisitions only for [-1, 0] event window, which indicate two months, significantly positive abnormal returns are evaluated.
Campa and Hernando (2004) investigate M&As of the firms that are registered in the European Union over the period 1998-2000. They found 5.72%, 5.30% and 3.93% Cumulative Average Abnormal Returns (CAARs) for 60,-1], 30,-1] and [-1, +1] event windows. They also evaluate positive CAARs for acquirer firms.
The research of Martynova and Renneboog (2011) for Continental European and the UK, M&As during the fifth takeover wave (1993-2001) evaluated positive significant CARs for both target and bidding firms. For [-1, +1] event window the target average CAR is 12.47% and 0.72% for bidder. For the larger 40, -1] and
[-28
60,+60] event windows, target average CARs are 11.49 and 26.70% and the bidder average CARs are 0.39% and -2.83% respectively. They also found higher CARs for UK target firms than Continental target firms.in
The research of Craninckx and Huyghebaert (2011) which examines European completed acquisitions between the period of 1997-2006, found significantly 6.12% , 7.57%, 15.65% and 17.47% target average CARs for 1,0], 1,+1], 35,+1] and [-50,+1] event windows respectively. They also found positive low CARs for acquirers.
Borges and Gairifo (2013) investigate four European countries (Belgium, France, Netherlands, Portugal) from 2001 to 2007. They found significantly 14.76 % average CAR for [-1, +1] event window and for [-30, -2] event window the average CAR is 4.31% that shows most of the returns occurred around the announcement date.
3.1.2 Emerging Markets
As an emerging market study, Mann and Kohli (2011) investigate the domestic and cross-border acquisitions' effect on shareholder’s wealth over the period 1997-2008 in India. They extend their analysis to 50 days prior to 30 days after the announcement date. For the domestic acquisitions they observed -1.56%, 6.33%, 8.26% CAARs for [-50, -41], [-20, -11] and [-1, +1] event windows respectively. The results of the cross-border acquisitions are as 1.32%, -1.70% and 5.33% for the same event windows. The highest and significant CAARs are gained around the announcement date for both domestic and cross-border acquisitions.
When we evaluate emerging markets, Arık and Kutan (2015) researched twenty emerging market M&As between 1997 and 2013. They evaluate the return
29
reaction over 30 days prior the announcement date and found 9.56%, 5.17% and 3.90% CARs for [-30, +1], [-1, +1] and [-1, 0] event windows respectively.
Sehgal et al.(2012) investigate the BRICKS market (Brazil, Russia, India, China, S.Korea, South Africa) stock returns over the period 2005-2009 and found 2.07% and 1,95% CAR for [-20, +20] and [-1, +1] event windows respectively. They evaluate the effect separately as well and while India, Russia, S.Korea, China have positive abnormal returns, Brazil and S. Africa have negative abnormal returns during the 20 days pre-announcement date period.
Wong and Cheung (2009) study examined the effect of Asian M&As (China, Japan, Hong Kong, Singapore, South Korea and Taiwan) on target and bidding firm return over the period 2000-2007. They include all M&As in either case completed or not. They evaluated insignificantly -2.5%, -0.24% and -5.2% CAARs for [-50,-2], [-1, 0] and [+1, +50] event windows respectively. These results are contrary to literature. Interestingly, the bidders’ CAARs are significantly positive for [-50,-2] and [+1, +50] event windows and significantly negative for [-1, 0] event window. They state the reason of negative target CAARs as speculation that the target stock had bought before the observed period by investors and speculators and the stocks are sold back in case of deal failure. Pop (2006) found insignificantly low CAARs for Romania acquisitions and used the estimation methods as market model and trade to trade model which considers infrequent trading (Maynes and Rumsey, 1993).
There are a few M&A studies that examine the shareholder wealth effect in Turkey (Arslan and Simsir (2015), Hekimoğlu and Tanyeri (2011), Kılıç and Akın (2008), Yılmaz (2010)). Turkey M&As are examined as an emerging market in some
30
studies as well (Rossi and Volpin (2004), Arık and Kutan (2015)). Some of the few studies that are also similar to my research as follows.
Çakır and Gülcan (2012) examine the market reactions of Turkey non-financial M&As and found positive returns. Due to the early pre-announcement returns, they state that the Turkish market is inefficient.
Arslan and Simsir (2015) measured the takeover premium of cross-border Turkey M&As over the period 2005-2011. Their study is based on detecting the original announcement date. They argue that the announcement dates, which SDC database presents, are not a proper benchmark for measuring the returns. They studied the sample in detail and specified the original announcement date (ODA). Then they measure the bid premium estimates for both ODA and the SDC announcement date and found that the bid premium estimates of SDC announcement date are lower than the bid premium estimates of ODA. They also measured target CARs for ODA and the SDC announcement date. They found 2.5% and 5.5% average target CAR for [-1, +1] event window of ODA and the SDC announcement date respectively. This finding shows that the announcement dates, which SDC database serves, prevent observing the actual returns/market reactions.
Hekimoglu and Tanyeri (2011) investigate the non-financial target firms' returns over the period 1991-2009. They found that Turkish targets gain 8.56% average CARs for [-1, +1] event window in case of the bidders get the control rights and 2.25% if the bidders acquire low interests.
Consequently, the literature shows that the CARs of target firms are higher in developed markets than emerging markets. In some studies, the developed markets' early pre-announcement date target CARs are also higher than emerging market early
31
target CARs. Moreover, the emerging market early pre-announcement CARs are higher than the shorter event windows' CARs that occurred around the announcement date. Thus target firms' CARs are more observable in developed markets compared to the emerging markets. In emerging markets, it is very difficult to observe and evaluate the real effect of M&As.
3.2 Determinants of Target Abnormal Returns
3.2.1 Cross-border
Cross-border acquisitions are substantially increased around the world as a result of deregulations and globalization (Danbolt and Maciver, 2012). Evenett (2003) state that cross-border acquisition activities have increased by the end of the 1990s. Furthermore, the 80% of all foreign direct investment in industrialized markets consist of cross-border mergers (Conn et al., 2005). Arık and Kutan (2015) researched whether any change occurred on abnormal returns during the post-2008 crisis which is resulted in the substantial monetary expansion in advanced economies. The monetary expansion affected the global liquidity and by extension of international financing opportunities which including cross-border acquisitions in emerging markets. The developed countries might have been seeking the growth opportunities out of their markets through the emerging market investments in order to pursue their competitive advantage while obtaining diversification benefits. (Grave et. al. 2012)
As a consequence of the cross-border acquisitions’ increase, the question arisen whether cross-border acquisitions have an effect on target and acquirer returns or not.
32
In other words, whether cross-border acquisitions’ wealth effects significantly differ from domestic acquisitions or not.
First of all, I present the studies about the cross-border acquisitions from developed countries. The research of Danbolt and Maciver,( 2012) which including 251 UK acquisitions over the period 1980-2008, found that cross-border acquisitions create significantly higher returns 10.1 percentage points over 3-day event window. In addition, they found that target's gains are significantly higher in cross-border acquisitions compared to domestic acquisitions in case of bidder's country has higher accounting quality, anti-director rights or level of shareholder protection. Goergen and Renneboog, (2004) analysis of European acquisitions over 1993-2000 shows interesting results which domestic M&As create higher results than cross-border M&As. This result is not consistent with foreign direct investment (FDI) theories which provide that foreign bidders create larger gains as a result of the benefit from imperfections in factor and capital markets. According to this theory, cross-border acquisitions are expected to result in higher returns, due to the higher premiums. Georgen and Renneboog also used country dummies in order to show target location effect. Indeed the dummies display the institutional differences. Additionally, they found higher returns for the UK, German, Austrian and Swiss target firms. But for France, the Benelux countries and Southern Europe target firm dummies have not resulted in higher returns. This result indicates the institutional differences, takeover regulation, protection of shareholder rights, and informational transparency. The research of Conn and Connell (1990) which studies over the period 1971–1980 and the research of Feils (1993) over the period 1980–1990 examine cross-border acquisitions between UK and U.S., and found the wealth effect for U.S. target firms is
33
significantly larger than the UK target firms (40% versus 18% in the study of Conn and Connell and 26% versus 16% in the study of Feils). Harris and Ravencraft (1991) state that due to the factor and capital markets are not being segmented internationally, the domestic acquisitions do not differ from cross-border acquisitions. Bertrand and Zitouna (2008) investigated the effect of M&As on French manufacturing target firms’ efficiency and found that the efficiency gains are stronger in cross-border M&As.
Rossi and Volpin (2004) investigated the determinant of cross-border M&As through forty-nine developed and emerging countries. They identified the determinants as accounting standards, shareholder protection, takeover regulations, laws, common law, the log of GNP per capita, market return. The important finding of this study with regards to our study is the frequency of M&As between two countries being related with their investor protection differences. In other words, according to this study, acquirer generally from the countries that with better accounting standards and shareholder protection than target countries. Moreover, they state that the cross-border M&As increase the target company’s shareholder protection. However, their examining of takeover premiums shows that shareholder protection differences are not a significant determinant on takeover premiums. However, cross-border deals significantly create average 3% premium increase.
When examining emerging markets, Arık and Kutan (2015) study with twenty emerging markets, observed positive insignificant effect for cross-border acquisitions on emerging target firms which is consistent with our study.
As a conclusion, the studies of cross-border effects on target gains are generally insignificantly positive for both the emerging and developed markets.
34 3.2.2 Industry Relatedness
The industry relatedness and degree of it between acquirer and target firms is mostly pronounced and associated with abnormal returns of M&As. Same industry or focus oriented acquisitions' main reason is synergies which mentioned in detail in M&As motives section (1.2.1.). Because of the economic scale, cost reductions, and related bidders well knowing about underperformance and inefficiency makes the deal more likely create positive gains.
The diversity and chaos of diversified firms may resulted in a decline in efficiency of the internal capital market with relative to the external markets (Stulz, 1990; Matsusaka & Nanda, 1997; Rajan et al, 2000). Although the general belief is management conflicts increase and result in inefficiency and hence decrease in returns, some studies present evidence that the diversified acquisitions create additional abnormal returns on target returns than the related acquisitions. Generally, this effect is clarified with aggressive biddings of unrelated firms as a result of agency cost (Flugt, 2009). Furthermore, diversified acquisitions are alleged to diversify the risk which is arisen from industrial waves and economic cycle (Tao, 2009).
Martynova and Renneboog (2006) studied with 2.419 takeovers which include 861 unrelated takeovers of Europe over the period 1993-2001, found that unrelated takeovers significantly created 2.4 % higher return on target shares than related takeovers. They state the reason likely to be aggressive bid and willingness of bidders to overpay for the unrelated target. Tao (2009) investigated 310 acquisitions in the UK between 1994 and 2006 and found that unrelated acquisitions' returns are insignificantly higher than related acquisitions in both event windows [-20, +20] and
35
[-1, +1]. Flugt (2009) studied with 288 deals in the European Union over the period 2000-2008, found insignificantly focused (related) deals' returns larger than diversified deals. Kıymaz and Baker (2008) investigated the short-term effect of large M&As of U.S. public targets from 1989 to 2003 and found positively insignificant result for related acquisitions.
Arık and Kutan (2015) studied with twenty emerging markets over the period 1997-2013 and did not observe a significant effect of relatedness of firms in M&As which is consistent with my findings.
Consequently, the findings of industry relatedness effect on returns are mix and there is not any exact expectation about it.
3.2.3 Firm Size (Market Capitalization of Target Firm)
In the literature, target firm size is controlled separately or as relative size which is formulated as acquirer firm size is divided by target firm size. Relative size is used to examine both of the firms' effects on returns. The studies, which used target size to observe size effect on returns, show generally negative relationship between target size and abnormal returns. In other words, smaller targets create larger abnormal returns. These results may have occurred as a result of valuation problems. Dong et al. (2006) state that the targets that get lower bid premiums or abnormal returns are highly-valued. Suggesting that large target firms are more highly-valued, the negative effect may be attributed the firm valuation as a solution to the valuation problem. The other reason of negative relationship between target firm size and abnormal returns may be fewer competitions for large firms namely scarce potential acquirers (Gorton et. al. 2009). Alexandridis et. al. (2011) state that acquirers pay lower premiums for larger target firms. The negative correlation between target size and premiums is valid
36
after controlling other determinants of premium. They also state that large targets lose value over the long period and result in less synergy gains. But small targets create positive returns for the shareholders. Danbolt and Maciver (2012) research, which investigates the cross-border domestic acquisitions, shareholder wealth effect, and firm size effect, found that target size effect on CARs is significantly negative. Campa and Hernando (2004) research of European Union acquisitions over the period 1998-2000, found higher target abnormal returns when the target is small relative to bidder size. Rossi and Volpin (2004) research which include Turkey as well over 1990-1999, found that target size affects premiums significantly negative.
Kuipers et.al (2009) study that investigates the cross-border takeovers for U.S. targets during the period of 1982-1991, found that targets' returns are significantly higher in a condition of the target firm larger than the acquirer firm. The significant result is not valid when they add other variables, but still, the coefficient is positive.This finding contradicts the literature.
Consequently, the target size effect on returns is mostly negative in the literature.
3.2.4 The Experience of Acquirer Firm
Experienced acquirer is generally pronounced as experienced acquirer, frequently experienced acquirer or frequent acquirer in the literature. Generally, the acquirer experiences pre and post effect are evaluated for acquiring firm not for target firm. Thus there are a few empirical studies about the experienced acquirer effect on target returns which indicate that target firms gain higher returns in case of the
37
acquirers have prior experiences (Dunne and Ndubizu 1995; Malmendier and Tate 2008).
The positive effect of acquirer experience on target return most probably result from the belief of the experienced acquirer's success. Power (1982) state that the prior experience of the acquirer is a substantial predictor of the further acquisition’s success. Paine and Power (1984) indicate that companies need experience for successful acquisitions. Besides, the positive market reaction to the experienced acquirer may ensue by well knowing about acquirer firm. Fuller et al. (2002) state that because of the frequent corporate activities of the experienced acquirer, the frequently experienced acquirers are more likely to bring out information about their firm characteristics to the market. Thus the market reactions to experienced acquirers differ from inexperienced acquirers. Other reasons for the positive effect may be the acquirer organizational experience and detecting more efficient targets (Vermeulen and Barkema, 2001). The more efficient target decision more likely to resulted in post-acquisition success for acquirer firm. As a post-post-acquisition performance, the process of adaptation and organizational performance of the experienced acquirer probably better than the inexperienced acquirer.
The study of Dunne and Ndubizu (1995) presents that the target shareholders gain more wealth when the acquirers have prior experience in U.S. market. Positive wealth effect may be explained by "The Managerial Hubris Hypothesis" suggested by Roll in 1986, allege that the value destroys of acquirer firm is caused by the optimistic managerial behavior. Suggesting that the management of experienced acquirer take into consideration the previous experience rather than the current one. Due to the optimistic belief and overconfidence, overpayment to the target occurs or higher
38
leverage for paying following acquisitions (Moeller et al. 2004; Malmendier and Tate, 2008). Conn et al. (2004) also assert that the following acquisitions are likely to be value destroying. Billett and Qian (2008) state that overconfidence may deflect the acquirer decision. There are several studies that provide evidence of hubris such as; Bruner (2002), Hietala et al. (2003), Malmendier and Tate (2003), Billett and Qian (2008), Doukas and Petmezas (2007).
Contrary to the studies, the M&A experience of acquirer may cause lower target abnormal returns or premiums in that the experienced acquirers probably manage the bidding process better than inexperienced acquirers. Thus experienced acquirers may not overpay.
In conclusion, general belief and expectation of experienced acquirer effect on target firm returns are positive.
3.2.5 Bank M&As
Banks are usually analyzed separately rather than use as a variable in general analysis. Bank M&As examination studies are much available in the literature. These studies generally investigate the efficiency effect of bank M&As in the long run. There are short-run effect analyses which examine the announcement effects on returns as in my study. In general, financial targets are examined separately due to the reaction differences or financial target dummies/heavily regulated industry dummies being used in order to observe their effects separately.
The policies for reconstruction of the banking industry are regarded as M&A motives in the belief of stability improvement in the financial system of emerging countries (Hawkins and Mihaljek, 2001). Thus bank M&As are expected to create