Contents lists available atScienceDirect
Small Ruminant Research
journal homepage:www.elsevier.com/locate/smallrumres
Short communication
The analysis of mitochondrial data indicates the existence of population
substructure in Karayaka sheep
Koray Kirikci
a,1, Antonia Noce
a, Mehmet Akif Cam
b, Levent Mercan
c, Marcel Amills
a,d,⁎aDepartment of Animal Genetics, Centre for Research in Agricultural Genomics (CRAG), CSIC-IRTA-UAB-UB, Campus de la Universitat Autònoma de Barcelona,
Bellaterra, 08193, Spain
bDepartment of Animal Science, Faculty of Agriculture, Ondokuz Mayıs University, Samsun, 55200, Turkey cDepartment of Agricultural Biotechnology, Faculty of Agriculture, Ondokuz Mayıs University, Samsun, 55200, Turkey dDepartament de Ciència Animal i dels Aliments, Universitat Autònoma de Barcelona, Bellaterra, 08193, Spain
A R T I C L E I N F O
Keywords:
Population subdivision Genetic diversity Turkish ovine breeds Analysis of molecular variance Mitochondrial control region
A B S T R A C T
In the current study, we investigated the existence of population substructure in the Karayaka sheep breed from Turkey. A fragment of the mitochondrial D-loop region has been successfully sequenced in 69 Karayaka sheep sampled in the districts of Çarsamba, Bafra and Ladik. Though the B haplogroup was the most abundant in these three subpopulations, haplogroup frequencies and nucleotide diversities were remarkably different. The analysis of molecular variance (AMOVA) showed the existence of a significant (P-value = 0.019) between-subpopula-tions component representing 5.14% of the total variation. Moreover, phylogenetic analyses showed that the fixation index (FST) and the GammaSTgenetic distance between Karayaka subpopulations are similar to those
observed between certain Turkish sheep breeds. We conclude that there is a significant population substructure in Karayaka sheep. Since breeds do not behave as single panmictic populations, this result could probably be extrapolated to other ovine breeds. Noteworthy, population substructure can have adverse effects on the maintenance of breed diversity and it is an important confounder effect in genome-wide-association studies.
1. Introduction
Karayaka is a sheep breed from Northern Anatolia that is raised for the production of meat, milk and wool (Yilmaz et al., 2013). In general, Karayaka sheep display a white coat, although the legs and head can be black. Moreover, black and brown coated individuals can also be found (Yilmaz et al., 2013). Karayaka can be classified as a long-thin tailed breed, and males usually have spiral horns, while females are polled. The milk production of Karayaka sheep is quite low (121 kg milk in a lactation of 204 days), and this is one of the main reasons why it is not used in large-scale dairy farms, but thisflaw is compensated to some extent by heavyfleece production (Yilmaz et al., 2013).
In the 1980–2009 period, the population of ovine local breeds of Turkey steadily decreased from 48 million to 21.6 million heads, due to competition with foreign breeds, lack of government support, the pro-gressive abandonment of rural activities and market changes (Yilmaz et al., 2013). The Karayaka breed has also suffered from population decline. According to the DAD-IS database (http://dad.fao.org), the census of the Karayaka breed has decreased from 1.7 million animals in
1983 to approximately half a million in 2012. Although the accuracy of these numbers cannot be fully confirmed, they clearly indicate a di-minishing demographic trend.
Five main mitochondrial haplogroups (A–E) have been defined in sheep (Hiendleder et al., 1998; Tapio et al., 2006; Meadows et al., 2007). All of them segregate at variable frequencies in Turkish sheep, though D and E are relatively rare (Demirci et al., 2013). The genetic diversity of the Karayaka breed has been reported in several studies. Uzun et al. (2006)analyzed the autosomal diversity of several Turkish breeds with a panel of 30 microsatellites and found that fat-tailed sheep showed a significant genetic differentiation when compared to other ovine populations.Demirci et al. (2013) characterized the mitochon-drial variation of 13 Turkish native breeds and found that in Karayaka sheep, the most frequent haplogroup was B (74%), followed by A (18%), while C (6%) and E (2%) had low frequencies. These studies provided a valuable picture of the diversity of Karayaka sheep and their relationship with other ovine breeds from Turkey, but the existence of population substructure has not been investigated yet. This is an im-portant issue because the existence of population subdivision can
https://doi.org/10.1016/j.smallrumres.2018.02.007
Received 26 October 2017; Received in revised form 2 February 2018; Accepted 13 February 2018
⁎Corresponding author at: Department of Animal Genetics, Centre for Research in Agricultural Genomics (CRAG), CSIC-IRTA-UAB-UB, Campus de la Universitat Autònoma de
Barcelona, Bellaterra, 08193, Spain.
1Present address: Department of Animal Science, Faculty of Agriculture, Ahi Evran University, Kırsehir 40000, Tukrkey.
E-mail address:[email protected](M. Amills).
Available online 02 March 2018
0921-4488/ © 2018 Elsevier B.V. All rights reserved.
augment homozygosity (Garnier-Géré and Chikhi, 2013), thus in-tensifying the effects of genetic drift and inbreeding. The goal of the current work was to analyze the mitochondrial variation of Karayaka sheep from the Ladik, Çarsamba and Bafra districts with the aim of determining wether these three subpopulations are genetically differ-entiated. We also wanted to determine whether the sustained demo-graphic decline of the Karayaka and other Turkish breeds has left a detectable genetic signature in their mitochondrial gene pools. 2. Materials and methods
2.1. Total DNA isolation
Blood samples were obtained from the jugular vein under veterinary supervision and collected in 10 mL tubes containing lithium heparin. Blood extraction procedures were carried out in accordance with the ARRIVE guidelines published byKilkenny et al. (2010). At the time of sampling, identification numbers and morphological characteristics were recorded in each sheep as well as the owner’s name. To make sure that sampled animals were unrelated, genealogical records gathered by the Sheep and Goat Breeder’s Association of Samsun (Turkey) were checked . In total, blood samples from 100 sheep raised in 19 farms located in the districts of Çarşamba (8 farms), Bafra (8 farms) and Ladik (3 farms) were collected. Blood samples were transported in containers filled with dry ice to the Animal Biotechnology Laboratory at Ondukuz Mayıs University (Samsun, Turkey) and stored at −20 °C. Total DNA was isolated with the IDPURE Spin Column Genomic DNA MiniPrep Kit (Empire Genomics, Buffalo, NY) by following the instructions of the manufacturer.
2.2. Amplification and sequencing of the D-loop region
Two primers were designed to amplify a fragment of 575 bp (posi-tions 221–795 of GenBank sequence AM279285.1) of the mitochondrial D-loop region: FW 5′-GCC CAC ATA ACA ACC CAT AC-‘3 and REV 5′-CGG AGC GAG AAG AGG GAT-3′. Polymerase chain reactions were performed in afinal volume of 15 μL containing 1.5 μL of 10× PCR buffer, 1.5 μL of MgCl2(25 mM), 0.45μL of each primer (final
concentration = 0.3μM), 0.15μL of each dNTP (final concentration = 0.25 mM), 0.75 U of AmpliTaq DNA polymerase (Applied Biosystem, Foster City, CA) and 60–100 ng of genomic DNA. Ultrapure water was added to the reaction until reaching afinal volume of 15μL. This reaction mixture was heated to 95 °C for 10 min, followed by 35 cycles of 95 °C for 1 min, 64 °C for 1 min and 72 °C for 1 min. Subsequently, afinal extension step at 72 °C for 7 min was carried out. Amplification products were purified with the ExoSAP-IT PCR Cleanup kit (Affymetrix, Santa Clara, CA). Sequencing reactions were prepared with the Big Dye Terminator Cycle Sequencing Kit v1.1 (Applied Biosystems, Foster City, CA) and electrophoresed in an ABI 3730 DNA Analyzer (Applied Biosystems, Foster City, CA). High-quality sequences from 69 Karayaka individuals were obtained (GenBank accession numbers: MG209399-MG209467).
2.3. Data analyses
Mitochondrial D-loop sequences were aligned with the Multalin software (Corpet, 1988) and trimmed to afinal size of 511 bp. The number of haplotypes and nucleotide and haplotype diversities were calculated with DnaSP v5.1 software (Librado and Rozas, 2009). The FSTcoefficients among breeds and the tests of neutrality; i.e., Fu and Li
D* and F* (Fu and Li, 1993) and Tajima’s D (Tajima, 1989) were also carried out with DnaSP v5.1 (Librado and Rozas, 2009). A phylogenetic neighbor-joining tree depicting the genetic relationships among Kar-ayaka sheep sampled at the Çarsamba, Ladik and Bafra districts was built with the MEGA 5 software (Tamura et al., 2011) under a Tamura-Nei model (Tamura and Nei, 1993) and 1000 bootstrap replicates.
GammaST and FST distances among three Karayaka subpopulations
(Bafra, Çarsamba and Ladik) and 12 Turkish breeds (Akkaraman, Çi-neçaparı, Morkaraman, Gökçeada, Sakız, İvesi, Dağlıç, Herik, Hemşin, Karagül, Norduz and Kıvırcık) were estimated using DnaSP v5.1 soft-ware (Librado and Rozas, 2009) and 142 mitochondrial sequences re-trieved from GenBank (Supplementary Table 1) plus 36 new sequences selected at random (Bafra = 13, Çarsamba = 11, Ladik = 12) from the data set generated in the current work. Subsequently, two neighbor-joining trees (GammaSTand FST trees) were built with the MEGA 5
software (Tamura et al., 2011) by considering a 462 bp fragment shared by all sequences. An analysis of molecular variance (AMOVA) based on mitochondrial sequences from three Karayaka subpopulations was carried out with the Arlequin 3.5 software by considering the default parameters (Excoffier and Lischer, 2010).
3. Results and discussion
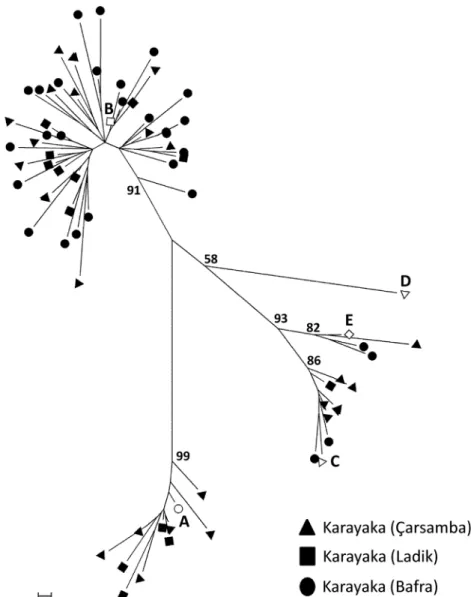
The genetic diversity of the Karayaka sheep and their genetic re-lationship with other ovine breeds have been reported and discussed in previous publications (Uzun et al., 2006;Yilmaz et al., 2014;Das et al., 2015). Herewith, we analyzed the mitochondrial variation of Karayaka sheep from the districts of Çarsamba, Ladik and Bafra with the aim of investigating the existence of population substructure. The data pre-sented inFig. 1andTable 1demonstrate that the B haplogroup is the most abundant, followed by A, but haplogroup frequencies were quite different among the subpopulations. Moreover, the neighbor-joining tree based on GammaSTand FSTdistances showed that genetic distances
among these three subpopulations have magnitudes similar to those observed between distinct Turkish breeds (Fig. 2). We have also per-formed several tests of neutrality in order to assess whether the popu-lation reduction suffered by Karayaka sheep in the last 30 years has left a detectable genetic signature at the mitochondrial level. The Fu and Li’s D* and F* test statistics (D* = −1.29, F* = −1.28) and Tajima’s D (D =−0.74) were all non-significant at the whole population scale, and we also observed a lack of significance when we calculated these statistics for each subpopulation (data not shown). These results in-dicated that Karayaka sheep have not suffered a strong genetic bottle-neck but a progressive and sustained population decline.
To assess more robustly the existence of population substructure in the Karayaka sheep, an analysis of molecular variance (AMOVA) was carried out (Table 2. Our data showed that the between-populations component of variation was small (5.14%) but significant (P-value = 0.019). Based on these results, we can conclude that there is a certain level of population substructure in the Karayaka sheep. In a genome-wide analysis of Sicilian sheep breeds, Mastrangelo et al. (2014)also detected the existence of population substructure in the Comisana breed, probably due to a differential introgression with for-eign breeds and/or to geographic isolation. Population substructure was also detected when analyzing the diversity of the Portuguese cattle breed“Brava de Lide” (Mateus and Russo-Almeida, 2014). From a re-productive point of view, breeds do not behave as single panmictic populations. In contrast, there is a certain level of reproductive isola-tion among farms and regions due to the lack of naisola-tional breeding programs facilitating the widespread diffusion of the genetic progress by artificial insemination and embryo transfer. The differential ad-mixture of Karayaka subpopulations with highly improved exotic breeds, adaptation to specific environmental or breeding conditions, sampling constraints and the existence of geographic barriers might also explain the weak but significant genetic differentiation that we observed among the Çarsamba, Ladik and Bafra subpopulations.
The existence of population subdivision can have important con-sequences on the maintenance of genetic diversity by preventing random mating and decreasing heterozygosity; i.e., the so-called Wahlund effect (Garnier-Géré and Chikhi, 2013). From a practical point of view, population stratification can be an important confounder in genetic association analyses (Salmela et al., 2011). While haplotype
diversities among the three Karayaka subpopulations were quite si-milar, we noted important differences in nucleotide diversity magni-tudes (Table 1). This discrepancy between these two diversity metrics is because they measure different things: while haplotype diversity is the probability that two randomly chosen haplotypes are different (Nei, 1987), nucleotide diversity measures the average number of nucleotide differences per site between two randomly chosen DNA sequences (Nei and Li, 1979). The high nucleotide diversity of the Çarsamba sub-population is due to the segregation of four haplogroups, with three of them displaying frequencies > 0.20. In contrast, in the Bafra sub-population, there were only three haplogroups, and one of them (B haplogroup) had a very high frequency. These differences among Kar-ayaka subpopulations could be due to either a sampling effect or to true
genetic differences attributable to drift, differential admixture and other factors.
4. Conclusions
According to our results, the Karayaka breed cannot be categorized as a genetically homogeneous population. In contrast, we provide evi-dence that there is a certain level of population substructure. The va-lidity of this result should be confirmed with autosomal markers with a genome-wide distribution in order to provide a muchfiner assessment of the amount of genetic differentiation at the within-breed level in Karayaka sheep.
Fig. 1. Neighbor-joining tree depicting the genetic relationships among mitochondrial sequences from Karayaka sheep sampled at the Çarsamba, Ladik and Bafra districts (black-colored figures). Sequences representing the A, B, C, D and E ovine mitochondrial haplogroups were also included in the tree (white-colored figures).
Table 1
Haplogroup frequencies and genetic diversity parameters in Karayaka sheep.
Subpopulation Haplogroup frequencies Number of haplotypes Haplotype diversity Nucleotide diversity
A B C D E
Çarsamba (N = 27) 0.22 0.52 0.22 0.00 0.04 24 0.991 ± 0.013 0.044 ± 0.003
Ladik (N = 13) 0.31 0.62 0.07 0.00 0.00 13 1.000 ± 0.013 0.039 ± 0.006
Bafra (N = 29) 0.00 0.86 0.07 0.00 0.07 28 0.998 ± 0.010 0.028 ± 0.003
Conflict of interest
The authors declare that they have no conflicts of interest. Acknowledgments
This research was partially funded by a grant (RZ2011-00015-C03-01) from the Instituto Nacional de Investigación y Tecnología Agraria y Alimentaria (Spain). We also acknowledge the support of the Spanish Ministry of Economy and Competitiveness for the Center of Excellence Severo Ochoa 22016-20192 (SEV-2015-0533) grant awarded to the Centre for Research in Agricultural Genomics.Thanks also to the CERCA Programme of the Generalitat de Catalunya.
Appendix A. Supplementary data
Supplementary data associated with this article can be found, in the online version, athttps://doi.org/10.1016/j.smallrumres.2018.02.007. References
Corpet, F., 1988. Multiple sequence alignment with hierarchical clustering. Nucl. Acids Res. 16, 10881–10890.
Das, H., Turan, I., Demir, S., 2015. Genetic characterization of the Akkaraman, Morkaraman and Karayaka sheep through microsatellite variation. Indian J. Anim. Res. 49, 173–179.
Demirci, S., Koban Baştanlar, E., Dağtaş, N.D., Pişkin, E., Engin, A., Ozer, F., Yüncü, E., Doğan, S.A., Togan, I., 2013. Mitochondrial DNA diversity of modern, ancient and wild sheep (Ovis gmelinii anatolica) from Turkey: new insights on the evolutionary history of sheep. PLoS One 8, e81952.
Excoffier, L., Lischer, H.E., 2010. Arlequin suite ver. 3. 5: a new series of programs to perform population genetics analyses under Linux and Windows. Mol. Ecol. Resour. 10, 564–567.
Fu, Y.X., Li, W.H., 1993. Statistical tests of neutrality of mutations. Genetics 133, 693–709.
Garnier-Géré, P., Chikhi, L., 2013. Population subdivision, Hardy–Weinberg equilibrium and the Wahlund effect. eLS. John Wiley & Sons Ltd, Chichester, pp. a0005446. http://dx.doi.org/10.1002/9780470015902.a0005446.pub3. http://www.els.net. Hiendleder, S., Mainz, K., Plante, Y., Lewalski, H., 1998. Analysis of mitochondrial DNA
indicates that domestic sheep are derived from two different ancestral maternal sources: no evidence for contributions from urial and argali sheep. J. Hered. 89, 113–120.
Kilkenny, C., Browne, W.J., Cuthill, I.C., Emerson, M., Altman, D.G., 2010. Improving Fig. 2. Neighbor-joining tree of Turkish sheep populations based on FSTand GammaSTdistances estimated from mitochondrial data. The following populations were included in the
phylogenetic trees: Karayaka Bafra (N = 13), Karayaka Çarsamba (N = 11), Karayaka Ladik (N = 12), Akkaraman (AKK, N = 12), Çineçaparı (CIC, N = 12), Morkaraman (MRK, N = 11), Gökçeada (GOK, N = 11), Sakız (SAK, N = 10), İvesi (IVE, N = 12), Dağlıç (DAG, N = 11), Herik (HER, N = 12), Hemşin (HEM, N = 14), Karagül (KRG, N = 12), Norduz (NOR, N = 10) and Kıvırcık (KIV, N = 9).
Table 2
Analysis of molecular variance (AMOVA) of three Karayaka subpopulations (Çarsamba, Ladik and Bafra).
Source of variation d.f. Sum of squares Variance components Percentage of variation Among populations 2 43.116 0.53427 Va 5.14% Within populations 66 650.652 9.85836 Vb 94.86% Total 68 693.768 Fixation Index FST= 0.05141
bioscience research reporting: the ARRIVE guidelines for reporting animal research. PLoS Biol. 8, e1000412.
Librado, P., Rozas, J., 2009. DnaSP v5: a software for comprehensive analysis of DNA polymorphism data. Bioinformatics 25, 1451–1452.
Mastrangelo, S., Di Gerlando, R., Tolone, M., Tortorici, L., Sardina, M.T., Portolano, B., International Sheep Genomics Consortium, 2014. Genome wide linkage dis-equilibrium and genetic structure in Sicilian dairy sheep breeds. BMC Genet. 15, 108. Mateus, J.C., Russo-Almeida, P.A., 2014. Exploring the genetic diversity and substructure of the Portuguese cattle breed“Brava de Lide” using microsatellites. Anim. Genet. Resour. 55, 9–17.
Meadows, J.R., Cemal, I., Karaca, O., Gootwine, E., Kijas, J.W., 2007. Five ovine mi-tochondrial lineages identified from sheep breeds of the Near East. Genetics 175, 1371–1379.
Nei, M., Li, W.H., 1979. Mathematical model for studying genetic variation in terms of restriction endonucleases. Proc. Natl. Acad. Sci. U. S. A. 76, 5269–5273. Nei, M., 1987. Molecular Evolutionary Genetics. Columbia University Press, New York. Salmela, E., Lappalainen, T., Liu, J., Sistonen, P., Andersen, P.M., Schreiber, S.,
Savontaus, M.L., Czene, K., Lahermo, P., Hall, P., Kere, J., 2011. Swedish population substructure revealed by genome-wide single nucleotide polymorphism data. PLoS
One 6, e16747.
Tajima, F., 1989. Statistical method for testing the neutral mutation hypothesis by DNA polymorphism. Genetics 123, 585–595.
Tamura, K., Nei, M., 1993. Estimation of the number of nucleotide substitutions in the control region of mitochondrial DNA in humans and chimpanzees. Mol. Biol. Evol. 10, 512–526.
Tamura, K., Peterson, D., Peterson, N., Stecher, G., Nei, M., Kumar, S., 2011. MEGA5: molecular evolutionary genetics analysis using maximum likelihood, evolutionary distance, and maximum parsimony methods. Mol. Biol. Evol. 28, 2731–2739. Tapio, M., Marzanov, N., Ozerov, M., Cinkulov, M., Gonzarenko, G., Kiselyova, T.,
Murawski, M., Viinalass, H., Kantanen, J., 2006. Sheep mitochondrial DNA variation in European, Caucasian, and Central Asian areas. Mol. Biol. Evol. 23, 1776–1783. Uzun, M., Gutiérrez-Gil, B., Arranz, J.J., San Primitivo, F., Saatci, M., Kaya, M., Bayón, Y.,
2006. Genetic relationships among Turkish sheep. Genet. Sel. Evol. 38, 513–524. Yilmaz, O., Cengiz, F., Ertugrul, M., Trevor Wilson, R., 2013. The domestic livestock
resources of Turkey: sheep breeds and cross-breeds and their conservation status. Anim. Genet. Resour. 52, 147–163.
Yilmaz, O., Cemal, I., Karaca, O., 2014. Genetic diversity in nine native Turkish sheep breeds based on microsatellite analysis. Anim. Genet. 45, 604–608.