İSTANBUL BİLGİ UNIVERSITY
INSTITUTE OF SOCIAL SCIENCES
MARKETING MASTERS DEGREE PROGRAM
“THE EFFECT OF SERVICE INNOVATION ON
CUSTOMER SATISFACTION”
Timur Seta
117689002
Prof. Dr. Selime Sezgin
İstanbul
2019.
iii
ACKNOWLEDGMENTS
I would like to express my deepest gratitude to my advisor Prof. Dr. Selime Sezgin for giving me support and encouragement, useful critics of this work and for her guidance in maintaining my progress on schedule.
I would also like to extend my appreciation to Prof. Dr. Beril Durmis for the guidance and support as well as for the help in analyzing the data and for the final review of the thesis.
Finally, I would like to thank my family for the endless support and love that kept me pushing myself to my best.
iv
ABSTRACT
Service Innovation is a topic that has become relatively popular in recent years because of its importance and the effects it has on the businesses. The purpose of this study is to identify and understand the effect Service Innovation has on the Customer satisfaction through constructs like service quality and perceived brand value. The study used quantitative research method in order to collect data from the convenience sample. The data was collected from two different countries, thus cultural values and differences have been compared. The results from the study suggest that service innovation has a positive and direct effect on the Service Quality and Perceived Brand Value as well as its direct relationship with Customer Satisfaction. Another factor revealed is the culture and the study emphasizes its importance and effect on the final results of the research.
The research aims to recognize the importance of service innovation and its relation to customer satisfaction, and finally to contribute to the marketing literature.
Key words: Service Innovation, Perceived Brand Value, Customer Satisfaction, Cultural Dimension, Service Quality
v
ÖZET
İnovatif (yenilikçi,yaratıcı) hizmet teması sektöre olan etkisi ile önemi daha da artmış ve son zamanlarda oldukça popüleşmektedir. Bu araştırmanın tezinin amacı servis sektöründeki inovatif gelişmelerin müşteri memnuniyeti üzerindeki etkisini verilen servis kalitesi ve müşteri tarafından algılanan marka değeri analiz edilerek anlamak ve tanımlamaktır. Araştırmada elverişli örneklerden uygun veriyi toplamak için nicel araştırma yöntemi kullanılmıştır. Veriler iki farklı ülkeden toplanarak farklı değer ve kültürleri karşılaştırmak mümkün olmuştur. Araştırma sonucunda servis sektöründeki inovasyonların servis kalitesine, algılanan marka değerine ve kullanıcı memnuniyetine direk olarak etkisi olduğu görülmüştür. Araştırma sonuçları bize ayrıca kültürün, insanların ürün seçiminde büyük bir etkisi olduğunu göstermiştir.
Bu araştırma tezinin hedefi servis hizmetlerinde inovasyonun önemini ve müşteri memnuniyetine olan etkisini anlatmak ve son olarak pazarlama literatürüne katkıda bulunmaktır.
Anahtar Kelimeler: Hizmet Yeniliği, Algılanan Marka Değeri, Müşteri memnuniyeti, Kültürel boyutlar, Servis Kalitesi.
vi Table of Contents
ACKNOWLEDGMENTS ... ii
ABSTRACT ...iv
ÖZET ... v
Table of Contents ...vi
1. INTRODUCTION ... 1 1.1. Research Background ... 1 1.2. Research Problem ... 2 1.3. Research Purpose... 3 1.4. Study Outline ... 3 2. LITERATURE REVIEW ... 5 2.1. Customer Satisfaction ... 5
2.1.1. Factors Influencing Customer Satisfaction ... 7
2.2. Service ... 7
2.2.1. Service Quality ... 8
2.2.2. Service Quality and Customer Satisfaction ... 9
2.3. Perceived Brand Value ... 10
2.3.1. Perceived Brand Value and Customer Satisfaction ... 11
2.4. Service Innovation... 12
2.4.1. Definition of Service Innovation ... 12
2.4.2. Service Innovation and Service Quality... 14
2.4.3. Relationship between Service Innovation and Customer satisfaction ... 15
3. METHODOLOGY ... 16
3.1. Research design ... 16
3.2. Sample selection ... 17
3.3. Data collection ... 17
3.4. Questionnaire design ... 17
3.5. The development of the theoretical framework for the research ... 18
3.6. Research constructs ... 20
vii
3.6.2. Service quality construct ... 21
3.6.3. Perceived brand value construct ... 23
3.6.4. Customer satisfaction construct ... 25
4. DATA ANALYSIS AND DISCUSSION ... 26
4.1. Descriptive statistics ... 26
4.1.1. Gender ... 26
4.1.2. Age ... 27
4.1.3. Country of residence ... 27
4.1.4. Marital Status ... 28
4.1.5. Educational level of the sample ... 29
4.1.6. Occupation ... 30
4.2. Cultural values and differences... 31
4.2.1. Turkey’s Hofstede dimension values ... 33
4.2.2. Bosnia and Herzegovina’s Hofstede dimension values ... 33
4.2.3. Comparison of five-dimensions of Turkey and Bosnia and Herzegovina . 34 4.3. Analysis of the results ... 37
4.3.1. Reliability analysis for service innovation ... 37
4.3.2. Reliability analysis of service quality ... 37
4.3.3. Reliability analysis of perceived brand value ... 40
4.3.4. Reliability analysis of customer satisfaction ... 41
4.3.4. Regression analysis of Service Innovation and Service Quality ... 42
4.3.5. Regression analysis of Service Innovation and Perceived Brand Value .... 43
4.3.6. Regression analysis of Service Innovation and Customer Satisfaction ... 44
4.3.7. Regression analysis of Customer Satisfaction and Service Quality ... 45
4.3.8. Regression analysis of Perceived Brand Value and Customer Satisfaction 46 4.4. Independent sample t-test analysis for country of residence ... 47
4.4.1. Independent sample t-test for country of residence and service innovation ... 47
4.4.2. Independent sample t-test analysis for country of residence and service quality 48 ... 51
viii
4.4.3. Independent sample t-test analysis for country of residence and
perceived brand value ... 51
... 53
4.4.4. Independent sample t-test analysis for country of residence and satisfaction ... 53 5. CONCLUSION ... 54 6. MANAGERIAL IMPLICATIONS ... 56 7. FUTURE RESEARCH ... 58 Reference ... 59 8. Appendix ... 66 8.1. Factor items ... 66
8.1.1. Service Innovation factor items ... 66
8.1.2. Service Quality factor items ... 66
8.1.3. Perceived Brand Value factor items ... 68
8.1.4. Customer Satisfaction factor items ... 69
8.2. Questionnaire ... 70
8.2.1. Questionnaire - English ... 70
8.2.2. Questionnaire Turkish ... 77
ix List of Tables
Table 1- Service innovation construct... 20
Table 2-Service Quality construct ... 21
Table 3- Perceived Brand Value construct ... 24
Table 4-Customer Satisfaction construct ... 25
Table 5-Gender ... 26
Table 6-Country of residence ... 28
Table 7-Marital Status ... 28
Table 8-Level of education ... 29
Table 9-Occupation ... 30
Table 10- Reliability analysis for service innovation ... 37
Table 11-Reliability analysis of service quality ... 38
Table 12- Reliability analysis of perceived brand value ... 40
Table 13- Reliability analysis of customer satisfaction ... 41
Table 14- Regression analysis of Service Innovation and Service Quality ... 43
Table 15-Regression analysis of Service Innovation and Perceived Brand Value ... 44
Table 16- Regression analysis of Service Innovation and Customer Satisfaction ... 45
Table 17-Regression analysis of Customer Satisfaction and Service Quality ... 45
Table 18- Regression analysis of Perceived Brand Value and Customer Satisfaction ... 46
Table 19-Independent Sample t-test for Country of Residence and Service Innovation . 47 Table 20-Independent Sample t-test for Country of Residence and Tangibles ... 49
Table 21-Independent Sample t-test for Country of Residence and Reliability ... 49
Table 22-Independent Sample t-test for Country of Residence and Responsiveness ... 50
Table 23-Independent Sample t-test for Country of Residence and Assurance ... 50
Table 24-Independent Sample t-test for Country of Residence and Empathy ... 51
Table 25-Independent Sample t-test for Country of Residence and Perceived Functional Value ... 51
Table 26-Independent Sample t-test for Country of Residence and Perceived Price Value ... 52
Table 27-Independent Sample t-test for Country of Residence and Perceived Emotional Value ... 52
Table 28-Independent Sample t-test for Country of Residence and Perceived Social Value ... 53
Table 29-Independent Sample t-test for Country of Residence and Customer Satisfaction ... 53
Table 30- Service innovation factor item names ... 66
Table 31 - Service Quality factor items ... 66
Table 32 - Perceived Brand Value factor items ... 68
x List of figures
Figure 1 – Research Outline ... 4
Figure 2- Model for the theoretical framework ... 19
Figure 3-Turkey's cultural dimensions ... 33
Figure 4-Bosnia and Herzegovina cultural dimensions ... 34
1
1. INTRODUCTION
This chapter will present the reader with the research background, research problem, research purpose and finally with the study outline.
1.1. Research Background
Before the industrial revolution took place, people have not been very familiar with the service concept. They have just learned that innovation can mean good if it is related to production of goods... Not until late 19th century did the researchers start to do thorough researches about service innovation. Schumpeter (1983) set leading steps for the definition of the “service innovation” with his theories. Later, other authors have recognized his theories and created the “Schumpeterian view of service innovation” (Snyder et al., 2016). Service innovation alone did not mean anything. There had to be created connections between it and service quality and service satisfaction. It is now known that service innovation plays a key role in driving service quality (O'Cass et al., 2015; Berry et al., 2006; Cheng et al., 2012).
Thakur & Hale (2013) stated that for a business provider to stay competitive in the modern environment, it must regularly renew their offerings as well as the processes. Snyder et al., (2016) defined Service innovation as: “the engine of economic growth”. Furthermore, different categories or approaches have been identified in service innovation. Coombs and Miles (2000) classified them as technological, non-technological and synthesis category of approach. Later in the thesis there will be an additional one. Even though it is difficult create a direct link between Service Innovation and Customer satisfaction Hinson et al. (2017) mentioned that innovation boosts the opportunity of a business to produce an offer that can fit the customer needs and therefore make an opportunity for the customer to be satisfied by the businesses offer. Kotler
2
(1991), described satisfaction as the assessment after purchasing the offer that is based on the expectation that the customer had before the purchase.
Finally, Service quality as one of the most important factors that influence the customer satisfaction also has a relationship with service innovation. The simplest definition of the relationship between service quality and the service innovation is that service innovation is a factor that stimulates service quality (O'Cass, 2015).
1.2. Research Problem
Innovation as a topic itself is very interesting and there has been a lot of studies about it. Same is for the service innovation. We have learned that Service Innovation is driver of Service Quality and that there is a link between the innovation and customer satisfaction that is backed up with theoretical knowledge, but there is no specific research to my knowledge about the direct relationship between Service Innovation and Customer satisfaction. Customer satisfaction is very specific since it is defined as the cognitive nature, that is the emotional state and consumption experience (Oliver, 1981). Innovation on the other hand, is something concrete, something new that has not been introduced to that customer.
The problem stands at the point where that something new meets the customer and triggers its emotions. As we know, everybody has different feelings and when provoked by a new thing they might show different feelings. This research will analyze the relationship between the service innovation and customer satisfaction, more specifically the effect that innovation has on satisfaction.
Another question that the study will look at is the role of service quality in this relationship. Finally, since the study has been made in Bosnia and Herzegovina
3
and Turkey simultaneously, there is a problem of cultural differences which will be analyzed later in the study.
1.3. Research Purpose
The Primary goal of this research is to question the relationship between service innovation and customer satisfaction. Service innovation will be playing the role of the moderating variable and will be testing the relation to the factors as perceived brand value, service quality and satisfaction.
After defying all of the terms that are related to this research, such as, service, service innovation, service quality, customer satisfaction and perceived brand value, and backing them up with academic literature, this thesis will be able to demonstrate and possibly predict the effect of service innovation. This is important for businesses because their main goal is to increase competitive advantage while being able to meet or even surpass the customer expectation and keep them happy. Finally, another objective of the research was to recognize the importance of the cultural dimensions and values carving the behavior of consumers.
1.4. Study Outline
This study consists of seven chapters that are presented below (Figure 1.1).
The first chapter includes the Introduction, Research Background, Problem, Purpose and finally the outline of the thesis.
The next part consists of the Literature Review where a thorough review of the past academic researches has been summarized and presented. It includes Customer Satisfaction (CS) and the factors that influence it, Service together with the service quality and its relation to CS, Perceived Brand value with its
4
relation to CS and lastly the literature about Service Innovation and its relation to Service Quality and CS.
The third chapter is the methodology part containing the design of the research, population, sample selection, the data collection part, design of the questionnaire, the theoretical framework and the research constructs and dimensions.
Afterwards, Data Analysis and further discussion is presented in chapter four.
Chapter five is the conclusion, and finally chapter six and seven are Managerial Implications and Future Research.
Figure 1 – Research Outline
5
2. LITERATURE REVIEW
The purpose of this section is to demonstrate a review of relevant literature in order to support the research with the academic framework. The review will include subjects matters such as Customer Satisfaction and the factors that influence it, then service, service quality and the relationship between service quality and earlier reviewed customer satisfaction. Furthermore, Perceived Brand Value will be analyzed together with its relation to customer satisfaction. Last but not least, an analysis of Service Innovation will be made. This will include the definition of service innovation, its relation to service quality and finally to Customer behavior. The review is built on works from different academicians published from 1980 to 2017.
2.1. Customer Satisfaction
There have been many papers about Customer Satisfaction. The importance of the definition of Customer Satisfaction has been discussed by many academicians and researchers as it presents as an imperative aspect for the firms’ market accomplishments and firms’ continuity, as well as it having a positive reaction on the firms’ profitability (Novikova, 2009; Angelova and Zekiri, 2011; Jashireh et al. 2016).
When defining Customer Satisfaction, Oliver (1981) defined it stated it as the cognitive nature triggered by the connection of consumers feelings related to the consumption experience and the emotional expectations the consumer had. In a simpler form, it is the result experienced by someone whose expectations have been pleased by the firms work. It is argued that consumer satisfaction plays a big role on the organizations effectiveness through its linear relationship with royalty and retention. Another important aspect is the service quality,
6
which when delivered should meet or outrun the expectations, thus the prior customers expectation play the biggest factor (Angelova and Zekiri 2011).
Oliver (1997), on the other hand argued that loyalty points out to a thoroughly obtained obligation to repeat the purchase of the favored good or service in the future even though there is a possibility for external factors to originate a changing conduct. Accordingly, firms try their best to reach or surpass consumers expectations in order to stimulate the loyalty and increase the commitment to their product or service (Martin, O’Neill, Hubbard & Palmer 2008).
Consumers have a tendency to re-buy an earlier purchased service or product if they feel satisfied with it. This will later lead to a positive word of mouth to the other customers. Vice versa, if they are not satisfied with the used service or product, they might tend to disregard the product or service, or even give negative word of mouth to other potential customers (Kotler, 2000; Angelova and Zekiri 2011).
From the services perspective, satisfaction can be explained as cognitive consumer action evolved from the relationship between the service provider and the consumer. Moreover, this theory can be split into two specific views (Casalo et al., 2008). The first view, focused on the economic actions like profit margins or sales quantity, recognizes consumer satisfaction as a cognitive willingness. The other view, focusing on the non-monetary actions, recognizes the theory applying emotional aspects like ability to create a relationship with a partner in an easy way (Bhattacherjee, 2001).
To be able to accomplish customer satisfaction, their needs and wants have to be pleased by the businesses (La Berbera and Mazursky, 1983). Kotler (2000) defines those needs as the customers privacy, and wants as the shape created by those needs while formed by the person’s character and culture.
7
2.1.1. Factors Influencing Customer Satisfaction
A number of factors that alter the customer satisfaction could be listed. Hokanson (1995) argues that these factors are: Employee friendliness, helpfulness, knowledge and courtesy; Accurate and well-timed invoices; Agile service; quality of the service; fair value; and fair price. Differently the factors can be directly linked to the customer itself, such as the individual’s relation with the surrounding, the needs of the individual which change according to the personal tastes, culture, sex, etc... Another factor is the earlier experience which can be thought of as wisdom, and finally the outside communication which is the word of mouth or business advertising (Zeithaml et al., 1990; Atiyah 2017). There have been studies that proved an existence of a direct relationship between service quality approaches and the consumer actions (Zeithaml et al., 1996).
2.2. Service
Service has been defined as a “process consisting of a series of more or less intangible activities that normally, but not necessarily always, take place in interactions between the customer and service employee and/or physical resources or goods and/or systems of the service provider” (Gronroos, 2007). Gronroos (2007) implied services are the result of problem solution for the customer, although they might not be strictly a solution, rather they may be result of customers’ need or demand.
Kotler et al. (2009) defined them as “any act or performance one party can offer to another”, being “essentially intangible”. Being nonphysical, services cannot result in ownership (Kotler et al. 2009). Judd (1964) described services as transactions “where the object of the market transaction is other than the transfer of ownership (and title, if any) of a tangible commodity”. These transactions
8
include exchange of intangible goods like selling insurance, leasing (Kayastha, 2011).
Although they are intangible, services provide full value for the customer (Angelova and Zekiri, 2011). In the past few years, service industries revenue is growing up as the individuals tend to spend more money on experience than on physical goods (Deloitte Center 2017) and this proves the importance of the sector.
2.2.1. Service Quality
Quality of the service was described as a measurement of the delivered, performed service given by the customers’ observation of it and is an opinion resulting from both service expectation and objectivity of its performance (Parasuraman et al., 1988). The theoretical background suggests that if the customers are to evaluate low quality, if the expected performance is not met, and vice versa, if it is met then the quality would increase (Jashireh et al., 2016; Oliver, 1980).
Parasuraman et al. (1988) explained service quality as a general understanding related to the mindset of the service. Moreover, they defined it as an organizational skill needed to meet or overcome the consumer expectations. Zeithaml et al., (1990) defined it as the distinction between recognized service and the expected service. Accordingly, if the level of the expected service is bigger than the actual level of the service, then the expected quality is not adequate enough and there would be customer dissatisfaction (Ramseook-Munhurrun et al., 2010; Parasuraman et al., 1985; Lewis and Mitchell, 1990)
Different models of measuring service quality have been developed over the time. When measuring a firm’s service level, the most appropriate and objective tool is the quality perception of the acquired service by the consumer
9
(Parasuraman et al. 1988), and to measure the customers perceived quality SERVQUAL scale is used.
SERVQUAL is established on five dimensions of the service containing Tangibles, Reliability, Responsiveness, Assurance and Empathy. Tangibles meaning the physical equipment, facilities and display of the personnel, Reliability meaning the capacity to carry out the offered service faithfully and correctly, Responsiveness meaning punctual service and eagerness to help the customers, Assurance meaning being able to build trust and courage to the customers, and Empathy which is the ability to serve every customer individually (Parasurman et al., 1988). The authors explain each of the dimensions in detail in their work.
Even with its wide range of use, there are some critics of the SERVQUAL, and a large number of researches do not approve the five-dimensional form of SERVQUAL (Parasurman et al., 1988). Alternatively, Cronin and Taylor (1992) developed another tool for measuring service quality, the SERVPERF scale based on performance. It contains twenty-two perception elements, and the authors believe that it carries out the measure of quality better than any other model (Ramseook-Munhurrun et al., 2010; Corin et al., 1992). Yet, even with other better performing models, Parasuraman et al. (1991) argues that SERVQUAL can be used in extensive range of services.
2.2.2. Service Quality and Customer Satisfaction
A crucial responsibility for the businesses in their struggle to increase the level of their offering’s quality, while keeping the customer loyalty in a competitive environment, is customer satisfaction (Awwad, 2012). Even though Service Quality and Customer Satisfaction are connected closely, they do not necessarily have to have the same concept. Zeithaml and Bitner (1996) have defined service quality as the antecedent of the satisfaction. Parasuraman et al.
10
1988 argued that service quality comes in a shape of attitude which might be, but is not necessarily connected to satisfaction. Al Khattab and Aldehayyat (2011) identified the significance of the service quality along with the direct effect it has on the customer satisfaction.
Finally, a specific explanation about service quality and customer satisfaction where both of them are defined and the link between them is explained cannot be found. We have to look at them as independent things that have shared points. However, a number of researchers show in their work that service quality is the matter that propels customer satisfaction (Dabholkar, 1995).
2.3. Perceived Brand Value
One of the first significant definition of perceived brand value was given by Zeithaml (1988) and he says it as a “consumer’s overall assessment of the utility of a product based on perceptions of what is received and what is given”. Following him, Nilson (1992) described value as “expression of the product benefits”, while Oliver (1999) states along with the benefit positive side, value is “a negative function of what is sacrificed”.
Moreover, we can see the value as the perception of customers’ experience, situated between the gain and sacrifice (Halbrook 1999). It is important to emphasize that perceived value is individual and differs from customer to customer (Martin et al. 2004, p.54, Icazuriaga 2016). “Customer mind” is the master of assessment, thus perceived value can be thought of as subjective rather than objective matter (Martin et al. 2004). Angelova and Zekiri (2011) define perceived value as an important guideline for the managers, even given its subjective form. This guideline can improve their overall results and satisfaction of customers’ needs.
11
PERVAL is name of the scale used to measure perceived brand value and consists of four sub-dimensions which include price, quality, social and emotional value (Sweeney and Soutar 2001). Gronroos in 1997, separated perceived value into emotional, feelings about the service/product, and functional, rational thinking and evaluation on the performed service. Although PERVAL is the official scale for measurement of perceived brand value, some researchers argue it does not include overall perception, it is rather composed of after-purchase value evaluation (Icazuriaga 2016).
2.3.1. Perceived Brand Value and Customer Satisfaction
Close relationship between perceived brand value and customer satisfaction lie in the definition given by Demirgunes (2015). She claims that satisfaction of the customers’ is the outcome of the perceived value, meaning if the expectations are met with the perception, satisfaction of that customer will occur.
Cost is another factor closely related to both variables, perceived brand value and customer satisfaction, as it can affect positively or negatively on the assessment (Demirgunes 2015). It is well known that cost needs to be overthrown by the benefits and expectation needs to be met (Icazuriaga 2016). If the customer gives less money for the experience which exceeds his expectations, brand value and satisfaction of the customer will grow (Icazuriaga 2016). Similarly, the post purchase satisfaction of the customer relies upon the level of perceived value of the same customer (Lin 2003; Demirgunes 2015)
12 2.4. Service Innovation
2.4.1. Definition of Service Innovation
The importance of Innovation has been explained by many authors, and is still being researched to a large degree. One of the most important scholars for the “service innovation” theories, Schumpeter (1983), defined innovation as the utilization of something new. This can be anything from a product, means of producing that product, a new service or a market, new supply source, to a completely new business model (Schumpeter, 1983). On the other hand, it is widely recognized as a fundamental factor for economic development because it is likely for it to increase competitiveness and productivity of the business (Suroso et al., 2015). In other words, innovation is the driver for the economic growth (Snyder et al., 2016).
Schumpeter (1934) made a clear differentiation between innovation and invention. He puts importance on innovation and discusses that there is no fundamental value in inventions. Rather, he argues that innovation is an independent action through which inventions are executed to the market in order to gain economic advantage for them. Schumpeter discusses that the development of the new product or service to offer has to be separated from the result. Finally, Schumpeter defines it as the accomplishment of the new mixtures. As an outcome of his work, researches established the “Schumpeterian view of Service Innovation” (Snyder et al., 2016). Schumpeter’s distinction between an invention and innovation can be backed up with the clarification from Freeman (1982) where he stated that: “an invention is an idea, a sketch or model for a new or improved device, product, process or system” but “an innovation in the economic sense is accomplished only with the first commercial transaction involving the new product, process, system or device..”
13
Various forms of innovation were suggested and discussed by Schumpeter (1934). These included launch of a brand new offering, a new way of production, and the finding of a new origin of raw materials, businesses or markets. Taking into consideration the interests of the organizations and the significance of the service sector, Sundbo and Gallouj (2008) suggested 4 types of innovations relating to service. These are Service, Price, Organizational and Market Innovation. It is not obligatory for a service company only to work with a single type since they are not exclusive.
“Innovations in services are a mix of reproduced innovations and ‘small’ non-reproduced changes to solve single customers’ problems. The latter is particularly a result of the customer interaction process“ (Sunbo & Gallouj, 2000).
Toivonen and Tuominen (2006) mention that a service innovation can also be a recurrence of an already present service into use while it brings advantage to the business that has developed the innovation. This advantage brought to the business for the most part comes from the extra value that the recurrence brings to the consumer. Furthermore, to be considered an innovation, this recurrence has to have a component which can be duplicated in additional situations Toivonen and Tuominen (2006).
Different groups of approaches have been classified by Coombs and Miles (2000) and confirmed later by Drejer (2004). They have classified them into three different groups:
• Assimilation (technological) approach, where the highlight is put onto technological innovations.
• Demarcation (non-technological) approach, or service oriented, where the highlight is put on the services that do not include the technology.
• Synthesis approach, where both of the technological and non-technological components are included.
14
To back this up, Gallouj & Savona (2010) mention that the multi-dimensional elements of service innovation include the non-technological and technological dimensions.
In the Handbook of Innovation and Services 2010 by Gallouj and Djellal, service innovation has been split into three approaches, “assimilation, differentiation and integration.” (Gallouj and Djellal 2010). According to the authors, the assimilative approach is dependable on technology and comes from the manufacturing businesses. Differentiation approach is originating to service and investigates the traits of the innovation in the service. Finally, there is integrative approach works both with service and goods in order to get innovation.
On the other hand, some authors argue that there are four different approaches. In addition to the previously listed one, they argue that the inversion approach should be included as well (cf. Gallouj, 1998; Gallouj and Weinstein, 1997; Coombs and Miles 2000; Droege et al., 2009; Miles et al. 2013) The inversion approach gives priority to involvement of Knowledge Intensive Business Services where the innovation inputs could be advisory, engineering, IT, R&D, etc. These approaches might be presented with different labels, depending on the authors.
Overall, a business’ competitive advantage can be achieved if the service provider satisfies the customers current and future needs with their innovating services and adds to customers perceived value (Kandampully and Duddy, 1999; Hinson 2017).
2.4.2. Service Innovation and Service Quality
Service Innovation plays an important role for Service Quality. It presents a productive way to motivate the design of new services, perfect the existing ones
15
and to boost service quality (O'Cass et al., 2015; Berry et al., 2006; Cheng et al., 2012). The authors suggest that the lasting life or the lasting growth of service businesses relies on their efficiency of integrating the service innovation to their work to carry quality service to the customers. Moreover, service quality can be explained as a signal of change advantage (Zhou et al., 2008)
If the services offered by businesses are seen by the users and recognized to be of better quality then the competition, then these businesses would be able to accomplish their craved financial aims (Bebko, 2000; Payne et al. 2005). O'Cass and Sok (2013) argued that customers nowadays have a larger access to data and information, thus they now demand improved services which include both new existing services. According to previous researches, scholars have established an idea that service innovation increases the growth of customer value and overall accomplishment (Arshad et al., 2015; Vermeulen et al, 2003). A great example of this could be found in a research performed by Lin (2011) concerning the Chinese tourism industry. It was found that there is a positive impact of service innovation on the Service quality as well as on the businesses performance.
2.4.3. Relationship between Service Innovation and Customer satisfaction
Researchers have stated that for a service providing business, its competitive advantage can be set up if the innovation is presented in a manner which allows them to deliver their customers’ needs (Hinson et al., 2017; Kandampully and Duddy, 1999). Other than this, Chapman et al. (2002) argues that innovation alone has minor importance compared to the value of the innovation from the customers perspective. This perspective is usually changed by the service innovations (De Jong et al., 2003; Tether et al., 2001)
16
In his study, Hinson et al. (2017) defined Customer satisfaction as the reaction on the anticipated performance of the product or service. This is established on the customers perception of the value built for them (Hinson et al., 2017; Flint et al., 1997). Based on these definitions, Hinson et al. (2017) concludes that perceived customer value anticipates the Customer Satisfaction since the value evaluation happens earlier then the response which in this case is satisfaction. The analytical relationship between customer satisfaction the perceived value has been experimentally confirmed by a number of literature where Customer value creation has been shown as a valuable element in acquiring customer satisfaction (Hinson et al., 2017; Zeithaml, 1988; McDougall and Levesque, 2000; Cronin et al., 2000; Wang and Ahmed, 2004; Turel and Serenko, 2006; Hume and Sullivan Mort, 2008; Kuo et al., 2009).
In simpler form, the generation of the customer value as a key factor of customer satisfaction is because the customers are probably going to feel positive about their buying decisions and the experience if they feel that there is a bigger level of value in the offered product or service (Oh, 200; Zeithaml, 1988).
3. METHODOLOGY
Subsequently after all variables were defined and described in detail, a survey was conducted to collect data needed for the hypothesis testing. Data was collected by using survey and is in the later part of the thesis analyzed and discussed.
3.1. Research design
Relation between variables; service innovation, service quality, perceived brand value and customer satisfaction were tested in order to support the hypotheses
17
of this research. This was the initial aim of the paper. Following this goal, cultural values and differences between Turkey and Bosnia and Herzegovina were analyzed in detail and compared through interpreting the results from survey.
3.2. Sample selection
Sampling method used in this research was convenience sampling method as there was accessibility limitation. Chosen subjects are students (Bachelor’s, Master’s and Doctorate degree) and the number of the sample specified to 306 is chosen for the results to be reliable. Moreover, sample results and participants were detached into two groups based on their country of residence; Turkey and Bosnia and Herzegovina. Equal number of respondents participated in the research; 153 from Turkey and 153 from Bosnia and Herzegovina.
3.3. Data collection
Data for the research was collected in Bosnia and Herzegovina and Turkey by using different student platforms. In Turkey, survey was uploaded on Istanbul Bilgi Universities electronic platform and on closed Facebook group page created for only students (Unirail/Odev, Proje Paylasimi, Ev Arkadasi, Ogrenci Kulupleri). In Bosnia and Herzegovina, electronic platform of Sarajevo School of Business and Economies was used to get responses.
3.4. Questionnaire design
In order to test the hypotheses a questionnaire (Appendix 1) was formed. It consists of five different sections including: demographics data (age, level of
18
education, gender, marital status and occupation), service innovation, service quality, perceived brand value and customer satisfaction.
All the obtained data was divided into two groups based on the country of residence of the respondents; Turkey and Bosnia and Herzegovina. Answers were collected by using a 5-point Likert scale which includes responses “strongly disagree”, “disagree”, “undecided”, “agree” and “strongly agree”. Service innovation includes 5 item scale, service quality 22 item scale, perceived brand value 11 item scale and customer satisfaction 3 item scale measurement.
For participants to give answers on service innovation, service quality, perceived brand value and customer satisfaction, they were asked to think of their favorite service provider while answering the sections.
3.5. The development of the theoretical framework for the research
By using service innovation as the independent variable of the research, its influence on service quality, perceived brand value and customer satisfaction and their subdimensions were the base for research model development.
Figure below shows this conceptual model and the theoretical framework of this thesis.
19
Figure 2- Model for the theoretical framework
Goal of this research was to test following hypotheses:
H1: There is a positive relation between Service Innovation and Perceived Service Quality.
H2: There is a positive relation between Service Innovation and Perceived Brand Value.
H3: Service Innovation has Direct and Positive relation on Customer Satisfaction.
H4: Service Quality is positively associated with Customer Satisfaction.
SERVICE QUALITY TANGIBLES, RELIABILITY, RESPONSIVENESS, ASSURANCE, EMPATHY PERCEIVED BRAND VALUE PERCEIVED FUNCTIONAL VALUE, PERCEIVED PRICE
VALUE, PERCEIVED EMOTIONAL VALUE, PERCEIVED SOCIAL VALUE
SERVICE INNOVATION CUSTOMER
20
H5: Perceived Brand Value is positively associated with Customer Satisfaction.
3.6. Research constructs
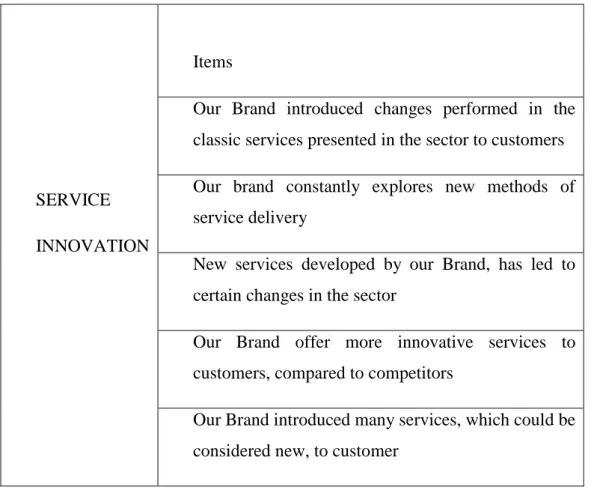
3.6.1. Service innovation construct
Service innovation was measured by using scale from Nasution, Hanny, N. and Mavondo, F. T. (2008) and Kanten, S. and Yaşıoğlu, M. (2012). 5-point Likert scale wa used to collect data, providing answers in terms of “strongly disagree”, “disagree”, “undecided”, “agree” and “strongly agree”. Respondents were asked to think of their favorite service provider while answering questions.
Table 1- Service innovation construct
SERVICE
INNOVATION
Items
Our Brand introduced changes performed in the classic services presented in the sector to customers
Our brand constantly explores new methods of service delivery
New services developed by our Brand, has led to certain changes in the sector
Our Brand offer more innovative services to customers, compared to competitors
Our Brand introduced many services, which could be considered new, to customer
21
3.6.2. Service quality construct
By using the 22-scale measurement obtained from Parasuraman, A. & Zeitham, V. A. (1998), Chingang, N. D. & Lukong, P. B. (2010), service quality results were collected. The scale is divided into subdimensions including tangibles, reliability, responsiveness, empathy and assurance. 5-point Likert scale wa used to collect data, providing answers in terms of “strongly disagree”, “disagree”, “undecided”, “agree” and “strongly agree”. Respondents were asked to think of their favorite service provider while answering questions.
Table 2-Service Quality construct
Item
Tangibles
Service Provider brand's store has up-to-date equipment.
Physical fascilities are virtually appealing
Employees are well dressed and appear neat.
Physical environment in the store is appropriate for the service provided.
When they promise to do something by a certain time, they do it.
22 SERVICE
QUALITY
Reliability
When customer has a problem, they should show sincere interest in solving the problem.
Service Provider's store perform the service right.
They provide their services at the time they promised to do so.
They keep their records accurately.
Responsiveness
Employees make information easily obtainable by customers.
Employees give prompt services to customers.
Employees are always willing to help customers.
Employees are never too busy to respond to customer requests.
Assurance
The behavior of employees instill trust in customers.
Customers feel safe in their transactions with the employees.
Employees are polite to customers.
Employees of the Service Provider's store have knowledge to answer to customer's questions and attention.
23 Empathy
Each customer is given individual attention.
Operating hours of the store are convenient to customers.
Employees give customers personal service.
Service Provider brand has their customer's interest at heart.
Employees of the Service Provider brand stores understand the specific needs of their customers.
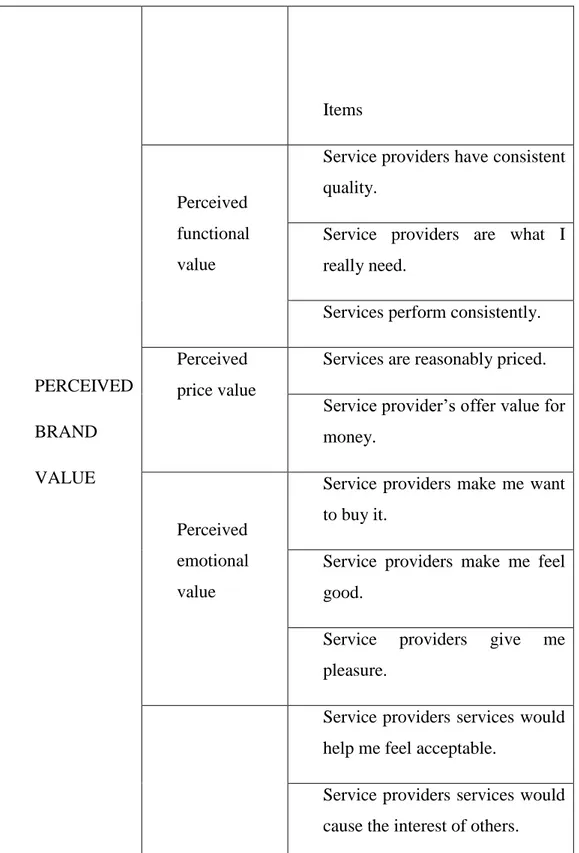
3.6.3. Perceived brand value construct
By using 5-point Likert scale and 11 item scale found in Omar et. al (2007), Peng and Liang (2013), Peng and Liang (2015), Demirgunes (2015) studies, perceived brand value was measure. Answers range from “strongly disagree”, “disagree”, “undecided”, “agree” to “strongly agree”. Respondents were asked to think of their favorite service provider while answering questions.
24
Table 3- Perceived Brand Value construct
PERCEIVED BRAND VALUE Items Perceived functional value
Service providers have consistent quality.
Service providers are what I really need.
Services perform consistently.
Perceived price value
Services are reasonably priced.
Service provider’s offer value for money.
Perceived emotional value
Service providers make me want to buy it.
Service providers make me feel good.
Service providers give me pleasure.
Service providers services would help me feel acceptable.
Service providers services would cause the interest of others.
25 Perceived social value
Service providers services would promote friendship between me and my friends.
3.6.4. Customer satisfaction construct
Adopted from Omar et al. (2007), Chen and Fu (2015) and Demirgunes (2015), a 3 item measurement was used to measure customer satisfaction. 5-point Likert scale was used and the responses range from “strongly disagree”, “disagree”, “undecided”, “agree” to “strongly agree”.
Respondents were asked to think of their favorite service provider while answering questions.
Table 4-Customer Satisfaction construct
CUSTOMER
SATISFACTION
Items
I am very satisfied with the retail brand's products.
Retail brand's products are the right decision.
26
4. DATA ANALYSIS AND DISCUSSION
Using the Statistical Package for Social Sciences (SPSS) obtained data was analyzed. By using reliability, t-test and regression analysis as methods data was analyzed in detail. Demographics of the sample and the relationship between dependent and independent variables under the effect of service innovation was given.
4.1. Descriptive statistics
Descriptive data obtained by the survey consists of gender, age, country of region, marital status, educational level and the occupation of the respondents.
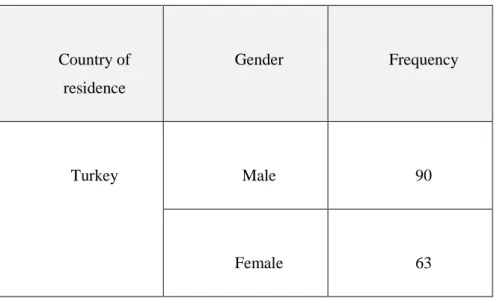
4.1.1. Gender
Sample of this research includes both male and female respondents and its sum is 306 answers. Total of 174 of the answers were given by male and 132 from female respondents. Given the data was obtained in two countries, in Turkey there were 90 male and 63 female participants, while in Bosnia and Herzegovina there were 84 male and 69 female participants.
Table 5-Gender Country of residence Gender Frequency Turkey Male 90 Female 63
27 Bosnia and Herzegovina Male 84 Female 69 Total 306 4.1.2. Age
Sample age ranges from 18 to 40 years old. Average age of the respondents is 23 years old. Three answers are missing, which gives a total of 300 answers.
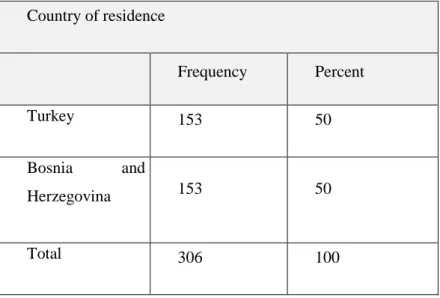
4.1.3. Country of residence
Total number of answered surveys is 306, and the answers were given equally in both Turkey and Bosnia and Herzegovina, each including 153 participants
28
Table 6-Country of residence
4.1.4. Marital Status
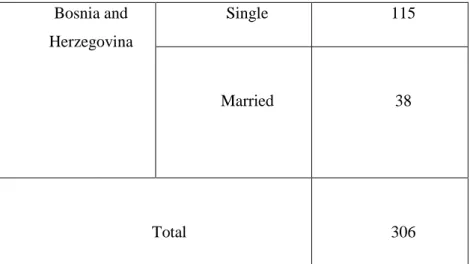
Majority of the sample is single, including a total of 237 participants (77.2%), while the rest 69 (22.5%) of them are married. When it comes to respondents based in Turkey, 122 participants are single and 31 married. In Bosnia and Herzegovina there are 115 single and 38 married respondents.
Table 7-Marital Status
Marital Status Frequency
Turkey Single 122 Married 31 Country of residence Frequency Percent Turkey 153 50 Bosnia and Herzegovina 153 50 Total 306 100
29 Bosnia and Herzegovina Single 115 Married 38 Total 306
4.1.5. Educational level of the sample
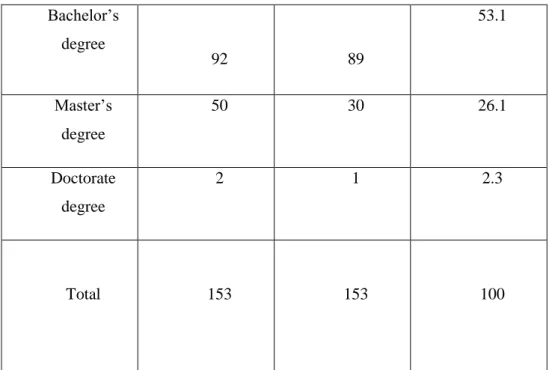
When it comes to educational level of the respondents it consists of primary school (0.3%), high school (15.6%), two-year degree (2%), Bachelor’s degree (53.1%), Master’s degree (26.1%) and Doctorate degree (2.3%).
Table 8-Level of education
Educational level
Frequency in Turkey
Frequency in Bosnia and
Herzegovina Total percent Primary school - 1 0.3 High school 3 30 15.6 Two-year degree 6 - 2
30 Bachelor’s degree 92 89 53.1 Master’s degree 50 30 26.1 Doctorate degree 2 1 2.3 Total 153 153 100 4.1.6. Occupation
Current occupation of 266 participants is student (86.6%), employees in firm 23 (7.5%), workers in governmental sector 7 (2.3%), business owners 3 (1%), 1 housewife (0.3%) and 6 participants with other current occupation (2%).
Table 9-Occupation Current occupation Frequency in Turkey Frequency in Bosnia and Herzegovina Total percent Student 135 131 86.6
31 4.2. Cultural values and differences
Culture is expressed by verbal guidelines, initiated from ones “social environment” (Hofstede, 2010). Hofstede (2010) defined culture as “the collective programming of the mind that distinguishes the members of one group or category of people from others.” Dimensions were defined as the elements of culture so that different cultures could be compared mutually. Five dimensions were used. They are: “Power Distance”, “Uncertainty Avoidance”, “Individualism versus Collectivism”, “Masculinity versus Femininity”, “Long Term versus Short Term Orientation” (Hofstede, 2009.) According to these dimensions, countries could be arranged comparative to other countries over a score on each of the dimensions (Hofstede 2009).
Power Distance, according to Hofstede (2009), relates “to the different solutions to the basic problem of human inequality;”. In other words, it is the distinction
Employee in a firm 13 10 7.5 Government sector employee 1 6 2.3 Owner of a business 1 2 1 Housewife - 1 0.3 Other 3 3 2 Total 153 153 100
32
for the power inequality boundaries, or to which extent do the other members of the society accept the inequality. The acceptance of the inequality varies from country to country and from culture to culture and usually it is the individuals in that culture who indicate the acceptance of it.
The Uncertainty Avoidance is the “extent to which the members of a culture feel threatened by certain and unknown situations” (Hofstede 2001). It is the degree of stress that a culture or a society is challenged with when their future is unknown (Hofstede 2009). Usually individuals with a high level of uncertainty avoidance are rule followers and are not ready to take a chance (Hofstede, 1980).
“Individualism versus Collectivism, related to the integration of individuals into primary groups;” (Hofstede, 2009)- in other words it is the “I” versus “WE”. Collectivist societies tend to protects its members in return for faithfulness. On the other hand, Individualistic societies do not have this tendency, rather everyone is for themselves.
The Masculinity versus Femininity dimension measures “the division of emotional roles between women and men;” (Hofstede, 2009). The author argues that in a feminine culture, women have the same values as men, while in masculine cultures women are “assertive and competitive, but not as much as the men”. There is a disparity in the values between these two cultures.
For the “Long Term versus Short Term Orientation”, Hofstede (2009) stated that it is “related to the choice of focus for people's efforts: the future or the present and past.”. It is characterizing a culture according to them being future or past and present oriented (Hofstede and Hofstede 2005, Podrug et al. 2006). Is the society living for the future or the present.
In today’s highly competitive and modern era, it is of great significance for a business to learn how cultures differ and how it effects their business if they are entering a new market (Podrug et al. 2006).
33
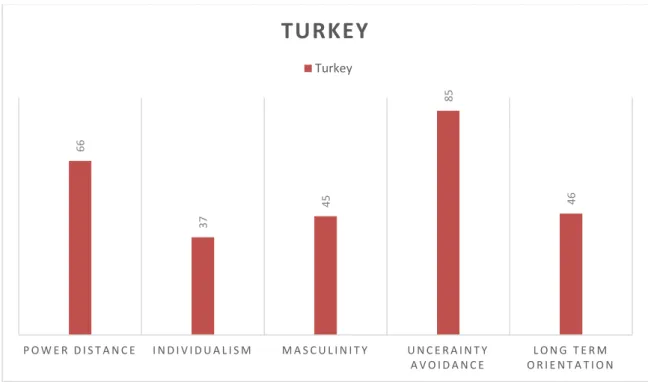
4.2.1. Turkey’s Hofstede dimension values
Hofstede’s dimensional values of Turkey are shown in the figure 3 bellow.
Figure 3-Turkey's cultural dimensions
Data for the figure is taken from “Hofstede insight”. Retrieved from
https://www.hofstede-insights.com/country/turkey/ on 11th May 2019.
4.2.2. Bosnia and Herzegovina’s Hofstede dimension values
Hofstede’s dimensional values of Bosnia and Herzegovina are shown in the figure 4 bellow.
Since the dimensional values of Bosnia and Herzegovina were not measured by Hofstede, data from a research made by Podrug et al. (2006) has been used. Five dimensional values for ex Yugoslavia which included Serbia, Croatia and Slovenia, were acquires by Hofstede (2001). Podrug et al. (2006) with their
66 37 45 85 46 P O W E R D I S T A N C E I N D I V I D U A L I S M M A S C U L I N I T Y U N C E R A I N T Y A V O I D A N C E L O N G T E R M O R I E N T A T I O N
TURKEY
Turkey34
research obtained the values of the national cultures. The scores were determined on the basis of Hofstede’s (2001) directions and are the closest satisfactory match for this research, and were used to characterize the culture in Bosnia and Herzegovina in this research.
Figure 4-Bosnia and Herzegovina cultural dimensions
Data taken from Podrug et al. (2006)
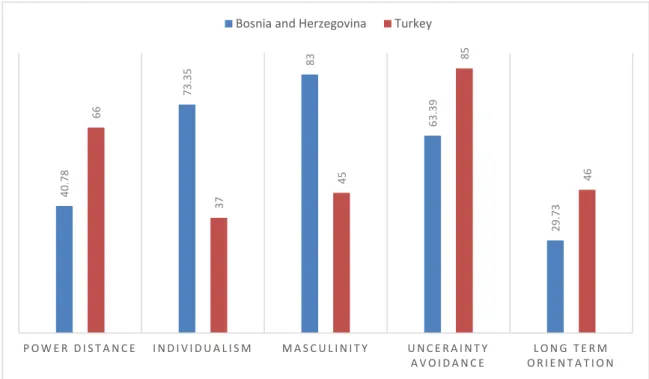
4.2.3. Comparison of five-dimensions of Turkey and Bosnia and Herzegovina
The comparison table for the five dimensional values of Turkey and Bosnia and Herzegovina can be found in the Figure 5 bellow.
40.7 8 73.3 5 83 63.3 9 29.7 3 P O W E R D I S T A N C E I N D I V I D U A L I S M M A S C U L I N I T Y U N C E R A I N T Y A V O I D A N C E L O N G T E R M O R I E N T A T I O N
BOSNIA AND HERZEGOVINA
35
Figure 5-Comparison of cultural values between Bosnia and Herzegovina and Turkey
Data taken from Podrug et al. (2006) and “Hofstede insight”. Retrieved from
https://www.hofstede-insights.com/country/turkey/ on 11th May 2019.
The score of Turkey for Power distance is 66 which is a high score compared to Bosnia and Herzegovina with a score 40,78. This means that Turkish people are used to a hierarchical style where the ideal boss figure would be the father. It’s a dependent style where the information stream is selective. It is close to a patriarchal style according to Hofstede insights. Bosnia on the other hand, with a lower score would have a style where the society would favor the equality, and would be less of a patriarchal style.
If we compare the scores for the Individualism/Collectivism dimensions between Bosnia and Herzegovina and Turkey we can see that Turkey with its score of 37 is a collectivistic society while Bosnia and Herzegovina with a score
40.7 8 73.3 5 83 63.3 9 29.7 3 66 37 45 85 46 P O W E R D I S T A N C E I N D I V I D U A L I S M M A S C U L I N I T Y U N C E R A I N T Y A V O I D A N C E L O N G T E R M O R I E N T A T I O N Bosnia and Herzegovina Turkey
36
of 73,55 points out a high level of individualism. In a collectivistic society such as Turkish society, people belong in groups, importance is put on “we“ and stress is put out on belonging. While on the other hand, in an individualistic society such as Bosnia and Herzegovina in this example, people do not belong to groups, they should take care of themselves, importance is put on “I“ rather than “we“, and right of privacy must be respected (Hofstede 2009).
Masculinity/Feminity – Here again we see a difference of values between Turkey and Bosnia and Herzegovina. With a high value of 83, Bosnia and Herzegovina have a Masculine culture, where gender roles are pointed out and where value is not put on the quality and leisure of life, but rather it is put on the material portion. Turkey on the other hand scores 45 and gets positioned on the Feminine side. This means that quality of life and leisure are important and gender inequality is smaller than in the countries that score high (Hofstede 2010)
We can witness a close score between the two countries when it comes to Uncertainty Avoidance. Turkey’s score is 85 while Bosnia and Herzegovina scores 63,39. This means that both of the societies are not comfortable with the unknown, and that they follow a lot of rituals and rules (Hofstede, 2010).
Finally, the long-term/short-term orientation scores are presented. Turkey’s score in this dimension is 46 which is the middle of the scale so a superior cultural preference cannot be determined. Alternatively, Bosnia and Herzegovina scores 29,73, which is a low score, and the superior cultural preference can be defined as short-term adjusted. The attention is given to history and tradition.
37 4.3. Analysis of the results
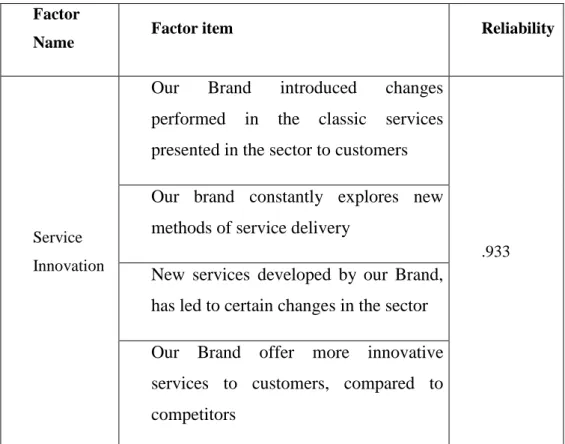
4.3.1. Reliability analysis for service innovation
As service innovation is the main construct of this research it was first analyzed. Cronbach’s coefficient alpha and reliability scores were estimated and were shown to be reliable. All the factors were analyzed.
Factor items are included in the appendix of the study.
Table 10- Reliability analysis for service innovation Factor
Name Factor item Reliability
Service Innovation
Our Brand introduced changes performed in the classic services presented in the sector to customers
.933 Our brand constantly explores new
methods of service delivery
New services developed by our Brand, has led to certain changes in the sector
Our Brand offer more innovative services to customers, compared to competitors
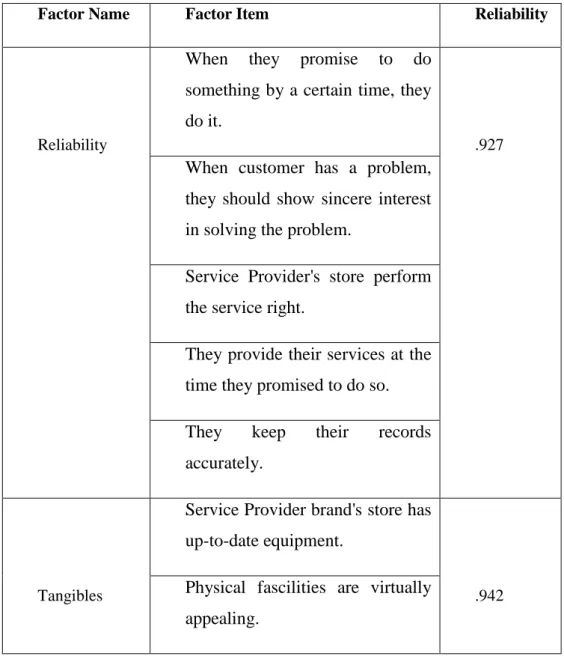
4.3.2. Reliability analysis of service quality
After performing reliability test and estimating Cronbach’s alpha coefficient on subdimensions of service quality (reliability, assurance, empathy,
38
responsiveness and tangibles), obtained results were reliable. All the factors were analyzed.
Factor items are included in the appendix of the study.
Table 11-Reliability analysis of service quality
Factor Name Factor Item Reliability
Reliability
When they promise to do something by a certain time, they do it.
.927 When customer has a problem,
they should show sincere interest in solving the problem.
Service Provider's store perform the service right.
They provide their services at the time they promised to do so.
They keep their records accurately.
Tangibles
Service Provider brand's store has up-to-date equipment.
.942 Physical fascilities are virtually
39
Employees are well dressed and appear neat.
Physical environment in the store is appropriate for the service provided.
Responsiveness
Employees make information easily obtainable by customers
.926 Employees give prompt services
to customers.
Employees are always willing to help customers.
Employees are never too busy to respond to customer requests.
Empathy
Each customer is given individual attention.
.925 Operating hours of the store are
convenient to customers.
Employees give customers personal service.
Service Provider brand has their customer's interest at heart.
Employees of the Service Provider brand stores understand the specific needs of their customers.
40 Assurance
The behavior of employees instill trust in customers.
.932 Customers feel safe in their
transactions with the employees.
Employees are polite to customers.
Employees of the Service Provider's store have knowledge to answer to customer's questions and attention.
4.3.3. Reliability analysis of perceived brand value
After performing reliability test and estimating Cronbach’s alpha coefficient of all subdimensions of perceived brand value (perceived functional value, perceived price value, perceived emotional value and perceived social value) obtained results were reliable. All the factors were analyzed.
Factor items are included in the appendix of the study.
Table 12- Reliability analysis of perceived brand value
Factor Name Factor Item Reliability
Perceived functional value
Service providers have consistent quality.
.928 Service providers are what I really
need.
41 Perceived price
value
Services are reasonably priced.
.859 Service provider’s offer value for
money.
Perceived emotional value
Service providers make me want to buy it.
.907 Service providers make me feel
good.
Service providers give me pleasure.
Perceived social value
Service providers services would help me feel acceptable.
.856 Service providers services would
cause the interest of others.
Service providers services would promote friendship between me and my friends.
4.3.4. Reliability analysis of customer satisfaction
After performing reliability test and estimating Cronbach’s alpha coefficient, obtained results were reliable. All the factors were analyzed.
Factor items are included in the appendix of the study.
42
4.3.4. Regression analysis of Service Innovation and Service Quality
In order to find if there is a relationship between service innovation and service quality, multiple linear regression analysis was obtained on all the subdimensions of service quality.
The results of regression analysis show significance (tangibles: R2=.565; F=383.723, p=.000, reliability : R2=.578; F=405.787, p=.000, responsiveness : R2=.561; F=378.193, p=.000, assurance : R2=.570; F=392.193, p=.000, empathy : R2=.462; F=253.836, p=.000) meaning service innovation has an
Factor Name Factor item Reliability
Satisfaction
I am very satisfied with the retail brand's products.
.941 Retail brand's products are the
right decision.
Retail brand's products satisfy my needs.
43
impact on all subdimensions of service quality. In the table below you can see the regression analysis results.
The relationship between these variables is positive based on βvalue.
Table 14- Regression analysis of Service Innovation and Service Quality Independent Variable: Service Innovation
Dependent variables: Beta t-value p-value
Tangibles 0.751 5.398 0.000
Reliability 0.760 6.097 0.000
Responsiveness 0.749 5.521 0.000
Assurance 0.755 6.509 0.000
Empathy 0.680 6.687 0.000
After applying regression analysis, it was shown that service innovation has a positive impact on service quality and all its’ subdimensions, supporting the hypothesis:
H1: There is a positive relation between Service Innovation and Perceived Service Quality.
4.3.5. Regression analysis of Service Innovation and Perceived Brand Value
The results of regression analysis show significance (perceived functional value: R2=.560; F=368.817, p=.000, perceived price value: : R2=.397;
F=194.590, p=.000, perceived emotional value: R2=.494; F=283.408, p=.000, perceived social value: R2=.309; F=130.079, p=.000) meaning service
44
innovation has an impact on all subdimensions of perceived brand value. In the table below you can see the regression analysis results.
The relationship between these variables is positive based on βvalue.
Table 15-Regression analysis of Service Innovation and Perceived Brand Value Independent Variable: Service Innovation
Dependent variables: Beta t-value p-value
Perceived Functional
Value 0.748 6.070 0.000
Perceived Price Value 0.630 5.091 0.000
Perceived Emotional
Value 0.703 7.769 0.000
Perceived Social Value 0.309 7.719 0.000
After applying regression analysis, it was shown that service innovation has a positive impact on perceived brand value and all its’ subdimensions, supporting the hypothesis:
H2: There is a positive relation between Service Innovation and Perceived Brand Value.
4.3.6. Regression analysis of Service Innovation and Customer Satisfaction
The results of regression analysis show significance (perceived functional value: R2=.545; F=354.051, p=.000) meaning service innovation has an impact on customer satisfaction. In the table below you can see the regression analysis results.
45
Table 16- Regression analysis of Service Innovation and Customer Satisfaction Independent Variable: Service Innovation
Dependent variable: Beta t-value p-value
Customer Satisfaction 0.739 8.715 0.000
After applying regression analysis, it was shown that service innovation has a positive impact on customer satisfaction, supporting the hypothesis:
H3: Service Innovation has Direct and Positive relation on Customer Satisfaction.
4.3.7. Regression analysis of Customer Satisfaction and Service Quality
The results of regression analysis show significance (assurance: R2=.637; F=526.346, p=.000, tangible: : R2=.680.; F=317.581, p=.000, reliability: R2=.693; F=224.026, p=.000) meaning some subdimensions of service quality have positive impact on customer satisfaction. Due to their insignificance (not less than .05) empathy and responsiveness were excluded and have no impact on customer satisfaction value. In the table below you can see the regression analysis results.
The relationship between these variables is positive based on βvalue.
Table 17-Regression analysis of Customer Satisfaction and Service Quality Independent Variable: Customer Satisfaction
Dependent variables: Beta t-value p-value
46
Tangibles 0.370 6.336 0.000
Reliability 0.263 3.535 0.000
After applying regression analysis, it was shown that some subdimensions of service quality have a positive impact on customer satisfaction, partially supporting the hypothesis:
H4: Service Quality is positively associated with Customer Satisfaction.
4.3.8. Regression analysis of Perceived Brand Value and Customer Satisfaction
The results of regression analysis show significance (perceived functional value: R2=.680; F=608.890, p=.000, perceived emotional value: : R2=.711.; F=350.918, p=.000, perceived social value: R2=.717; F=240.285, p=.000) meaning some subdimensions of perceived brand value have positive impact on customer satisfaction. Due to their insignificance (not less than .05) perceived price value was excluded and has no impact on customer satisfaction. In the table below you can see the regression analysis results.
The relationship between these variables is positive based on βvalue.
Table 18- Regression analysis of Perceived Brand Value and Customer Satisfaction Independent Variable: Customer Satisfaction
Dependent variables: Beta t-value p-value
Perceived Functional
47 Perceived Emotional
Value 0.321 5.512 0.000
Perceived Social Value 0.122 2.491 0.000
After applying regression analysis, it was shown that some subdimensions of service quality have a positive impact on customer satisfaction, partially supporting the hypothesis:
H5: Perceived Brand Value is positively associated with Customer Satisfaction.
4.4. Independent sample t-test analysis for country of residence
4.4.1. Independent sample t-test for country of residence and service innovation
In this research, t-test analysis was used to prove if differences of the respondents are due to the country of residence, Turkey or Bosnia and Herzegovina.
Obtained results show country of residence makes no significant difference on service innovation variable.