Energy Calculations: International Conference on Sustainable Energy and En-ergy Calculations (ICSEEC)
Full Papers of International Conference on Sustainable Energy and Energy Calcu-lations (ICSEEC2019)
Organized by Turkish-German University, Beykoz, Istanbul, Turkey Conference Place & Dates: Koycegiz, Mugla, Turkey, 12-14 April 2019
Editor: Sahin Uyaver
Editorial Board:
Mehmet Turan Goruryilmaz Elvan Burcu Kosma
Muhammed Cihat Mercan Berat Berkan Unal
Book Cover Design: Elvan Burcu Kosma
Published by: Turkish-German University www.tau.edu.tr
Sahinkaya Cad. No: 86 34820 Beykoz, Istanbul, Turkey 24th October 2019
ISBN: 978-605-65842-1-3 DOI: 10.5281/zenodo.3597797
Preface
The International Conference on Sustainable Energy and Energy Calculations (IC-SEEC) provides a forum for accessing to the up-to-date and authoritative knowl-edge from both engineering and science research areas related to energy science and technology.
The first ICSEEC was successfully taken place in Koycegiz, Mugla, Turkey dur-ing the period 12-14 April 2019. Durdur-ing the conference more than 40 paper-talks were delivered, which were under Energy Science and Technology, Enviromental Science and Engineering, Motivation, Electrical Engineering, Development and Utilization of Resources. The conference received a significant attention by the contributions from around the world.
We would also like to take this opportunity to thank many people. First and foremost we want to express our deep appreciation to the keynote speaker, the invited speakers, the session chairs and the reviewers for their efforts and kind help in this conferemce. Final thanks go to all authors and participants at ICSEEC2019 for helping to make it a productive and interactive meeting.
We acknowledge that the conference was succesfully completed as being hosted by Koycegiz Mugla Governorship and Municipality and also importantly as being financially supported by MEVASIS of Istanbul.
Contents
Fabrication and Electronic Properties of a Diode Based On Organic
Material 1
Optoelectronic Device Based On Gold Nanoparticle 5
Preparation and Characterization of Pristine and Al-doped Copper
Oxide Thin Films for Solar Cell Applications 10
Microplastic Accumulation in Rainbow Trout (Oncorhynchus Mykiss) 18 Occupational Health and Safety Study in Coal Thermal Power Plant 27
Human Awareness and Ecological Footprint 44
Investigating Household Electricity Consumption of Engineering
Stu-dents 55
A Study on the Modelling of Electrical Energy Consumption and En-ergy Density of Turkey and Comparisons With Other Countries 65 Critical Review of Sustainability Reports of Banking Sector in Turkey 76
Fabrication and Electronic Properties of a Diode
Based On Organic Material
Bayram Gunduz
[email protected], Department of Science Education, Faculty of Education, Mus Alparslan University, Turkey
Abstract
The anticipated advantages of organic materials rely on the possibility to fabri-cate organic opto-electronic devices. In here, a diode based on organic material (TDCV-TPA semiconductor) was fabricated. The current-voltage (I-V) measure-ments under dark were taken with a Keithley 2400 sourcemeter. The electronic parameters such as rectification ratio (r), reverse saturation current (Io), ideality
factor (n) and barrier height (φB) of the diode were obtained.
Introduction
Organic semiconductors (OSCs) have been studied since the early 1950s [1], deal-ing essentially with small molecules, e.g., condensed hydrocarbons and dyes [2]. The anticipated advantages of organic materials rely on the possibility to fabri-cate organic opto-electronic devices such as organic photovoltaics (OPVs), organic photovoltaic cells (OPVCs), organic field-effect transistors (OFETs), organic pho-totransistors, organic light emitting diodes (OLEDs), organic photodetectors and organic resonant tunneling diodes [3, 4, 5, 6].
Thienylenevinylenetriphenylamine functionalized with peripheral dicyanoviny-lene groups (TDCV-TPA) was designed as an isotropic material for solar cells [7]. TDCV-TPA displays an appreciable photoluminescence (PL) quantum efficiency [8].
The main aim of this study is to fabricate a n-Si/TDCV-TPA/Al diode and investigate its electronic properties by current–voltage measurements under dark.
Experimental
Active layer material
In here, tris[4-(5-dicyanomethylidenemethyl-2-thienyl)phenyl]amine (TDCV-TPA) small-molecule semiconducting dye was used as active layer. TDCV-TPA was purchased from Sigma–Aldrich Co.
The fabrication of the diode
To fabricate n-Si/TDCV-TPA/Al diode, n-type Si was purchased from the Sigma-Aldrich Co. Firstly, the smooth cut n-Si wafer was degreased with diamond cutter. Then, n-Si wafer was chemically cleaned with well-known RCA cleaning proce-dure [9]. Cleaned n-Si wafer was rinsed in deionized water (DIW) and was dried by high purity nitrogen [10]. Then, without wasting time a high purity aluminium (Al) metal was thermally deposited on the whole back surface of the n-Si using PVDHANDY/2S-TE thermal evaporation system. Then, TDCV-TPA active layer was thermally evaporated onto the whole bright surface of the n-Si-substrate. Fi-nally, the Al metal was deposited on active layer. The rectifying contacts were formed in the form of circular dots of 1.930 mm diameter. The schematic struc-ture of the n-Si/TDCV-TPA/Al diode is shown in Figure 1. The current-voltage (I-V) measurement was recorded under dark with a Keithley 2400 sourcemeter.
Figure 1: The schematic structure of the diode.
Results and discussion
Electronic properties of n-Si/TDCV-TPA/Al diode
The current-voltage (I-V) characteristics of n-Si/TDCV-TPA/Al diode for forward and reverse region were measured and were indicated in Figure 2(a,b) for non-logarithmic (I vs V) and semi-non-logarithmic (lnI v. V) currents vs V, respectively. The n-Si/TDCV-TPA/Al diode indicates a rectifying diode in forward-bias region. The rectification ratio (r) is a significant parameter for a rectifying diode and is given by,
r = If Ir
where If is forward current and Ir is reverse current. The rectification ratio of
n-Si/TDCV-TPA/Al diode was found to be 76.71.
For a non-ideal diode, the standard equation of diode can be expressed by tak-ing into account serial resistance can be written by:
I = I0
h
e−q(VnkT−IRs)
i
(2) where q is the electronic charge, Rs is the series resistance, n is the ideality
factor, k is the Boltzmann constant, T is the temperature and I0 is the reverse
saturation current.
The saturation current of the diode was obtained from the linear portion inter-cept of logI at V=0. Then, the ideality factor value of the diode under dark was found to be 2.774.
The barrier height of n-Si/TDCV-TPA/Al diode under dark was obtained as 0.929 eV.
Figure 2: The plots of the a) I vs V and b) lnI vs V of the diode.
Conclusions
In here, the n-Si/TDCV-TPA/Al diode was fabricated using a soluble isotropic organic semiconductor. The current-voltage (I-V) characteristics under dark were investigated and its electronic parameters such as rectification ratio, reverse satu-ration current, ideality factor and barrier height were obtained. In further studies, I-V measurements of diode under different light intensities, even C-V measure-ments can be also taken. The effects of light on the diode can be examined. In other words, photoelectric properties can also be examined.
Acknowledgements
This study was supported by The Management Unit of Scientific Research Projects of Mus Alparslan University (MUSBAP) under Project BAP-17-EMF-4901-09.
References
[1] Pope M., Swenberg C.E., ”Electronic Processes in Organic Crystals”, Oxford University Press, New York, 1982.
[2] Gunduz B., ”Effects of Molarity and Solvents on the Optical Properties of the Solutions of tris[4-(5-dicyanomethylidenemethyl-2-thienyl)phenyl]amine (TDCV-TPA) and Structural Properties of Its Film”, Optical Materials, 36, 425-436, 2013.
[3] Li G., Shrotriya V., Huang J.S., Yao Y., Moriarty T., Emery K., Yang Y., ”High-efficiency Solution Processable Polymer Photovoltaic Cells by Self-Organization of Polymer Blends”, Nature Materials, 4, 864-868, 2005.
[4] Kulkarni A.P., Tonzola C.J., Babel A., Jenekhe S.A., ”Electron Transport Ma-terials for Organic Light-Emitting Diodes”, Chem. Mater., 16, 4556-4573, 2004. [5] Pelzer K.M., Darling S.B., ”Charge Generation in Organic Photovoltaics: A
Review of Theory and Computation”, Mol. Syst. Des. Eng., 1, 10–24, 2016. [6] Wang C., ”High Performance Thin Film Transistors Based on Regioregular
poly(3-dodecylthiophene)-sorted Large Diameter Semiconducting Single-walled Carbon Nanotubes”, Nanoscale, 5, 4156-4161, 2013.
[7] Cravino A., Leriche P., Aleveque O., Roquet S., Roncali J., ”Light-emitting or-ganic solar cells based on a 3d conjugated system with internal charge transfer”, Adv. Mater., 18, 3033–3037, 2006.
[8] Roquet S., Cravino A., Leriche P., Aleveque O., Frere P., Roncali J., ”Triphenylamine-thienylenevinylene hybrid systems with internal charge trans-fer as donor materials for heterojunction solar cells”, J. Am. Chem. Soc., 128, 3459–3466, 2006.
[9] Gunduz B., Turan N., Kaya E., Colak N., ”The photo-electrical properties of the p-Si/Fe(II)–polymericcomplex/Au diode”, Synthetic Metals, 184, 73–82, 2013.
[10] Gunduz B., Yahia I.S., Yakuphanoglu F., ”Electrical and photoconductivity prop-erties of p-Si/P3HT/Al and p-Si/P3HT:MEH-PPV/Al organic devices: comparisonstudy”, Microelectron. Eng., 98, 41–57, 2012.
Optoelectronic Device Based On Gold
Nanoparti-cle
Bayram Gunduz
[email protected], Department of Science Education, Faculty of Education, Mus Alparslan University, Turkey
Abstract
Gold nanoparticles (GNPs) are versatile materials for a wide applications and have been used for centuries. More recently, these unique optoelectronic properties have been researched and utilized in high technology applications. In this study, a gold nanoparticle was used and electronic, photonic and optoelectronic characteristics of optoelectronic device based on GNP were investigated. Many interesting and useful results were obtained.
Introduction
Nanoparticles (NPs) obey the laws of quantum mechanics due to their small di-mensions, so NPs have the ability to participate in quantum tunneling. Gold nanoparticles (GNPs) are versatile materials for a wide applications and have been used for centuries because of the vibrant colors produced by their interaction with visible light, easy modified surface chemistry and well-developed synthetic proce-dures [1, 2, 3]. In recent years, these unique optoelectronic properties have been investigated. The GNPs have been used in many high electronic, photonic and op-toelectronic applications including electronic conductors, therapeutic agents, drug delivery in biological and medical applications, organic photovoltaics, catalysis and sensory probes [4, 5].
Electronic and optoelectronic devices, from computers and smart cell phones to solar cells, have become a part of our life [6]. Gold nanoparticles present dis-tinct physical and optical properties and these properties vary depending on their shape, size, agglomeration state and surface structure. In here, the electronic, photonic and optoelectronic characteristics of optoelectronic device based on gold nanoparticle were investigated.
Experimental
Material
Gold nano-urchins were used in this study and purchased from Sigma-Aldrich Com-pany. There are some synonyms such as gold nanoparticles and non-functionalized
Table 1: Product properties of gold nano-urchins.
Molecular weight (g/mol) 196.97
Average particle size (nm) (in 0.1 mM PBS) 50
Molar Concentration (M) 5.83x10⁻¹¹
Particles (/mL) 3.51x10¹⁰
Surface area (nm2) 7.85x10³
Particle Volume (nm3) 6.54x10⁴
gold nanoparticles of this material. The product properties of the material is given in Table 1.
Figure 1 indicates the TEM of 100 nm gold nano urchins in the literature [?].
Figure 1: TEM of 100 nm gold nano urchins [?].
Measurements
The UV–Visible absorption spectra of the gold nano-urchins were performed with a Shimadzu model UV-1800 spectrophotometer. The current-voltage (I-V) measure-ments of the optoelectronic device were recorded with a Keithley 2400 sourcemeter.
Results and discussion
Gold nanoparticles (GNPs)
There are various sizes of gold nanoparticles (GNPs) and their sizes vary from 1 nm to 8µm. Also, GNPs exhibit different shapes such as spherical, sub-octahedral, oc-tahedral, decahedral, icosahedral multiple twined, multiple twined, irregular shape, tetrahedral, nanotriangles, nanoprisms, hexagonal platelets and nanorods as seen in Figure 2 [8].
Figure 2: Various shapes of the GNPs [8].
UV–visible absorption spectra
The UV–visible absorption spectrum of the gold nano-urchins is shown in Figure 3. As seen in Figure 3, the maximum in the Au absorbance intensity is observed at 584.4 nm. The optical properties such as absorption maxima and absorption intensity are particle size dependent. An intense absorption peak at 584.4 nm is generally attributed to the surface plasmon excitation of gold nano-urchins.
Electronic properties
The current-voltage characteristic of the optoelectronic device is shown in Figure 4. In other words, the I-V curve shows a sensitivity of the current to voltage (ie electrical response). At the positive voltages, the current of the device increases almost linearly in the range of the milli ampere with the voltage as seen in Figure 4.
Figure 4: The current-voltage characteristic of the optoelectronic device.
Conclusions
The electronic, photonic and optoelectronic properties of gold nano-urchins were investigated. The maximum in the Au absorbance intensity is observed at 584.4 nm, which is generally attributed to the surface plasmon excitation of gold nano-urchins. The electrical response of the optoelectronic device was investigated by I-V characteristic. In future studies, optoelectronic devices can be produced under different conditions and their effects on optoelectronic properties can be examined.
Acknowledgements
This study was supported by The Management Unit of Scientific Research Projects of Mus Alparslan University (MUSBAP) under Project BAP-17-EMF-4901-09.
References
[1] Ali M.E., Hashim U., Mustafa S., Che Man Y.B., Islam Kh.N., ”Gold Nanopar-ticle Sensor for the Visual Detection of Pork Adulteration in Meatball Formu-lation”, Journal of Nanomaterials, Vol. 2012, Article ID 103607, 7 pages, 2012. [2] Brown S.D., Nativo P., Smith J.-A., Stirling D., Edwards P.R., Venugopal B., Flint D.J., Plumb J.A., Graham D., Wheate N.J., ”Gold nanoparticles for the improved anticancer drug delivery of the active component of oxaliplatin”, J. Am. Chem. Soc., 132, 4678-4684, 2010.
[3] Stuchinskaya T., Moreno M., Cook M.J., Edwards D.R., Russell D., ”Targeted photodynamic therapy of breast cancer cells using antibody-phthalocyanine-gold nanoparticle conjugates”, Photochem. Photobiol. Sci., 10, 822-831, 2011. [4] Perrault S.D., Chan W.C.W., ”In vivo assembly of nanoparticle components
to improve targeted cancer imaging”, Proc. Natl. Acad. Sci. USA, 107, 11194-11199, 2010.
[5] Peng G., Tisch U., Adams O., Hakim M., Shehada N., Broza Y.Y., Bilan S., Abdah-Bortnyak R., Kuten A., Haick H., ”Diagnosing lung cancer in exhaled breath using gold nanoparticles”, Nature Nanotech., 4, 669-673, 2009.
[6] Zhu T., Cloutier S.G., Ivanov I., Knappenberger Jr. K.L., Robel I., Zhang F., ”Nanocrystals for Electronic and Optoelectronic Applications, Journal of Nanomaterials” Volume 2012, Article ID 392742, 2 pages, 2012.
[7] Last Access on 12.12.2019 from http://www.cytodiagnostics.com/store/ pc/100nm-Gold-NanoUrchins-20ml-p1726.htm.
[8] Khan A.K., Rashid R., Murtaza G., Zahra A., ”Gold Nanoparticles: Synthe-sis and Applications in Drug Delivery”, Tropical Journal of Pharmaceutical Research, 13, 1169-1177, 2014.
Preparation and Characterization of Pristine and
Al-doped Copper Oxide Thin Films for Solar Cell
Applications
Didem Tosun
1, Bunyamin Sahin
21 [email protected], Department of Physics, Graduate School of Natural and
Applied Sciences, Mustafa Kemal University, Turkey
2 Department of Physics, Faculty of Arts and Sciences, Mustafa Kemal University,
Turkey
Abstract
In this study, pristine and Al-doped CuO thin films were produced on soda-lime glass substrates by using the SILAR method. The influence of Al-doping con-centration on the morphological, crystalline structure and optical properties of CuO materials were investigated by Scanning Electron Microscopy (SEM), X-ray diffraction (XRD) and UV-vis spectrophotometry measurements. From the SEM analysis, it was observed that Al addition increased the sizes of the particles. From the XRD analysis, it was obtained that Al addition tends to increase grain size. UV-vis. measurements exhibited that the optical band gap energy of the CuO films was increased with the increasing Al-doping percentage.
Keywords: CuO, SILAR, Al-doping, optical properties, solar cells.
Introduction
Semiconductors are the most interesting and most important class of solids and they have a wide range of applications in areas ranging from metals to insulators. The electrical conductivity of a semiconductor is directly dependent on the tem-perature and the most important feature of a semiconductor is the reduction of its resistivity when the temperature is increased [1, 2].
Metal oxide nanostructured materials are employed in the manufacture of var-ious kinds of electronic devices, such as diodes, transistors, and biosensors. Metal oxide based devices have found large application due to their low cost, reliability and efficiency [3]. Metal oxide nanostructured materials represent an improving interest in different industries, especially with their proliferate physical and opto-electronic properties compared with their bulk counterparts [4, 3].
Among them, copper oxide (CuO) is one of the most discovered semiconductors due to their non-toxicity and great chemical stability. CuO is an important p-type
transition metal oxide with a narrow band gap of 1.2 eV range to 2.1 eV [4]. Main physical properties of CuO films depend on their structural, morphological, prop-erties which are violently dependent on the arranging process. For nanostructured metal oxides, doping is a powerful way to organize their main physical and chem-ical properties. For this reason, different metal elements doped nanostructured thin film nanomaterials have become a focus for numerous researchers [8, 8]. The optical characteristics and thus the absorbance and transmittance of CuO can also be controlled by doping. Crystallite size and optical band gap and of CuO films can be adjusted by adding various dopants.
Many deposition techniques like molecular beam epitaxy [9], sputtering tech-nique [10], pulsed laser deposition [6], sol-gel process [5], thermal evaporation method [13] and Successive Ionic Layer Adsorption and Reaction (SILAR) [4] have been utilized for the deposition of nanostructured metal oxide films. SILAR is a promising method because it is a simple, cheap, safe manufacturability and envi-ronmental friendly method [4, 14].
In the present paper, we produced pristine and Al-doped CuO thin films via using SILAR method. We focused on the structural, morphological and optical band gap energy properties of CuO films with the effect of Al concentrations in the growth solution.
Experiments
Pristine and Al-doped CuO films were obtained by the SILAR technique. The non-conductive microscope soda-lime glass slides were used in the experiments. Before the growth of thin film, the glass substrates were cleaned as reported elsewhere [15]. 0.1 M copper cloride solution was prepared via using Copper (II) Chloride Dihy-drate. The pH value of the Copper (II) Chloride Dihydrate solution was regulated via adding NH3. Then, to obtain CuO films the glass substrates was first immersed in Copper (II) Chloride Dihydrate aqueous solution for 20 s to adsorb copper ions onto the glass slide. Then the substrate was rinsed for 20 s in DI water to remove weakly bound. So as to investigate the effect of Al-doping to the nanostructured CuO films different concentrations of AlCl3.2H2O salt were added to CuO solution bath. The aluminium doping level was varied from 0 to 2 at %.
All analyzes of the samples were performed at room temperature. X-ray diffrac-tometer was used to analyze the crystal structure. SEM was used to analyze the surface morphological. The optical band gaps of the films were recorded using with un-polarized incident light perpendicular to the surface of the film.
Results and Discussion
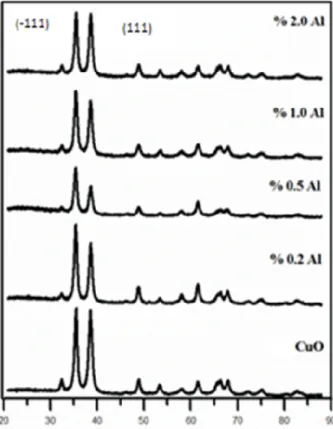
The XRD patterns were used to determine the structural properties of pristine and Al-doped CuO films. Figure 1 presents the XRD patterns of CuO films deposited on the glass substrates via the SILAR technique. All the XRD patterns show a cubic crystal structure having a strong preferential orientation in the (111) and (111)
direction. It is observed that a serious change in peak intensities with the change in aluminium concentration in the growth solution. This peak intensity change with the metal doping may be attributed to the change in crystalline quality of nanostructured thin films. The estimated crystallite size (D) of the samples was
Figure 1: X-ray diffraction patterns of pristine and Al-doped CuO thin films.
estimated using the well-known Scherrer’s formula:
D = kλ
β cos θ, (1)
where β is the full width at half-maximum of diffraction, θ is the diffraction angle of the corresponding peak and λ is the wavelength of X-ray radiation. The calculated D values have been listed in Table 1. The estimated crystallite size has been found to vary between 21.82 and 20.07 nm with Al content, achieving the maximum in the case of 1.0 at %. This type of change in crystallite size as a consequence of doping process was reported in literature [16, 17]. For surface morphological examination of pristine and Al-doped CuO thin films, SEM was used.
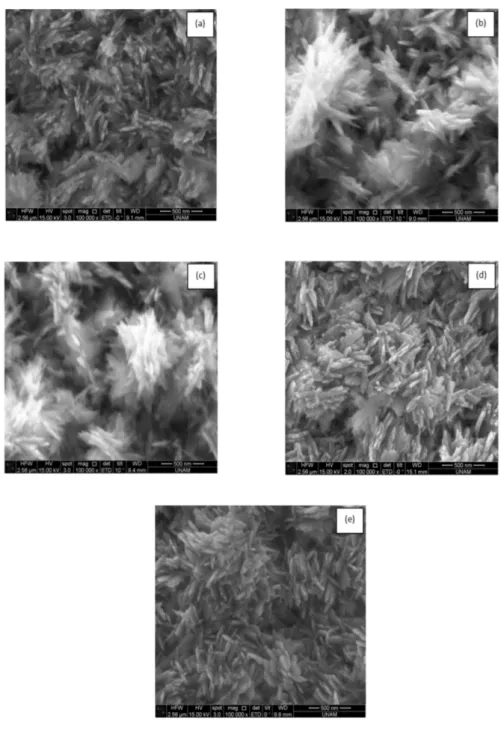
Figure 2 presents the influence of aluminium concentration in the growth so-lution on surface morphology of the CuO samples. It can be seen that, there are plate-like CuO nanostructures which cover the whole surface of samples homoge-neously. But with increased aluminium content, the shape and size of nanostruc-tures start to change. The aluminium content in the growth solution stimulates an obvious change of particle size. The significant result is that the plate-like nanos-tructures are similar to our previous work [8]. In order to calculate the optical
Table 1: Estimated crystallite size values of pristine and Al-doped CuO thin films. All concentration (%) Average Cristalite Size (nm) 0 21.82 0.2 20.61 0.5 20.07 1.0 28.52 2.0 22.40
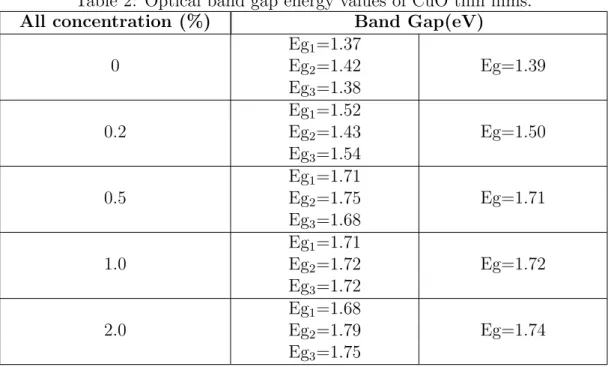
Table 2: Optical band gap energy values of CuO thin films.
All concentration (%) Band Gap(eV)
0 Eg1=1.37 Eg=1.39 Eg2=1.42 Eg3=1.38 0.2 Eg1=1.52 Eg=1.50 Eg2=1.43 Eg3=1.54 0.5 Eg1=1.71 Eg=1.71 Eg2=1.75 Eg3=1.68 1.0 Eg1=1.71 Eg=1.72 Eg2=1.72 Eg3=1.72 2.0 Eg1=1.68 Eg=1.74 Eg2=1.79 Eg3=1.75
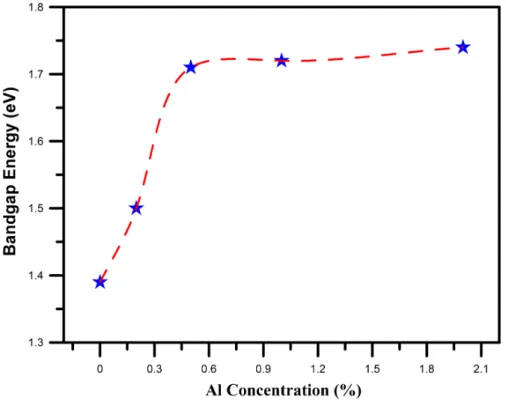
band gap energies of the samples, a THERMO 10S UV-vis. spectrophotometer was used in the room temperature. Estimated optical band gap energy values of all the CuO samples were given in Table 2. The variation of optical band gap en-ergies of CuO samples as a function of Al-doping content was plotted in Figure 3. These changes in optical band gap energy values due to Al-doping concentration were also reported in the literature [18]. It is seen that the optical band gap values of the samples were increased with increasing Al concentrations. This band gap widening may be due to the change of crystallite size of nanostructured thin film materials. Moreover, the change in the optical band gap in thin film materials can be clarified on the based on quantum size effect [19]. Obtained optical band gap results confirmed the Al concentration plays a vital role in tuning the band gap of the grown nanostructured materials.
Figure 2: SEM images of pristine and Al-doped CuO films.
Conclusions
Pristine and Al doped CuO thin films were successfully deposited on soda-lime microscope glass substrate by SILAR method. The effect of Al-doping concentra-tions in the growth solution on crystal structure, morphology and optical band gap energy properties of CuO thin films was investigated. The main physical proper-ties of the samples were affected considerably by Al content. Especially, UV–vis. measurements exhibited that the optical properties of CuO films adjusted as a con-sequence of Al-doping percentage. Hence, Al-doped CuO film is an encouraging material for sustainable energy materials such as solar cells.
Figure 3: Optical band gap energy values of pristine and Al-doped CuO samples as a function of aluminium concentration.
Acknowledgements:
This work is financially supported by Scientific Research Projects Commission of the Mustafa Kemal University (Project No: 9425).
References
[1] Yıldırım M.A., ”Characterization of ZnO and CdO Thin Films by SILAR Tech-nique and Use in Sandwich Structures”, Atat¨urk University, Graduate School of Natural and Applied Sciences, Phd Dissertation, Erzurum, 2010.
[2] Jafari H., Sadeghzadeh S., Rabbani M., Rahimi R., ”Effect of Nb on the struc-tural, optical and photocatalytic properties of Al-doped ZnO thin films fabri-cated by the sol-gel method”, Ceram. Int., 44, 20170-20177, 2018.
[3] Taner A., ”Production of ZnO Semiconductor Film by SILAR Method and In-vestigation of Some Physical Properties”, Anadolu University, Graduate School of Natural and Applied Sciences, Master’s Thesis, Eskisehir, 2010.
[4] Aydin R., Sahin B., ”The role of Triton X-100 as a surfactant on the CdO nanostructures grown by the SILAR method”, Journal of Alloys and Com-pounds, 705”, 9-13, 2017.
[5] Amlouk A., Boubaker K., Bouhafs M., Amlouk M., ”Optimization of transpar-ent conducting oxide ZnO compound thickness in terms of four alloys thermo-physical performance aggregates”, J. Alloys Compd., 509, 3661–3666, 2011. [6] Mageshwari K., Sathyamoorthy R., ”Physical properties of nanocrystalline
CuOthin films prepared by the SILAR method”, Mater. Sci. Semicond. Pro-cess., 16, 337–343, 2013.
[7] Sahin B., Kaya T., ”Highly improved hydration level sensing properties of cop-per oxide films with sodium and potassium doping”, Applied Surface Science, 362, 532–537, 2016.
[8] G¨urb¨uz E., Sahin B., ”Zn-doping to improve the hydration level sensing per-formance of CuO films”, Applied Physics A, 124, 1-9, 2018.
[9] Jin Z., Murakami M., Fukumura T., Matsumoto Y., Ohtomo A., Kawasaki M., Koinuma H., ”Combinatorial laser MBE synthesis of 3d ion doped epitaxial ZnO thin films”, J. Cryst. Growth, 215, 55–58, 2000.
[10] Saha B., Thapa R., Chattopadhyay K.K., ”Wide range tuning of electrical conductivity of RF sputtered CdO thin films through oxygen partial pressure variation”, Sol. Energy Mater. Sol. Cells, 92, 1077–1080, 2008.
[11] Masuko K, Ashida A., Yoshimura T., Fujimura N., ”Influence of antiferromag-netic exchange interaction on magantiferromag-netic properties of ZnMnO thin films grown pseudomorphically on ZnO (0001) single-crystal substrates”, J. Appl. Phys., 103, 043714, 2008.
[12] Yang M., Guo Z.X., Qiu K.H., Long J.P., Yin G.F., Guan D.G., Liu S.T., Zhou S.J., ”Synthesis and characterization of Mn-doped ZnO column arrays”, Appl. Surf. Sci., 256, 4201–4205, 2010.
[13] Lu H.B., Liao L., Li H., Tian Y., Wang D.F., Li J.C., Fu Q., Zhu B.P., Wu Y., ”Fabrication of CdO nanotubes via simple thermal evaporation”, Mater. Lett., 62, 3928–3930, 2008.
[14] Akaltun Y., Cayır T., ”Fabrication and characterization of NiO thin filmspre-pared by SILAR Method”, J. Alloys Compd., 625, 144-148, 2015.
[15] Soltabayev B., Yildirim M.A., Ate¸s A., Acar S., ”The effect of indium dop-ing concentration on structural, morphological and gas sensdop-ing properties of IZO thin films deposited SILAR method”, Materıals Scıence in Semıconductor Processıng, vol.101, pp.28-36, 2019.
[16] Bayram O., Guney H., Ertargin M. E., Igman E., Simsek O., ”Effect of doping concentration on the structural and optical properties of nanostructured Cu-doped Mn3O4 films obtained by SILAR technique”, Applied Physics A, 124, 606, 2018.
[17] Eskandari A., Jamali-Sheini F., ”Sonochemical synthesis of Cu-doped CdO nanostructures and investigation of their physical properties”, Mater. Sci. Semi-cond. Process., 74, 210-217, 2018.
[18] Al Ghamdi A.A., Al Hartomy O.A., El Okr M., Nawar A.M., El Gazzar S., El Tantawy F., Yakuphanoglu F., ”Semiconducting properties of Al doped ZnO thin films”, Spectrochimica Acta Part A: Molecular and Biomolecular Spectroscopy, 131, 512-517, 2014.
[19] Sahin B., ”Physical properties of nanostructured CdO films from alkaline baths containing saccharin as additive”, Sci. World J., Article ID 172052, 1-5, 2013.
Microplastic Accumulation in Rainbow Trout
(On-corhynchus Mykiss)
Samaneh Karbalaei
1, Parichehr Hanachi
2, Tony R. Walker
31 [email protected], Department of Biotechnology, Faculty of Biological
Science, Alzahra University, Iran
2 [email protected], Department of Biotechnology, Faculty of Biological Science,
Alzahra University, Iran
3 [email protected], School for Resource and Environmental Studies, Dalhousie
University, Canada
Abstract
The ubiquitous presence and persistency of microplastic contamination in aquatic ecosystems are considered a growing problem. Ingestion of microplastics has been reported in over 2000 aquatic organisms. The aim of this study was to investigate accumulation of polystyrene (PS) microplastics in gill and gastrointestinal tracts of rainbow trout (Oncorhynchus Mykiss). Virgin PS (30 or 300 µg/L) were exposed to fish for 14 days. Particles were analysed using micro-Raman spectroscopy. A total of 32 microplastics were found in both gill and gastrointestinal tract of fish. Under exposure to PS microplastics, however, accumulation of microplastics in the gill and gastrointestinal tract of fish increased with increasing microplastic concentra-tions. In both treatments, the concentration of PS microplastics was higher in gill compared to gastrointestinal tract. The results indicate the ingestion and accumu-lation of microplastics in tissues of fish should be considered in environmental risk assessment. This study also suggests that using O. Mykiss would be a promising indicator species for monitoring environmental contaminants such as microplastics.
Keywords: microplastics, accumulation, rainbow trout (Oncorhynchus Mykiss)
Introduction
Plastics are synthetic organic polymers, which are derived from the polymerisation of monomers extracted from oil or gas [1]. A recent comprehensive report on the total global production of plastics in the last fifty years showed the significant in-crease from 1.7 million tonnes in the 1950s to 335 million tonnes in 2016 [2]. The National Oceanic and Atmospheric Administration (NOAA) now defines the term microplastics as tiny ubiquitous plastic particles ¡5 mm in diameter [3]. Microplas-tics have been known as emerging marine pollutants of significant concern, due
to their persistence, ubiquity and toxic potential [4]. Primary microplastics come from synthetic polymer particles, which are usually contained in facial cleaners, cosmetic products, synthetic clothing, toothpaste, paints, coatings and air-blasting media. Secondary microplastics arise from the abiotic breakdown of larger plastic debris discarded in the environment due to abrasive wave action, UV radiation and abrasion with sand [5].
Recently microplastics have been globally detected in ocean waters, sediments, coastal areas and even in the freshwater systems [6,7]. Previous studies have re-ported that microplastics can be ingested by various aquatic organisms [5,8,9]. For example, a recent study showed that occurrence of microplastic ingestion in gas-trointestinal tract of three commercial fish species: the sea bass (Dicentrarchus labrax ), seabream (Diplodus vulgaris) and flounder (Platichthys flesus) from the Mondego estuary (Portugal). Results indicated a total of 157 particles were ex-tracted from 38% of total fish, with 1.67 ± 0.27 (SD) microplastics per fish [10]. Another study reported the uptake and tissue accumulation of 23 polystyrene (PS) microplastics in zebrafish (Danio rerio) were detected. The results showed that after seven days of exposure, 5 µm diameter microplastics accumulated in fish gill, liver, and gut, while 20 µm diameter microplastics only accumulated in fish gill and gut [8].
An emerging area of concern related to microplastics is that they can also enter the human food chain through ingestion of seafood and terrestrial food products causing potential human health impacts [11]. Presence of microplastics in gut and tissues of aquatic species including some commercially important bivalves [12], fish [13], shrimps [14], and oysters [15] is well documented. Consumption of microplas-tics contaminated foods is a potential source of human microplasmicroplas-tics intake. Toxic chemical additives in the plastic which are a palpable concern for human health include phthalates, bisphenol A (BPA), brominated flame retardants (BFR), tri-closan, bisphenone, and organotins [16].
The aim of this study was to investigate the PS microplastic accumulation in gill and gastrointestinal tracts of rainbow trout (Oncorhynchus Mykiss). O. Mykiss were selected in this study because they are one of the most economically important fish species utilized for freshwater aquaculture [17].
Materials and methods
Experimental design
Healthy O. Mykiss (mean weight ± SD: 32.11 ± 8.10 g, mean total length: 13.21 ± 2.24 cm) were purchased from a trout farm in Karaj, Iran and transported to the faculty of Fisheries, Tehran University, Iran (see Figure 1). The O. Mykiss were maintained in 2000 L fiberglass tank in culture water (well-aerated water for two weeks before the experiment. Fish were fed ad libitum once a day with a commercial pellet diet (Kimiyagaran-e-Taghziyeh). During the acclimation, the culture water in the tank was refreshed every 48 h.
each tank containing 5 fish. There were three experimental groups: control group (culture water alone); PS microplastic (30 µg/L), and PS microplastic (300 µg/L). Selected microplastic concentrations in this study are within or below concentra-tions employed by earlier studies on effects of microplastics on fish [5,18]. Test solutions for microplastics groups was prepared by adding microplastics stock so-lution to the culture water and the microplastics final concentration in the test solution were 30 µg/L and 300 µg/L. The exposure experiment lasted for 14 days. During the experiment, the test solution in each tank was refreshed every 24 h. All other conditions remained identical to those during acclimation. All tanks were continuously aerated by two airstones to maintain dispersion of particles in water. Feeding ceased 18 h before end of the exposure period. After a 14-day exposure, fish were euthanized with an overdose of clove oil. Then, gill and gastrointestinal tract were quickly removed and retained in aluminum foil.
Figure 1: Rainbow trout (Oncorhynchus Mykiss) used in this study.
Microplastic extraction
Microplastics in gill and gastrointestinal tracts of fish were isolated according to methods described by Karami (2017)[18]. Briefly, 200 mL (1:10 w/v) of KOH (10% w/v) was added to each bottle containing excised organs and gills and the bottles were incubated at 40 °C for 72 h. The digestates were then vacuum filtered through 149 µm filter membrane. To separate the potential microplastics from the digestion resistant materials, the 149 µm filter membranes were soaked in 10-15 mL NaI solution (4.4 M, 1.5 g/mL). Next, they were sonicated at 50 Hz for 5 min, agitated on an orbital shaker at 200 rpm for 5 min, and finally centrifuged at 500Ö g for 2 min. The supernatant containing microplastics were then filtered through 8 µm filter membrane. The final stage was performed once more to ensure total extraction of microplastics.
Visual characterization
Visual inspection of the filter membranes was conducted using Motic SMZ-140 Stereomicroscope (Motic, China). Particles resembling microplastics were selected according to their morphology such as color, shape, and size. Raman spectra were from 50 to 3500 1/cm and the wavelength of incident laser was 532 nm was used to identified PS microplastics (Figure 2).
Figure 2: Raman spectra of polystyrene.
Statistical analysis
Prior to analysis, all data were checked for normality (Shapiro-Wilks test). Data were analysed by one-way ANOVA. If a one-way ANOVA detected significant differ-ences (p < 0.05), a Tukey’s post hoc test was performed to identify the differdiffer-ences among treatments.
Results
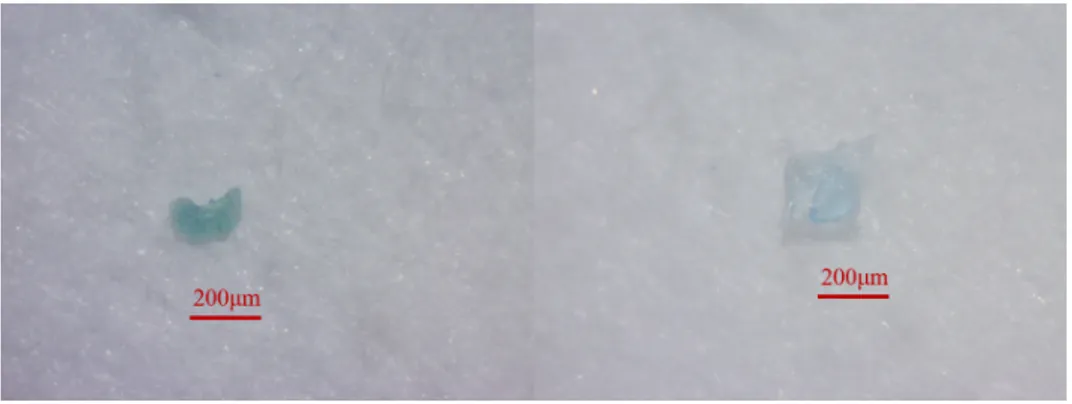
No mortalities occurred during exposure and fish in all treatments appeared healthy and actively feeding throughout the experiment. In general, 39 particles were found in both gill and gastrointestinal tract of fish which suspected to be microplastics based on their morphology (shape and color) under stereomicroscope. However, a total of 32 microplastics were found in both gill and gastrointestinal tract of fish according to Raman analysis. Figure 3 are some of the captured images of extracted PS microplastics particles. In both treatments, concentrations of PS microplastics was higher in gill compared to gastrointestinal tract. As such accumulation of microplastics in gill and gastrointestinal tracts of fish increased with increasing microplastic concentrations during exposure to PS microplastics (Figure 4).
Figure 3: Microscopic images of isolated polystyrene particles from fish species.
Figure 4: polystyrene microplastic accumulation in the gill (G) and intestine (I) of rainbow trout (Oncorhynchus Mykiss).
Discussion
Mismanagement of plastic products has led to the ubiquitous occurrence of mi-croplastic particles in marine (0–1Ö104 items/m3) [19] and aquatic environments
(0–1Ö106 items/m3) [20]. Microplastics have also been reported in a wide
vari-ety of species, particularly mussels and fish used for human consumption. It was evident from these studies that microplastics can be transmitted through aquatic food chains, which leads to its biological accumulation. For example, it was found that bivalves (Mytilus edulis) and (Crassostrea gigas) accumulated microplastics on average 0.36 ± 0.07 particles g−1 (wet weight) and 0.47 ± 0.16 particles g−1, respectively in contaminated environments [21].
Several studies have observed microplastics in some non-marine food prod-ucts, such as canned sardine (1-3 plastic particles)[22] honey (40-660 items/kg honey)[23], sugars (32 ± 7 items/kg sugar)[24], fish meals (a total of 226 mi-croplastics in four brands)[25] beer (12-109 items/L beer)[24] and table salt (7-681
items/kg salts)[26,27]. Microplastics were also detected in fish from the Persian Gulf, which a total of 828 microplastics were detected in the guts (gastrointestinal tracts), skin, muscle, gills and liver of demersal and pelagic fish (Platycephalus in-dicus, Saurida tumbil, Sillago sihama, Cynoglossus abbreviatus) from five sites [28]. Therefore, food products may represent an important route of entry for microplas-tics into humans, although systematic quantitative data of microplasmicroplas-tics in human tissues have not been reported. In previous studies, uptake and accumulation of microplastics has already been described in aquatic organisms after exposure to microplastics in the laboratory [4,8,29] . The first site of particle uptake is on the gill surface, mediated by microvilli activity and endocytosis, and the microplas-tics are further uptaken into the stomach, intestine and digestive tubules via ciliae movement [29]. Another study suggested that adherence is a novel way for animals to accumulate microplastics beyond ingestion [4]. These show the dietary routes for human populations to be exposed to microplastics. Further studies are required to examine the effects of microplastics on different human tissues.
Concentrations of microplastic particles used in the present study are in keep-ing with reported levels in previous studies [5,18]. In this study, the accumulation of PS microplastics were observed in fish gills and gastrointestinal tract which significantly (p < 0.05) increased in the higher concentration (300 µg/L) of mi-croplastics. These results indicate the considerable capacity of O. Mykiss to ac-cumulate PS microplastics. Significant uptake and accumulation of microplastics were also reported in the gills, liver, and gut of D. rerio after 7 d of exposure to PS microplastics (5 µm) at 20 mg/L[30]. On the contrary, in exposed goldfish (Carassius auratus) to microplastics through food for 6 d with 50 microplastics particles per food pellet and found no evidence of accumulation of microplastics in the gastrointestinal tract or internal translocation to fish tissues post-exposure [31]. It may show inconsistent conclusions as possibly due to the different exposure designs among the studies. A recent study also used PS microplastics particles with two diameters (5 µm and 20 µm) to examine the tissue distribution, accumulation, and tissue-specific health risk of microplastics in mice, which the results showed that microplastics accumulated in liver, kidney and gut, with a tissue-accumulation kinetics and distribution pattern that was strongly depended on the microplastics particle size [32].
Conclusion
These results highlight the ingestion and accumulation of microplastics in gills and gastrointestinal tract of O. Mykiss, which could lead to perturbations in fish biological systems and should be considered in environmental risk assessment.
References
[1] Rios L., Moore C., Jones P.R., ”Persistent organic pollutants carried by syn-thetic polymers in the ocean environment”, Mar. Pollut. Bull., 54, 1230-1237,
2007.
[2] PlasticsEurope, ”Plastics - the Facts 2017: An analysis of European plastic production, demand and waste data”, 16, 2017.
[3] Arthur C., Baker J.E., Bamford H.A., ”Proceedings of the International Re-search Workshop on the Occurrence, Effects, and Fate of Microplastic Marine Debris”, Sci. Total Environ., 610, 635-640, 2009.
[4] Kolandhasamy P. , Su L., Li J., Qu X., Jabeen K., Shi H., ”Adherence of microplastics to soft tissue of mussels: A novel way to uptake microplastics beyond ingestion”, Sci. Total Environ. 610, 635-640, 2018.
[5] Wen B., Jin S.R., Chen Z.Z., Gao J.Z., Liu Y.N., Liu J.H., Feng X.S., ”Single and combined effects of microplastics and cadmium on the cadmium accumula-tion, antioxidant defence and innate immunity of the discus fish (Symphysodon aequifasciatus)”, Environ. Pollut. 243, 462-471, 2018.
[6] Fok L., Cheung P.K., ”Hong Kong at the Pearl River Estuary: a hotspot of microplastic pollution”, Mar. Pollut. Bull. 99, 112-118, 2015.
[7] Erni-Cassola G., Zadjelovic V., Gibson M.I., Christie-Oleza J.A., ”Distribu-tion of plastic polymer types in the marine environment; A meta-analysis”, J. Hazard. Mater. 369, 691-698, 2019.
[8] Lu Y., Zhang Y., Deng Y., Jiang W., Zhao Y., Geng J., Ding L., Ren H., ”Uptake and accumulation of polystyrene microplastics in zebrafish (Danio rerio) and toxic effects in liver”, Environ. Sci. Technol., 50, 4054-4060, 2016. [9] Set¨al¨a O., Fleming-Lehtinen V., Lehtiniemi M., ”Ingestion and transfer of
mi-croplastics in the planktonic food web”, Environ. Pollut., 185, 7783, 2014. [10] Bessa F., Barr´ıa P., Neto J.M., Frias J.P.G.L., Otero V., Sobral P., Marques
J.C., ”Occurrence of microplastics in commercial fish from a natural estuarine environment”, Mar. Pollut. Bull., 128, 575584, 2018.
[11] Karbalaei S., Hanachi P., Walker T.R., Cole M., ”Occurrence, sources, human health impacts and mitigation of microplastic pollution”, Environ. Sci. Pollut. Res., 25, 3604636063, 2018.
[12] Li J., Yang D., Li L., Jabeen K., Shi H., ”Microplastics in commercial bivalves from China”, Environ. Pollut., 207, 190–195, 2015.
[13] Rummel C.D., L¨oder M.G.J., Fricke N.F., Lang T., Griebeler E.M., Janke M., Gerdts G., ”Plastic ingestion by pelagic and demersal fish from the North Sea and Baltic Sea”, Mar. Pollut. Bull., 102, 134-141, 2016.
[14] Devriese L.I., van der Meulen M.D., Maes T., Bekaert K., Paul-Pont I., Fr`ere L., Robbens J., Vethaak A.D., ”Microplastic contamination in brown shrimp (Crangon crangon, Linnaeus 1758) from coastal waters of the Southern North Sea and Channel area”, Mar. Pollut. Bull, 98, 179-187, 2015.
[15] Green D.S., ”Effects of microplastics on European flat oysters”, Ostrea edulis and their associated benthic communities, Environ. Pollut., 216, 95-103, 2016. [16] Galloway T.S., ”Micro-and nano-plastics and human health”, Mar.
Anthro-pog. Litter, 343-366, 2015.
[17] Yarahmadi P., Miandare H., Fayaz S., Caipang C.M.A., ”Increased stocking density causes changes in expression of selected stress- and immune-related genes, humoral innate immune parameters and stress responses of rainbow trout (Oncorhynchus Mykiss)”, Fish Shellfish Immunol., 48, 43-53, 2016. [18] Karami A., Romano N., Galloway T., Hamzah H., ”Virgin microplastics cause
toxicity and modulate the impacts of phenanthrene on biomarker responses in African catfish (Clarias gariepinus)”, Environ. Res., 151, 58-70, 2016.
[19] Desforges J.P.W., Galbraith M., Dangerfield N., Ross P.S., ”Widespread dis-tribution of microplastics in subsurface seawater in the NE Pacific Ocean”, Mar. Pollut. Bull., 79, 94-99, 2014.
[20] Eerkes-Medrano D., Thompson R.C., Aldridge D.C., ”Microplastics in fresh-water systems: a review of the emerging threats, identification of knowledge gaps and prioritisation of research needs”, Water Res., 75, 63-82, 2015.
[21] Van Cauwenberghe L., Janssen C.R., ”Microplastics in bivalves cultured for human consumption”, Environ. Pollut., 193, 65-70, 2014.
[22] Karami A., Golieskardi A., Choo C.K., Larat V., Karbalaei S., Salamatinia B., ”Microplastic and mesoplastic contamination in canned sardines and sprats”, Sci. Total Environ., 612, 1380-1386, 2018.
[23] M¨uhlschlegel P., Hauk A., Walter U., Sieber R., ”Lack of evidence for mi-croplastic contamination in honey”, Food Addit. Contam. Part A., 34, 1982-1989, 2017.
[24] Bouwmeester H., Hollmann P.C.H., Peters R.J.B., ”Potential health impact of environmentally released micro-and nanoplastics in the human food production chain: experiences from nanotoxicology”, Environmental Science & Technology, 49, 8932-8947, 2015.
[25] Hanachi P., Karbalaei S., Walker T.R., Cole M., Hosseini S. V., ”Abundance and properties of microplastics found in commercial fish meal and cultured common carp (Cyprinus carpio)”, Environ. Sci. Pollut. Res., 2019.
[26] Karami A., Golieskardi A., Choo C.K., Larat V., Galloway T.S., Salamatinia B., “The presence of microplastics in commercial salts from different countries”, Sci. Rep., 7, 46173, 2017.
[27] Iniguez M.E., Conesa J.A., Fullana A., “Microplastics in Spanish Table Salt”, Sci. Rep., 7, 8620, 2017.
[28] Abbasi S., Soltani N., Keshavarzi B., Moore F., Turner A., Hassanaghaei M., “Microplastics in different tissues of fish and prawn from the Musa Estuary, Persian Gulf”, Chemosphere, 205, 80-87, 2018.
[29] Von Moos N., Burkhardt-Holm P., K¨ohler A., “Uptake and effects of mi-croplastics on cells and tissue of the blue mussel Mytilus edulis L. after an experimental exposure”, Environ. Sci. Technol., 46, 11327-11335, 2012.
[30] Lu Y., Zhang Y., Deng Y., Jiang W., Zhao Y., Geng J., Ding L., Ren H., “Uptake and Accumulation of Polystyrene Microplastics in Zebrafish (Danio rerio) and Toxic Effects in Liver”, Environ. Sci. Technol., 50, 4054-4060, 2016. [31] Grigorakis S., Mason, S.A., Drouillard K.G., “Determination of the gut re-tention of plastic microbeads and microfibers in goldfish (Carassius auratus)”, Chemosphere, U., 169, 233-238, 2017.
[32] Deng Y., Zhang Y., Lemos B., Ren H., “Tissue accumulation of microplastics in mice and biomarker responses suggest widespread health risks of exposure”, Scientific Reports, 7, 46687, 2017.
Occupational Health and Safety Study in Coal
Thermal Power Plant
Akide Cerci Ogmen
1, Ismail Ekmekci
21 [email protected], Program of Occupational Health and Safety, Istanbul
Commerce University, Istanbul, Turkey
2 [email protected], Engineering Faculty, Istanbul Commerce University,
Istanbul, Turkey
Abstract
The advancement of technology, the increase in population, the idea of domi-nating the world and the development of industry increase the speed of energy demand. Energy is an indispensable part of industrialization and daily life. The economic and social development of a country is the basic indicator of the need for energy. Energy, such as chemical, nuclear, mechanical (potential and kinetic), thermal, geothermal, hydraulic, solar, wind, and electrical energy, can be found in different ways at every stage of everyday life. In energy production in the world, non-renewable energy sources such as coal, natural gas and oil take the first place. This study focuses on the four year distribution of occupational accidents occurring in the coal thermal power plant. Thermal power plants are the largest industry in electricity production. In thermal power plants, accidents are caused by boiler, turbine, generator, operation and maintenance hazards. These data were collected by personnel interviews such as boiler section, turbine and generator section, coal and ash processing plant of workers working in different parts of thermal power plant. Analyzes were made on the basis of different variables. The distribution of accidents by age, educational status, according to the hours of the shift, days of the week, months and according to the injured regions of the body are shown. Ac-cording to these results, accidents are seen as preventable accidents. In addition, these accidents, as in other sectors, appear to be caused by lack of training and neglect of employees.
Keywords: Electrical Energy, Electricity Production, Coal Thermal Power Plant, Occupational Health and Safety, Occupational Accident, Accident Distri-butions, Non-renewable Energy Sources, Questionnaires, Personal interview
Introduction
Industrialization in the world and Turkey, on the one hand while ensuring pros-perity for mankind, but also brings dangers for humanity. Death and limb losses occur due to occupational accidents and occupational diseases. In terms of both employees and businesses, the concept of health and safety must first be adopted
and maintained [1]. As world states and international organizations are competing with each other in order to obtain energy resources, importance should be given to occupational health and safety issues in the energy sector.
The need for energy resources in the world is increasing day by day [2]. Energy is a mandatory production factor in production and is one of the key indicators of a country’s economic and social development potential. There is a linear relationship between energy consumption and social development and it is seen that energy consumption increases with economic growth and prosperity [3].
The most fundamental element of the economic and social development of coun-tries is energy, and those who manage the councoun-tries have to find and diversify the energy through uninterrupted, reliable, clean and cheap means [3, 4]. With the development of societies, there have been differences, changes and developments in the way in which the energy was obtained and the usage areas [5].
The resources obtained by different methods in economic terms are called en-ergy sources and are classified in different ways. Enen-ergy resources are generally clas-sified according to their use and convertibility. Energy sources are non-renewable or renewable according to their use; According to their convertibility, they are clas-sified as primary and secondary energy sources (Figure 1). Non-renewable energy sources are energy resources that are classified in two different ways as short-term depleted, fossil-welded and core-welded. Renewable energy sources; refers to the resources that can remain in a very long period and which can renew itself [3]. The fact that the energy does not any conversion or change is called the primary energy source. Primary energy sources are petroleum, coal, natural gas, nuclear, hydraulic, biomass, wave-tide, sun and wind. The energy obtained as a result of the conversion of primary energy is known as secondary energy. Electricity, gasoline, diesel, diesel, coke, secondary coal, petroleum coke, air gas and lique-fied petroleum gas (LPG) are among these types of energy sources [6]. Another type of classification, which is used frequently today, is the classification made by taking into account the characteristics of exhaustion or renewability at the end of the use of energy resources. According to this classification, non-decremental and inexhaustible energy sources are called renewable energy sources. Once used, energy sources that cannot renew themselves are known as non-renewable energy sources [6].
In this study, the importance of energy and energy sources are explained. What are the primary sources of energy in Turkey and what are the power generation percentages of primary energy sources (Table 1 and Figure 2 and 3). Finally, some concepts related to occupational health and safety are mentioned. The coal-fired thermal power plant was selected as the study area. Accidents that occurred between 2015 and 2018, the parts where they occurred, the reasons for realization and the days and months of the accident occurred are shown with graphs.
Primary Energy Situation in Turkey
According to the latest data in February 2019, 40% of our electricity production was made of coal, 16% of natural gas, 31% of hydraulic energy, 8% of wind energy,
Figure 1: Classification of energy sources.
1% of solar energy, 3% of geothermal energy and 1% was obtained from other sources.
Table 1: Primary energy resources consumed in Turkey (Source: The Chamber of Electrical Engineers of UCTEA [7]).
DISTRIBUTION OF ENERGY PRODUCTION BY SOURCES 28 February 2019 Data Natural Gas 3,564,381.58 LNG 0 Lignite 3,403,311.15 Stone coal 220,416 Asphaltite coal 159,951.98 Imported coal 5,325,844.49 Fuel oil 116,343.3 Diesel 0 Naphta 0 LPG 0 Waste heat 50,452.18 Biomass 232,037.45 Geothermal 659,529.49 Stream 3,125,045.16 Dams 5,020,812.94 Sun 9,807.58 Wind 1,868,266.63 TOTAL (MWh) 22,776,199.93
Figure 3: Turkey’s primary energy resources production rates (28 February 2019 Data).
From this point of view, the distribution of primary energy consumption ac-cording to sources seems to be the most highly renewable energy sources with natural gas(16%) and coal (40%). The rest seems to be in the form of hydraulic (31%) and other renewable energy (12%). Here, wind energy, solar energy, biomass energy and geothermal energy are considered as renewable energy sources.
Occupational Health and Safety Concepts and
Def-initions
Occupational Health and Safety
The concept of occupational health and safety is one of the most important issues in recent years. The core of the concept of occupational health and safety is the protection of employees against the risks they face from work and the work environment. There are two definitions about occupational health and safety [8].
Occupational Health: It is a branch of medicine established to keep the health of employees in the workplace at physical, mental and social levels, to keep working conditions and production equipment in term of health, to protect employees from harmful effects and to ensure harmony of work and employee. Occupational Safety: It is called a whole set of measures that must be taken to create a reliable working environment to prevent occupational accidents [1].
Accident: A sudden event that result in an undesired outcome such as property damage, bodily injury or death.
Occupational Accident: An incident that occurs during work or during the execution of the work, which causes death or makes the body integrity spiritually or physically disabled [9].
Injury: Physical damage to body tissues caused by an accident or by exposure to environmental stressors. This injury may lead to death and is then called a ”fatal accident” or may cause partial disability or lead to sick leave for a period of time.
Unsafe Conditions: Factors that disrupt work safety and make the work en-vironment dangerous are enen-vironment, machinery and materials. Factors such as failure to use machinery suitable for the work, unselected production system suit-able for the work, insufficient equipment, design flaws are unsafe conditions.
Insecure Behaviours: It is the situation that the worker endangers the job security due to some erroneous behaviours and attitudes. The level of education, level of experience and psychological status of the workers have an important role in making non-safety movements. Intensive working hours, not knowing and not implementing safety rules, not using proper protective equipment are known as unsafe behaviours. The use of low material safety equipment, maintenance work when machinery and equipment is in operation, unnecessary jokes, behaviours distracting the employee are considered unsafe movements.
Occupational Disease: Occupational disease can be defined as an disease, dis-ability or psychological breakdown situations that can be temporary or permanent due to the equipment, materials and environmental impacts of the employees [10].
Coal Thermal Power Plant
Thermal power plants are stream- powered structures. Thermal power plants are also known as Energy Recycling Plants. Thermal power plants are the structures that convert heat energy into electrical energy. In the plants, steam is generated by heating the water. The power of this steam is turned turbines and converted into electrical energy.
The number of thermal power plants installed and registered in Turkey is 42. These thermal plants use imported coal, lignite, asphaltite, coal and stone coal. Selected this thermal power plant is one of Turkey’s largest thermal power plants with high power MWe. With the electrical energy it produces, it can meet all electrical energy needs such as housing, industry, metro transportation, official apartment, environmental lighting needed in the daily life of hundreds of thousands of people.
Occupational Accidents and Causes in Coal-Fired
Thermal Power Plants
The distribution of work accidents according to various parameters is as follows (Table 2-9 and Figure 5-11).
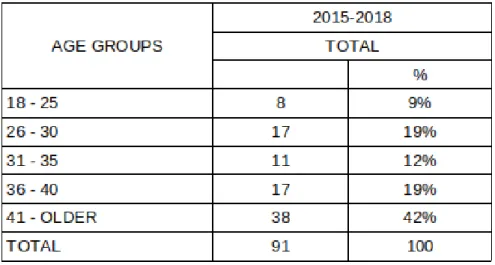
When the accidents occurred according to age groups are examined; 38 acci-dents occurred in employees aged 41 and over. This ratio is 42%. Research shows that individuals are exposed to loss of physical and cognitive abilities along with
Table 2: Distribution of occupational accident by age.
Figure 4: Distribution of occupational accident by age (2015-2018).
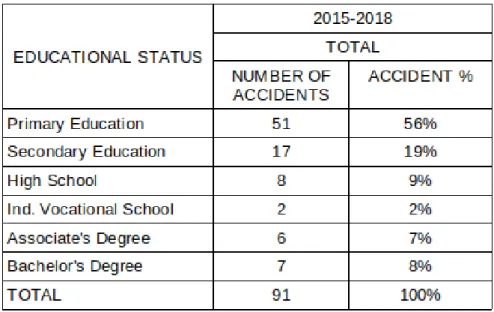
ageing. There is a non-negligible relationship between employees’ age and perfor-mance, working power, comprehension and mobility, reflexes. The muscle strength of the people reaches the highest level in the 20-30 age period and gradually de-creases after this age period. With age, the ability of the employees to think, perceive, react, learn, solve the problems in functional terms is decreasing. These talent regressions may adversely affect employee productivity and safe behaviour. 51,56% of those who had work accidents were in the form of primary school, 17,19% in middle school, 9% in high school or higher education. The occupational accident rate is low due to the fact that the industrial vocational high school
grad-Table 3: Distribution of occupational accident according to educational status.
uates are qualified personnel trained in the sector. Professional technical training given at work place, occupational health and safety trainings provided in the work place, enable the worker to improve himself or herself and become professional.
Figure 5: Distribution of occupational accident according to educational status (2015-2018)
Professionalization will reduce the risk of accidents and will contribute to the product and service to be produced, to save time and waste and to contribute to both the work place and the country’s economy and to the individual development.
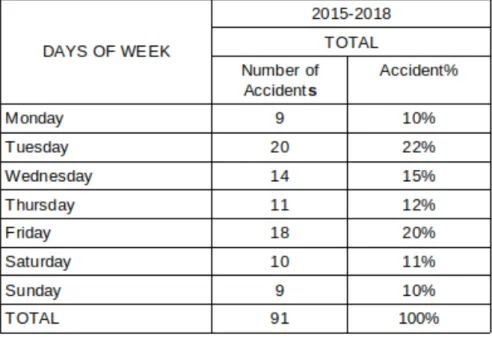
Table 4: Distribution of occupational accident By days Of the week (2015-2018).
After evaluating the data at Figure 6, it can be seen that most of the accidents took place on Tuesday. Figure 7 shows the distribution of accidents occurring in the enterprise by shifts. A total of 91 accidents occurred between 2015 and 2018. According to the data, employees had a work accident during the first three hours of their work. A total of 32 occupational accidents occurred. The data published in the social security institution showed that employees had an accident in the first three hours. When the causes of the accident distribution were investigated, it was concluded that the work intensity was higher in the 1st and 2nd shifts and all maintenance and repair works could be performed in these shifts.
Table 5: Distribution of occupational accidents by working hours (2015-2018).
Figure 7: Distribution of occupational accidents by working hours (2015-2018).
Between the years of 2015 and 2018, the distribution of occupational accidents varies between 3 and 12 employees. There is no significant difference in the number of occupational accidents except for the decrease in December. As seen in Figure 8, occupational accidents occurred mostly in March.
According to figure 9, occupational accidents occurred mostly in the mechanical maintenance department of external facilities. In the second row, there were 10 and 9 accidents between 2015 and 2018 in the boiler operation and boiler operation department.
Total of 87 accidents have been occurred in these period. Only 1 accidental injury has occurred in the internal organs. As a result of work accidents, the injured limbs are as shown in Figure 10. As physical force is used, most injuries often occur on the feet, ankles, hands, hands fingers and wrists. The causes of occupational accidents can be divided into various classes. When the accidents between 2015 and 2018 are examined, 35 accidents occurred from the personal
Table 8: Distribution of occupational accidents according to the injured areas of the body (2015-2018).
Figure 8: Distribution of occupational accidents by months (2015- 2018).
Figure 9: Distribution of occupational accidents by units (2015-2018).
errors of the employees. A high percentage of the remaining accidents were due to the selection and implementation of the wrong method for the conduct of the work.
Discussion and Conclusions
In this study, the occupational accidents occurred between the years of 2015 and 2018 in the coal thermal power plant were investigated. These accidents are pre-ventable accidents. As in other sectors, it is due to lack of training and neglect of employees. Most accidents can be considered as personal errors and the
oc-Figure 10: Occupational accidents according to injures areas of the body (2015-2018).
Figure 11: Distribution of occupational accidents by reason of accidents (2015-2018).
cupational health and safety deficiencies of company have a very small share in accidents. When workers gain experience over time, occupational accidents are greatly reduced if personal protective equipment is used regularly and properly, and job safety awareness is increased. The enterprise thinks that accidents can be solved by education. Therefore, in order to raise the level of awareness of its employees, it organizes occupational safety training and vocational training. The company tries to create a culture of occupational safety.
References
[1] Mente¸se G., ˙Ince E., ¨Ozcan B., ”Gemi ˙In¸sa Sanayinde ˙I¸s Sa˘glı˘gı ve G¨uvenli˘gi Bilincinin ˙Incelenmesi”, M¨uhendis ve Makina, 58, 53-78, 2017.
[2] Yılmaz M., The Energy Potential of Turkey and its Importance of Renew-able Energy Sources in terms of Electricity Production, Ankara ¨Universitesi C¸ evrebilimleri Dergisi, 4, 33-54, 2012.
[3] Ko¸c E., S¸enel M.C., ”D¨unyada ve T¨urkiye’de Enerji Durumu: Genel De˘gerlendirme”, M¨uhendis ve Makina, 54, 32-44, 2013.
[4] Pamir A.N., ”D¨unyada ve T¨urkiye’de Enerji, T¨urkiye’nin Enerji Kaynakları ve Enerji Politikaları”, Metalurji Dergisi, 2003, Last Access on 12.12.2019 from https://www.metalurji.org.tr/dergi/dergi134/d134_73100.pdf.
[5] Aslan N., Yamak T., ”T¨urkiye’nin Enerji Sorununun Alternatif Enerji Kay-nakları A¸cısından De˘gerlendirilmesi”, Marmara ¨Universitesi ˙I.˙I.B.F. Dergisi, 21, 53-76, 2006.
[6] Ko¸c E., Kaya K., ”Enerji Kaynakları- Yenilenebilir Enerji Durumu”, M¨uhendis ve Makina, 56, 36-47, 2015.
[7] www.emo.org.tr/ekler/c5aa4d5e03b92df ek.pdf.
[8] C¸ ASGEM, ”T¨urkiye’de ˙I¸s Sa˘glı˘gı ve G¨uvenli˘gi Algısı Ara¸stırma Raporu”, 58, 2017, ISBN: 978-975-455-276-8.
[9] ”˙I¸s G¨uvenli˘gi ve Sa˘glı˘gı Kanunu”, Last Access on 12.12.2019 from www. mevzuat.gov.tr/MevzuatMetin/1.5.6331.pdf.
[10] Arıtan A.E., Ataman M., ”Kaza Oranları Hesaplamalarıyla ˙I¸s Kazası Analizi”, AKU J. Sci. Eng., 17, 239-246, 2017.
Human Awareness and Ecological Footprint
Jasmina Heric
1, Dejan Zemljak
2, Boris Abersek
31 [email protected], University of Maribor, Faculty of Natural Science and
Mathematics, Maribor, Koroˇska cesta 160, Slovenia
2 [email protected], University of Maribor, Faculty of Natural Science and
Mathematics, Maribor, Koroˇska cesta 160, Slovenia
3 [email protected], University of Maribor, Faculty of Natural Science and
Mathematics, Maribor, Koroˇska cesta 160, Slovenia
Abstract
In the presented research, we will point out a view of young students on the cur-rent environmental situation. We have participated in Erasmus+ project Green Energy Skills for Youth (Green4U), where we met many young people from differ-ent countries. We will share our experiences and the insights gained through our participation in the project.
The first Academy was held in Slovenia, in the city of Maribor, where we hosted youth from Turkey. The next Academy took place in Germany, in Potsdam, where young people from Slovenia, Germany and Turkey took part. The last Academy was held in the Turkish town of K¨oyce˘giz. The main aim of Academy was to raise awareness among young people about climate change, environmental protection and green energy.
Young people initially perceived the participation in the project as fun only, but they quickly realized that there are many environmental problems for which we (humans in general) are truly responsible. We learned that we - young people - can greatly contribute to this change. In the article, we present in greater detail the experience and findings formed by participants in the project during their engagement in activities, presentations and seminars.
Introduction
The use of contemporary learning strategies, such as research- and problem-based learning connected to collaborative teaching/learning, and brain-based techniques based on information-communication technologies, have provided scholars from di-verse disciplines, for our research problem of ecological footprint, most notably from the fields of chemistry, biology, physics, philosophy, engineering, and technol-ogy, with an unusual opportunity to observe possible flaws in their own thinking and awareness [1].
In the process of education, which mostly points out the importance of acquir-ing knowledge and developacquir-ing cognitive competences, the question arises of what happens with the students’ social skills and their social competences, and whether
we can increase social competences gradually, step by step? Human beings are social beings. From our own research, as well as from the research conducted by many other researchers [2, 3, 4] it is obvious that with intensive individualization and differentiation of the teaching/learning process (one-on-one tutoring), there is a drastic decrease in social skills and social awareness, which is crucial in the area of ecology.
What can/must we do? As we have already mentioned, the recurrent theme of this research will be the ”ecological footprint”; and proprioception plays an important role in this story. What does proprioception really mean? Propriocep-tion could also be named self-percepPropriocep-tion of thought, or self-awareness of thought, i.e. thought, which is able to perceive its own movement, be aware of its own movement. With proprioception, in specific activities as part of a particular les-son (for example, a lesles-son about ecological footprint), the emotional intelligence of a person (Figure 1) also develops, which will change, step by step, the human historical memory, and add new elements to this historical memory on the level of intuitive thinking. We must therefore develop this awareness in every individual; we must ”change” or establish the specific way of thinking (creative, critical, and conscious thinking); and it is very important to begin this process with students of the youngest possible age. In the case of the ecological footprint problem, compe-tences must be developed step by step, which enable us to deal with the day-to-day needs of others, and which help raise the awareness that we have only one earth — a complex puzzle, for which everyone is responsible, and to which everyone can contribute their small (but important) piece. And all of this has been the main goal of the project Green4U [5].
In Figure 1, Self-Awareness refers to knowing one’s internal states, percep-tion, resources, and intuition; Self-Management refers to managing one’s internal states, impulses, and resources; Social Awareness refers to how people handle re-lationships, and to the awareness of others’ feelings, needs, and concerns; while Relationship Management is concerned with the skill or adeptness at inducing desirable responses in others.
Self-awareness and sustainability
”The Sustainable Development Goals are the blueprint to achieve a better and more sustainable future for all. They address the global challenges we face, including those related to poverty, inequality, climate, environmental degradation, prosperity, and peace and justice. The Goals interconnect and in order to leave no one behind, it is important that we achieve each Goal and target by 2030. We will point out only the area of environmental degradation connected with energetic policy” [6].
The principle of sustainable forms of energy is to meet the energy needs of the present time and at the same time not jeopardize the energy needs of the future generations. There are two basic principles of sustainable energy: cleaner methods of energy generation and energy saving in all areas.
Sustainable energy includes both energy production and heating, cooling and powering systems and machines. In the field of energy production, the terms
![Figure 1 indicates the TEM of 100 nm gold nano urchins in the literature [?].](https://thumb-eu.123doks.com/thumbv2/9libnet/5470107.105846/10.892.154.750.433.685/figure-indicates-tem-nm-gold-nano-urchins-literature.webp)
![Figure 2: Various shapes of the GNPs [8].](https://thumb-eu.123doks.com/thumbv2/9libnet/5470107.105846/11.892.221.687.125.388/figure-various-shapes-of-the-gnps.webp)