MIDDLE INCOME COUNTRIES
Çiydem ÇATAK,2 Elif NUROĞLU3 Abstract
This paper attempts to investigate the relationship between the growth of gross domestic product and innovation related activities. A panel data analysis is conducted on a sample of eight middle-income countries covering 5-year time period from 2012-2016. The major findings of the study show a significant positive impact of expenditure on education, graduates in science and engineering, knowledge intensive employment, scientific and technical articles, population and foreign direct investments on the growth of gross domestic product. Hence, we conclude that there is a strong relation between innovation-related activities and economic growth in middle-income countries. Therefore, we suggest that middle-income countries should focus more on R&D and innovation related activities to grow and change their income status to higher income levels.
Key Words: Economic Growth, Research and Development, Innovation, Middle-Income Countries JEL Classification: O11, O30, O32, O40
İNOVASYONUN BÜYÜMEYE ETKİSİ: ORTA GELİRLİ ÜLKELER İÇİN PANEL VERİ
ANALİZİ
Öz
Bu çalışmanın amacı, gayri safi yurtiçi hasılanın büyümesi ile inovasyona bağlı faaliyetler arasındaki ilişkiyi araştırmaktır. 2012-2016 yılları arasında 5 yıllık süreyi kapsayan sekiz orta gelirli ülkenin dahil edildiği bir örneklem üzerinde panel veri analizi yapılmıştır. Araştırmanın bulguları, eğitim harcamaları, fen ve mühendislik mezunları, bilgiye dayalı istihdam, bilimsel ve teknik makaleler, nüfus ve doğrudan yabancı yatırımların büyümeye pozitif etki ettiğini göstermektedir. Bu nedenle, orta gelirli ülkelerde inovasyon ile ilgili faaliyetler ve ekonomik büyüme arasında güçlü bir ilişki olduğu sonucuna varılmıştır. Orta gelirli ülkelerin, gelirlerini daha yüksek seviyelere çıkarabilmek için AR-GE ve inovasyona daha fazla odaklanmaları önerilmektedir.
Anahtar Kelimeler: Ekonomik Büyüme, AR-GE, İnovasyon, Orta Gelirli Ülkeler JEL Sınıflandırması: O11, O30, O32, O40
1This work has been fully supported by German Academic Exchange Service (DAAD)
2 PhD., Department of Business Administration, Faculty of Economics and Administrative Sciences, Turkish-German
University, [email protected] ORCID: 0000-0001-7501-5969
3 Assoc. Prof., Department of Economics, Faculty of Economics and Administrative Sciences, Turkish-German University,
1. Introduction
Explaining the factors of growth is an old task which has been making economists extremely busy. It could be injustice to name the oldest growth theories primitive, but a comprehensive literature review makes us believe that as the time goes on, more and more previously exogenous accepted factors were taken into the models and assumed to be endogenous. Technological progress is one of these factors, and it has now been accepted as being the frontrunner and the most effective determinant of economic growth (Romer, 1990: 71). Technological progress is considered one of the components of the production function due to many reasons, such as it leads to larger quantities of output for a given amount of capital and labor, it allows to produce better, new and a larger variety of products (Blanchard and Johnson, 2013). Kim (2011: 25-44) investigates the contribution of R&D stock on economic growth using R&D based Cobb-Douglas production function during the years 1976-2009. He finds that, the traditional production factors labor and capital contribute about 65% to economic growth. On the other hand, the contribution of overall R&D stock to economic growth is around 35%.
Any increase in the amount of factors of production has, under certain circumstances, a tendency to raise the output per worker produced, but at diminishing rates. Capital accumulation alone cannot guarantee sustained growth. However, if the mankind can combine all these factors of production with highly skilled workforce and technological knowledge, the production process and so the growth rate of the country will possibly experience higher returns and sustained growth. Hence, the most important question in growth theory is how to achieve technological progress (Blanchard and Jonhson, 2013). In the world, some countries try to catch-up the existing and ever growing technology, while developed countries do not want to lose their place on the top of the list. The competition around the world is tough and innovation is the key in order to achieve sustainable growth path (OECD, 2007).
Innovation is defined as the successful implementation of new ideas. These new ideas may be related to the production of a new product or somewhat improved product, service or process that continues to exist, in an environment where competition is high (Rajapathirana and Hui, 2018: 44). We believe that a competitive environment as well as an education system that promotes and encourages innovation and protects intellectual property rights is the most important determinant of the long-term success of countries. Countries that are able to innovate and turn their innovative activities into productivity gains grow faster. Our hypothesis is that as the middle income countries focus more on innovative activities, they are going to face higher returns to innovation and achieve sustainable growth rates. Therefore, we analyze the impact of research and development (R&D) and innovation related activities in eight middle income countries on their growth rates.
The plan of the paper is as follows. Section 2 provides literature review about the impact of R&D and innovation activities on economic growth. Section 3 informs the reader about our research model. Section 4 explains the econometric method used for the analysis. Section 5 contains information about our dataset and pre-tests conducted. Section 6 explains and discusses our results. In the last section, concluding remarks are provided.
2. Literature Review
Modern growth models aim to analyze the relation between technological change and growth. In addition to the classical factors of production, i.e., capital and labor, the role of human capital, savings and technology have been extensively examined by these models. The association between returns to innovation and growth has been an interesting topic for researchers as well. Most of these studies have shown that R & D activities are necessary for the economic growth and sustainable development of countries. For example, Romer (1990: 71-102) presents a neoclassical growth model with technological change, providing an endogenous explanation of technological change. The most interesting positive implication of his model is that an economy with a larger total stock of human capital will experience faster growth rates. One of the main conclusions of
this pioneering work are that the stock of human capital determines the rate of growth and that too little human capital is devoted to research in equilibrium. The model presented by Romer (1990: 71-102) resembles to the Solow (1956: 312-320) model but it suggests the endogenous technological change. Technological change paves the way for continued capital accumulation that together with technological change accounts for a larger part of the increase in output per hour worked. Hence, he suggests a model of endogenous nature rather than exogenous technological change, critically approached until 1990.
The growth rate of countries depends on their ability to produce complex and high-tech products by determining their gains from trade and income level. In the literature, many studies evaluate economic development of countries with their ability to produce complex products with better efficiency, rather than just specializing in a several groups of products (Hidalgo and Hausman, 2009). The authors suggest that to generate sustainable growth, a country should generate the conditions that would allow some degree of complexity in production. These conditions could be better prepared by increasing the quality of human resources and allowing them to innovate.
Production structure and exports of a country are the places where the fruits of R&D would be reaped, in terms of increasing productivity and increasing the share of more complex products in the exports structure. Çetin and Cincera (2015:82- 105) explore the relationship between R&D investments and export behavior in the EU15 countries. They find that both the volume and the decision of R&D investments and exports are mutually dependent, especially in the manufacturing sector. According to Felipe et al. (2012:36-68), the fate of countries is determined by their production structures and characteristics of the properties they export. The driving force of growth lies in the ability of firms to build new capabilities on their existing talents.
Governments play an important role in boosting innovation and providing an innovation-friendly environment. OECD (2013) argues that innovation-based growth is central to raise long-term living standards in a country, which relies on a range of assets, such as employee skills, organizational know-how, databases, design, brands and other forms of intellectual property. However, innovative ideas should be supported by complementary capital and human resources for their implementation and commercialization. Setting intellectual property rights, as well as subsidizing innovation-related activities are the duties of governments in order to encourage this process.
In the growth literature, many studies analyze the relation between R&D and growth directly. Coe and Helpman (1995:859) empirically examine the impact of R&D investments on productivity growth using data from 22 developed countries. They suggest that as long as a country is open to foreign trade, it benefits from R&D activities of foreign countries as well as from its own R&D expenditures, which returns to the country as an increase in productivity. In an expanded and revised version of this study, Coe et al. (2009:723- 741), analyzes the effect of existing institutional differences across countries on Total Factor Productivity. The greater the ease of doing business in a country and the higher the quality of higher education system, the greater the degree of utilization of that country from both its own R&D studies and the spillover effects of R&Ds done in other countries.
Another study that evaluates the influence of R&D activities on economic growth is conducted by Şahin (2015). He argues that expenditures on new product development are the main determinants of economic growth in both developed and developing countries. The countries that produce technologically advanced products have the ability to compete internationally and show progress in their production levels as well as in the quality of their products.
Innovation is a field in which public and private sectors need to work closely. The countries in which private sector involvement in R&D is higher are the ones who have advantage in R&D returns. Kokko et al. (2015) conduct a meta-analysis to investigate the link between R&D spending
and economic growth in the EU and the US. According to the authors, possible explanations for the US advantage might be higher private sector investment in R&D and stronger public-private sector linkages in the US.
Growth matters a lot for all countries in the world. However, it matters more for the middle-income countries that they urgently need to jump out of the middle middle-income status to high middle-income levels. Drysdale (2012) mentions about two problems of the countries that are in the middle income trap, they do not invest enough in their human resources and cannot adapt to changing conditions of the world, since they fail to do necessary reforms in their institutions to have a creative economy. According to this study, it is inevitable not being able to jump out of the middle income trap for some developing countries of Asia, including China, with so slow reform processes and weak human resources. Eichengreen et al.(2013) also argue that middle income countries can abstain from the middle income trap by accumulating human capital in the form of skills and ability to produce technologically sophisticated goods and services. According to Aslan (2014), to compete in the global markets, a middle-income country should raise the quality of its human resources and workers and speed up technological progress.
Yılmaz (2014) investigates the role of human capital and relevant policies to break out the middle income trap for Turkey. To escape from growth slowdown and to make a transition from resource accumulation led growth to productivity and innovation driven growth, he suggests that Turkey should focus on structural measures to improve educational attainment and its quality. “Skilled and high capability human capital” and “innovative and competitive production capacity” which is necessary for technology and innovation driven economic growth could only be achieved by improving the quality of human capital. Eichengreen et al. (2013) also support this idea by concluding that growth slowdowns are less likely in the countries where the population has a relatively high level of secondary and tertiary education and where high-technology products account for a relatively large share of exports. In this digitalization era, the importance of education and quality of human resources becomes even more severe when the manufacturing sectors face digital transformation (Kagermann et al., 2013).
Some studies focus on the relation between growth and R&D activities in particular countries. It is also possible to find much research about Turkey, a middle-income country. For example, Korkmaz (2010: 3320-3330) evaluates the relationship between R&D spending and GDP per capita in Turkey. He employs a Johansen co-integration method, and finds a positive relation between these variables in the long run. In another study, Altın and Kaya (2009:251-259) test the association between R&D expenditures and economic growth in Turkey with Vector Error Correction model. They conclude that there is a causality relationship running from R&D expenditures to economic growth in the long-run. Therefore, they recommend that it is necessary to focus on long-term R&D investments instead of thinking about short-term solutions. In a similar study, Bozkurt (2015: 188-198) investigates the long-run relationship between R&D expenditure and economic growth in Turkey. The findings indicate that the growth rate of GDP will increase by 0.26 % if the shares of R&D in GDP increase by 1%. Akçalı and Sismanoglu (2015: 768) analyze the impact of R&D expenditures on economic growth in 19 developing and developed countries for the period 1990-2013 using Swamy’s random coefficients model. They find that although the impact of R&D expenditures on economic growth is always positive, it shows variations across countries. The better a country’s initial development level is, the higher the returns to R&D is attained. It appears that accumulation of intellectual capital and know-how plays an important role on this.
Ulku (2004) employs various panel data techniques and applies patent and R&D data for 20 OECD and 10 non-OECD countries for the period 1981–97. Her results suggest a positive relationship between per capita GDP and innovation in both OECD and non-OECD countries, while the effect of R&D stock on innovation is only significant in the OECD countries with large markets. The findings of this paper show that only the large market OECD countries are able to increase
their innovation by investing in R&D, and the remaining ones appear to promote their innovation by using the know-how of other OECD countries.
According to Griffith (2000), there are various policies to increase firms’ motivations to invest in R&D. Some of these policies directly affect R&D activities such as government direct funding of R&D labs, universities or business, investing in human capital formation, patent protection laws and R&D tax credits. It may not be enough just to increase the share of R&D spending in GDP, but it is also necessary to have gradual improvements in the innovation system, by focusing more on areas like private sector R&D and public-private sector partnerships in innovative activities (Kokko et al. 2015).
After conducting a comprehensive literature review, it has been both theoretically and empirically clear that there is a positive relationship between R&D and economic growth. The next question now is how to support these innovative activities in a country. When we talk about R&D or innovation, the spectrum is very large. Therefore, we find the components of R&D in the literature and form a model through which R&D activities are comprehensively explained. We explain innovative activities with the variables of the expenditure on education, graduates in science and engineering, knowledge intensive employment, scientific and technical articles, creative goods and services, information and communication technologies, computer software spending, population and foreign direct investment. It is the originality of our paper that R&D is explained with these specific variables.
3. Research Model
In this study, the growth of gross domestic product is chosen as the dependent variable. Expenditure on education, graduates in science and engineering, knowledge intensive employment, scientific and technical articles, creative goods and services, information and communication technologies, computer software spending, population and foreign direct investment are independent variables chosen to determine the relationship between R&D, innovation and growth of gross domestic product. Panel data analysis is conducted to investigate the impact of R&D and innovation activities on gross domestic product in a sample of eight middle income countries over the period 2012-2016 (see Eq. 1).
𝐺𝐷𝑃𝐺𝑅𝑖,𝑡 = 𝛽0+𝛽1𝐸𝑋𝑃𝐸𝑁𝑖,𝑡+ 𝛽2𝐺𝑆𝐸𝑖,𝑡+ 𝛽3𝐾𝐼𝐸𝑖,𝑡+𝛽4𝑆𝑇𝐴𝑖,𝑡+ 𝛽5𝐶𝐺𝑆𝑖,𝑡+ 𝛽6𝐼𝐶𝑇𝑖,𝑡+
+𝛽7𝐶𝑆𝑆𝑖,𝑡+ +𝛽8𝑙𝑛𝑃𝑂𝑃𝑖,𝑡+𝛽9𝑙𝑛𝐹𝐷𝐼𝑖,𝑡+ 𝜀𝑖,𝑡 (1)
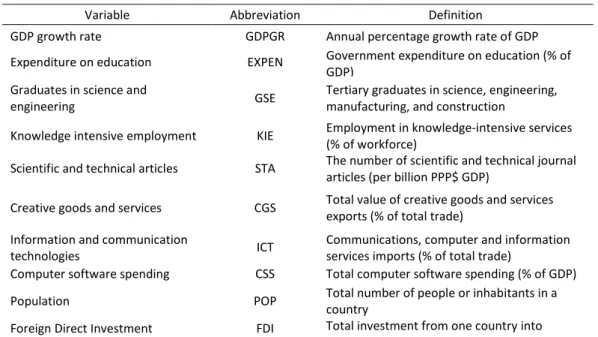
Table 1 displays the list of dependent and explanatory variables in Equation 1 together with their definitions and abbreviations.
The relation between expenditure for education and economic growth has been an interesting research topic for years. Classical and neoclassical economists such as Adam Smith, Solow and Lucas have emphasized the contribution of education to economic growth, but the main theoretical approaches to this issue have been developed by neoclassical growth models of Solow (1956: 312-320) and Romer (1990). Apart from these theories, the relationship between education and economic growth has also been the subject of many empirical studies which have concluded that there is a positive relationship between increase in resources allocated to education and economic growth (Mercan and Sezer, 2014: 925-930). Barro et al. (2010) use schooling data to investigate the relationship between education and income and find that the schooling of workers has a significantly positive impact on the level of income. Chatterji (1997: 349) widens the scope of education from primary and secondary education to tertiary education and suggests that tertiary education may well have an important role to play in the growth process. Çakmak and Gümüş (2005:59-72) research the way in which human capital and economic growth are connected. They have concluded that there is a positive relationship between these variables in the long run for Turkish economy.
Table 1: Summary of the Dependent and Explanatory Variables, Abbreviations and Definitions
Variable Abbreviation Definition
GDP growth rate GDPGR Annual percentage growth rate of GDP Expenditure on education EXPEN Government expenditure on education (% of
GDP) Graduates in science and
engineering GSE
Tertiary graduates in science, engineering, manufacturing, and construction
Knowledge intensive employment KIE Employment in knowledge-intensive services (% of workforce)
Scientific and technical articles STA The number of scientific and technical journal articles (per billion PPP$ GDP)
Creative goods and services CGS Total value of creative goods and services exports (% of total trade)
Information and communication
technologies ICT
Communications, computer and information services imports (% of total trade)
Computer software spending CSS Total computer software spending (% of GDP) Population POP Total number of people or inhabitants in a
country
Foreign Direct Investment FDI Total investment from one country into another
Source: Authors
The contribution of the number of graduates of science and engineering to economic growth can be explained with the fact that these people play an important role in creating new knowledge in the production of goods and services. In fact, some countries attract highly educated engineers and scientists to their countries as a means of achieving economic growth. For example, according to the study done by Peri and Shih (2013), Canada follows such a policy for many years and tries to attract foreign scientists and engineers to conduct research in Canada.
The third explanatory variable, knowledge intensive employment, represents employment in knowledge-intensive business services. According to the European Commission Report (2012), knowledge-intensive business services are firms that supply knowledge-intensive goods and high quality services to other firms. High quality services increasingly determine the direction of innovation, and the industry is oriented towards their needs.
There is not much research in the literature about the relationship between scientific and technical articles and economic growth. However, if these articles are to affect technological developments in a positive way, and are transformed into innovative products, it is assumed that there should be a meaningful relationship between these two variables.
Creative goods and services are arts and craft, books, films, paintings, festivals, songs, designs, digital animation and video games. Creative economy generates income through exports and intellectual property rights, and creates new jobs. These industries are very lively and dynamic sectors of the global economy. Increasing demographics, better access to the communication technologies and shifts to the new lifestyles lead to increases in trade volumes in these sectors. It is very obvious that these industries have a potential to grow much more in the future. The total value of exports of creative goods is increased by 47 per cent in 2012, while the value of imports of creative goods rose by 56 per cent in the same period.
Information and Communication Technologies (ICT) and faster information processing enable firms to utilize new business models, make the production and information processing cheaper and easily accessible, and so enhance the production capacity of the firms while reducing their costs. When firms become more efficient, their competitive power increases as well. Kretschmer (2012) provides an overview of the empirical literature on ICT and productivity. Overall, the empirical studies demonstrate that the productivity impact of ICT is not only significant and
positive, but it also increasing over time. Timmer and van Ark (2005: 693-716) analyze the effects of information and communication technologies (ICT) on the aggregate labor productivity growth in the European Union and the United States. According to their results, these two effects almost fully explain the leading position of the US in the labor productivity growth over the EU during the period 1995–2001. In this respect, we think that ICT imports of the middle-income countries could be one determinant of GDP growth.
Computer Software spending is considered as one of the pillars of information technology (IT). Gust and Marquez (2004: 33-58) analyze the relationship between information technology (IT) and productivity growth. To explain productivity divergence among countries, they use panel data from 1992 to 1999 for 13 industrial countries, and find that productivity divergence is driven partly by the differences both in the production and adoption of information technologies. We think that as one of the pillars of IT, total computer software spending of countries as a percentage of their income should have an impact on economic growth by leading to increases in productivity and through job creation effects.
The relation between population and economic growth has been a controversial issue in the growth literature. In the famous Solow model, it is claimed that the higher the rate of population growth, the poorer the country (Solow, 1956: 312-320). Mankiw et al. (1992: 407-437) support this idea. According to Ada and Acaroğlu (2014), fertility rate affects the income per capita negatively. On the other hand, Lenka and Sharma (2014) conduct a generalized least square (GLS) estimation and show that population is positively related with the growth rate of the countries in their sample along with education and savings. Bucci et al. (2018) explains this controversy in the literature. They suggest that at the country level, population growth might be either positively or negatively related to the economic growth. They explain the impact of the population growth on the growth of real per-capita income with two opposing effects. The first one is the dilution-effect of population growth on per-capita skill formation. This is always negative. The second one, the ideas-effect, is the effect that the population growth may have on innovation rate. This effect is positive. The net effect of population on economic growth is the sum of these two effects.
Investment is another key determinant of economic growth. There are several measures of investment such as gross capital formation, domestic investments, and foreign direct investments. Lenka and Sharma (2013) use inflows of FDI to see the relationship between investments and GDP growth, and find that they are positively related to each other. They conclude that FDI is an important source of capital, which complements domestic private investments associated with new job opportunities and enhancement of technology transfer. Bond et al. (2001) estimate cross-country growth regressions and find that the investment rate has a significant positive impact on the steady state level of per capita GDP. Dewan and Hussein (2001) analyze the impact of investment on the long run economic growth, and find a significant positive effect.
4. Econometric Methodology
This study uses panel data analysis to examine the relation between R&D, innovation activities, and economic growth through the combination of time series and cross-sectional analysis. In a panel data analysis, which has a hierarchical structure, multiple observations from a group of individuals, companies or countries are repeatedly considered at different time levels.
There are two types of statistical methods to analyze panel data sets. These are fixed effects and random effects models. The fixed effects model assumes that the unobserved variables can correlate with all observed variables. Fixed effects models control the effects of time-invariant variables with time-invariant effects. The random effects model, on the other hand, assumes that the unobserved variables do not correlate with the observed variables (Williams, 2018).
To decide whether the unobserved effects should be treated as a random effect or as a fixed effect, Hausman test is performed. According to the Hausman test results, random effects panel
data analysis is performed in which the individual-specific effect is a random variable and not correlated with the explanatory variables (Schmidheiny, 2016).
5. Data and Analysis
The data used in this study is obtained from the Global Innovation Index (GII) which contains the annual ranking of countries in terms of their success in innovation. The data set covers a time interval of 5 years over the 2012- 2016 period for eight middle income countries, namely Turkey, Bulgaria, Hungary, Poland, Mexico, Brazil, Malaysia and Romania. The reason for choosing this period is that the data of the Global Innovation Index is available only during this time interval. In addition, the middle-income countries in the sample are selected according to their GDP per capita values, which are very close to each other and between 15000-26500 US Dollars at PPP. Table 2 shows the general rankings of these countries according to their per capita gross domestic product.
Global innovation index rank is the simple average of the Innovation Input and Output Sub-Index scores of these countries. Innovation Input Sub-Sub-Index includes five input pillars related to the elements of a national economy that make it possible for countries to engage in innovative activities. These five input pillars are: institutions, human capital and research, infrastructure, market sophistication and business sophistication. On the other hand, Innovation Output Sub- Index makes information available for use about outputs that are based on innovative activities within the economy. There are two output pillars: knowledge and technology outputs, and creative outputs. Innovation Efficiency Ratio that indicates how much output a given country gets for its inputs is the ratio of the Output Sub-Index score over the Input Sub-Index score (GII, 2016). As shown in Table 2, Brazil and Mexico have the highest values for innovation. On the other hand, Hungary has the lowest GII rank. Compared to other countries, Turkey’s innovation efficiency ratio is the lowest among eight middle-income countries in our sample.
Table 2: Global Innovation Index for 2016
Country GII 2016 Rank-Overall Innovation Efficiency Ratio GDP per capita, PPP$
Turkey 42 13 20437.8US($) Bulgaria 38 16 19097.3US($) Hungary 33 17 26222.0US($) Poland 39 66 26455.3US($) Mexico 61 76 17534.4US($) Brazil 69 100 15614.5US($) Malaysia 35 59 26314.8US($) Romania 48 46 20786.9US($)
Source: Global Innovation Index Report, 2016
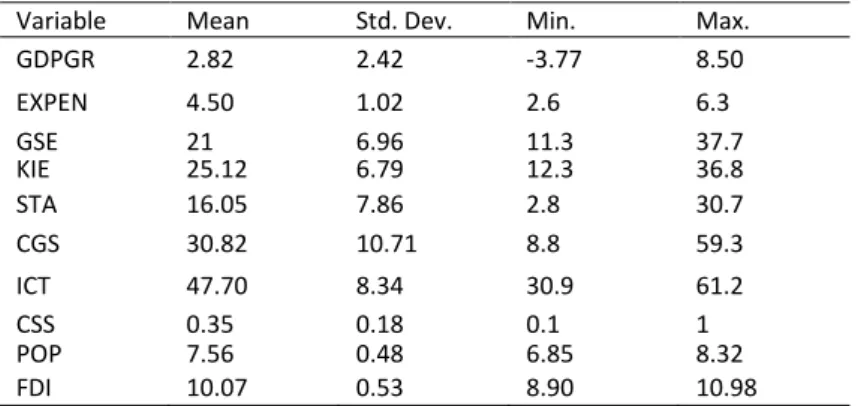
Table 3: Descriptive Statistics
Variable Mean Std. Dev. Min. Max.
GDPGR 2.82 2.42 -3.77 8.50 EXPEN 4.50 1.02 2.6 6.3 GSE 21 6.96 11.3 37.7 KIE 25.12 6.79 12.3 36.8 STA 16.05 7.86 2.8 30.7 CGS 30.82 10.71 8.8 59.3 ICT 47.70 8.34 30.9 61.2 CSS 0.35 0.18 0.1 1 POP 7.56 0.48 6.85 8.32 FDI 10.07 0.53 8.90 10.98
Descriptive statistics shown in Table 3 demonstrate that the average gross domestic product growth rate in the analysis period is 2.82%. The statistics show that the middle income countries spend different amounts on education. Although all of these countries attach importance to knowledge intensive employment, the average number of graduates from science and engineering fields is quite low. Moreover, the number of scientists and engineers who graduated in these countries is quite different.
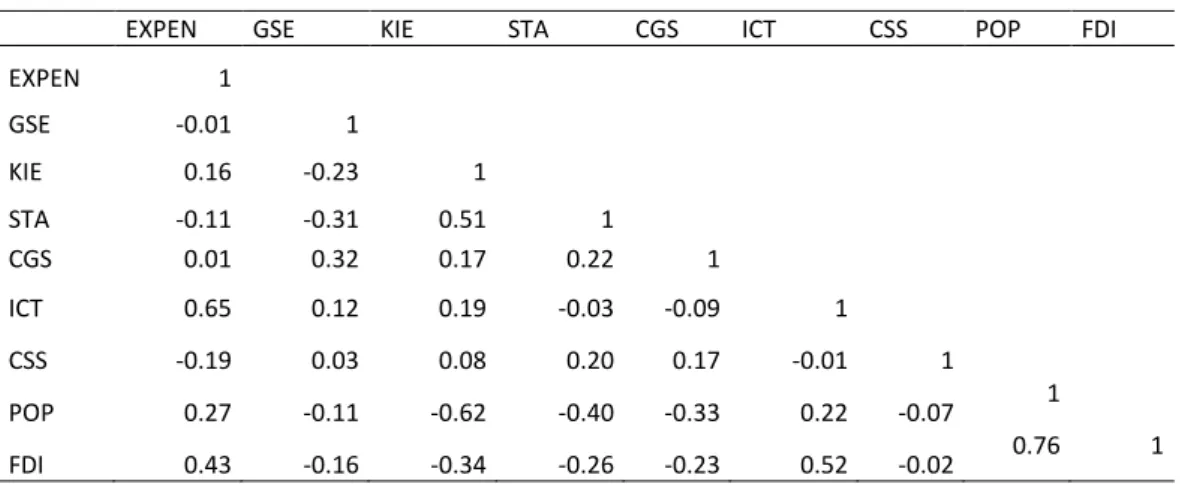
The correlation between explanatory variables is given in Table 4. The Pearson correlation is used to measure the linear relationship between two variables. As Table 4 shows, almost all of the coefficients are below 0.75, therefore all of them can be included in the model.
Table 4: Pearson Correlation Coefficients
EXPEN GSE KIE STA CGS ICT CSS POP FDI
EXPEN 1 GSE -0.01 1 KIE 0.16 -0.23 1 STA -0.11 -0.31 0.51 1 CGS 0.01 0.32 0.17 0.22 1 ICT 0.65 0.12 0.19 -0.03 -0.09 1 CSS -0.19 0.03 0.08 0.20 0.17 -0.01 1 POP 0.27 -0.11 -0.62 -0.40 -0.33 0.22 -0.07 1 FDI 0.43 -0.16 -0.34 -0.26 -0.23 0.52 -0.02 0.76 1 Source: Authors’ calculations
According to the diagnostic test results shown in Table 5, the model does not suffer from heteroskedasticity and autocorrelation. In accordance with the results of Breusche-Pagan test, the p-value is more than 0.05, so the null hypothesis is accepted and it is concluded that there is no heteroskedasticity. On the other hand, the serial correlation is tested with the Wooldridge test, which states that there is no serial correlation in the model.
Table 5: Results of Diagnostic Tests
Test H0 P-value Statistic Result
Breusch-Pagan Constant variance 0.7227 6.17 There is no heteroskedasticity in the model Wooldridge No serial correlation
0.1343 3.510 There is no serial correlation in the model.
Source: Authors’ calculations 6. Results
R&D and innovation have become the key determinants of international competitiveness, productivity improvement and economic growth (Belitz et al., 2015: 455; Johns and Williams, 1999). It is no longer possible to grow further without developing new ideas and transforming them into the innovative products. The link between R&D, economic growth and productivity has been the subject of interest for researchers for many years. We find that expenditure on education, graduates in science and engineering, knowledge intensive employment, scientific and technical articles boost economic growth by leading to an increase in the growth rate of gross domestic product.
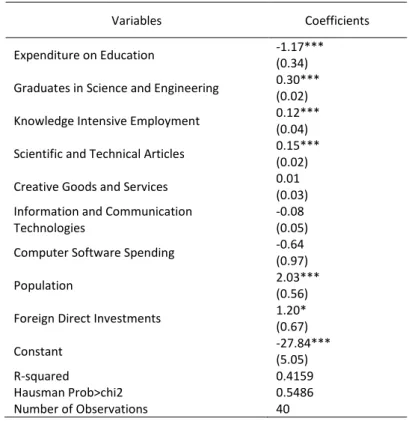
Table 6: Panel Data Analysis to Explain Innovation and Economic Growth Relationship Dependent Variable: GDP Growth Rate
Variables Coefficients
Expenditure on Education -1.17*** (0.34) Graduates in Science and Engineering 0.30***
(0.02) Knowledge Intensive Employment 0.12***
(0.04) Scientific and Technical Articles 0.15***
(0.02) Creative Goods and Services 0.01
(0.03) Information and Communication
Technologies
-0.08 (0.05) Computer Software Spending -0.64
(0.97)
Population 2.03***
(0.56) Foreign Direct Investments 1.20* (0.67) Constant -27.84*** (5.05) R-squared 0.4159 Hausman Prob>chi2 Number of Observations 0.5486 40
Note: ***, **,* refers to 1%, 5% and 10% statistical significance level respectively. The values in parentheses indicate the standard errors.
Our results indicate that an increase in expenditure on education contributes negatively to the GDP growth rate. Although it is contrary to expectations, the impact of education on economic growth is already found to be lower in developing countries compared to the impact of physical capital (Çakmak and Gümüş, 2005:59-72). In the middle-income countries, a huge spending on education seems to cause a decline in the growth rate of the gross domestic product. This might be due to the fact that the middle-income countries need very high amount of investments in education to reap the fruits out of it. Therefore, expenditures on education do not contribute to economic growth until they reach to a certain maturity level. According to Ifa and Guetat (2018), in the short term, there is a negative correlation between public spending on education and GDP per capita in Tunisia, and a positive correlation in Morocco. Another perspective for the evaluation of this relation is provided in the study of Urhie (2014: 370). He states that, when developing countries spend more on education, it seems to decrease economic growth, because some resources are channeled to education instead of other activities that give fruits in a shorter time (Urhie, 2014:370:382).
As Table 6 shows, the coefficient of graduates in science and engineering is positive and statistically significant at 1% level. It means that economic growth increases when the number of people graduated increases in the fields of science, engineering, manufacturing and construction. These people are considered as the producers of knowledge and creative goods in a country. This finding supports the expectations of Peri and Shih (2013) in a way that graduates in engineering and science have a huge potential to conduct high quality research and to develop innovative products and services which in turn result in a higher economic growth.
We also find a relatively strong and significant relationship between knowledge intensive employment and gross domestic product growth rate. 10% increase in knowledge intensive
employment leads gross domestic product to grow by almost 1.2%. Brenner et al. (2018: 172- 183) state that the impact of knowledge intensive business sectors on local economy is positive and it works through various channels. First, knowledge incentive sectors create knowledge diffusion and contribute to the productivity growth with some delay. Second, growth in knowledge intensive sectors creates demand especially in non-tradable local sectors and stimulates the local economy in this way (Moretti and Thulin, 2013: 39-362). Therefore, it is not surprising to find a direct relation between knowledge intensive employment and economic growth. We suggest that knowledge-creation activities need to be heavily supported in the middle income countries. The corporate and industrial sectors should be close to the universities and research centers to improve their innovation and knowledge-creation capacity.
As our results indicate, scientific and technical articles also create a great value for the middle-income countries. A 10 percent increase in scientific and technical articles seems to cause 1.5 % growth of GDP. As the quality of research gets better and efforts of researchers are transformed into the innovative products and services, the income of a middle-income country increases. To our knowledge, the impact of scientific and technical articles on the GDP growth has not been empirically estimated so far.
We find a positive impact of population on economic growth. There are positive and negative coefficients of population found in the literature depending on the sample and development level of the countries. Our highly significant positive coefficient of 2.03 supports the ‘ideas- effect’ of Bucci et al. (2018). It means, as the population of the middle income countries increases, innovative capability of these countries gets better and this leads to higher growth rates. Although there might be also the dilution-effect of population growth on per-capita skill formation to some extent, the population growth seems to be more innovation-friendly in the middle-income countries.
The impact of foreign direct investments on the GDP growth rate in the middle-income countries in our sample is found to be positive. It means, as FDIs increase by 1 percent, economic growth is going to increase by 1.2 percent. This shows the impact of foreign direct investments on the growth of the middle-income countries. This finding is mostly in line with the growth literature. It is therefore suggested for the middle-income countries to have FDI-friendly policies, a well-structured law system and a stable political and economic environment to attract foreign investors.
7. Conclusion
The purpose of this study is to reveal the relationship between R&D, innovation and economic growth in a sample of eight middle-income countries for the years 2012-2016, and to see the returns to innovation. We find a strong relationship between expenditure on education, graduates in science and engineering, knowledge intensive employment, scientific and technical articles, population and foreign direct investments, and the growth of gross domestic product.
It is a need for the middle income countries to increase their innovation-related activities not to stay behind, and even to reach high-income levels. The target level of the share of R&D expenditures in total GDP is set as 3% by the Lisbon strategy (Com 2003). There are only a few countries in the world which have R&D expenditures around 3% of their GDPs. Most countries, including many industrialized ones, need to go further with their R&D efforts. The situation of the middle income countries is however more severe. It seems more crucial for them to engage in R&D activities, because it gets harder and harder to grow at increasing or even constant rates, hence the fate of the middle income countries depends on their ability to innovate and grow. Otherwise, they seem to be stuck in the middle-income trap.
Besides increasing the level of R&D expenditures and supporting innovative activities, the middle-income countries have to pursue more comprehensive innovation and R&D policies as well. However, it is seen that in many cases these policies cannot be separated from other policy areas. Complementing them with other development and growth policies will pave the way to the innovation and R&D to improve the prosperity of these nations. The importance of FDI flows is also
remarkable in our results. The middle-income countries need foreign investments to improve their growth rates. To attract foreign investments, they need a stable economic and political environment, the rule of law being implemented, and high-quality and transparent institutions.
Our results provide evidence for the determinants of economic growth in the middle income countries. We suggest that in order to climb the stairs of high-income levels, they need to place a high emphasis on knowledge intensive sectors, increase the quantity and quality of graduates in science and engineering fields, and improve the quality of research and academic publications.
References
Akçalı, B. Y. and Şişmanoğlu, E. (2015). Innovation and the Effect of Research and Development (R&D) Expenditure on Growth in Some Developing and Developed Countries. Procedia - Social and Behavioral Sciences, 195, 768-775.
Altın, O. and Kaya, A. (2009). Türkiye’de AR-GE Harcamaları ve Ekonomik Büyüme Arasındaki Nedensel İlişkinin Analizi. Ege Akademik Bakış, 9(1), 251-259.
Aslan, H.K. (2014). Avoiding the Middle Income Trap through the Development of Human Capital. Bilgesam Analysis / Political Economy, 1110.
Barro, R. J. and Lee, J. W. (2010). A New Data Set of Educational Attainment in the World, 1950-2010. NBER Working Paper, 15902.
Belitz, H., Junker, S., Podstawski, M. and Schiersch, A. (2015). Growth through Research and Development. DIW Economic Bulletin, 5(35), 455-465.
Bond, S., Hoeffler, A. and Temple, J. (2001). GMM Estimation of Empirical Growth Models. Economics Papers, 2001-W21.
Bozkurt, C. (2015). R&D Expenditures and Economic Growth Relationship in Turkey. International Journal of Economics and Financial Issues, 5(1), 188-198.
Brenner, T., Capasso, M., Duschl, M., Frenken, K. and Treibich T. (2018). Causal Relations between Knowledge-Intensive Business Services and Regional Employment Growth. Regional Studies, 52(2), 172-183.
Bucci, A., Eraydın, L. and Müller, M. (2018). Dilution Effects, Population Growth and Economic Growth under Human Capital Accumulation and Endogenous Technological Change. Working Paper Series in Economics, Karlsruher Institut für Technologie (KIT), 113. Charles, I. J. and John C. W. (1999). Too Much of a Good Thing? The Economics of Investment in
R&D. NBER Working Paper, 7283.
Chatterji, M. (1997). Tertiary Education and Economic Growth. Regional Studies, 32(4), 349- 354. Coe, D. T. and Helpman, E. (1995). International R&D Spillovers. European Economic Review, 39(5),
859–887.
Coe, D. T., Helpman, E. and Hoffmaister, A.W. (2009). International R&D Spillovers and Institutions. European Economic Review, 53(7), 723–741.
Colecchia, A. and Schreyer, P. (2002). The Contribution of Information and Communication Technologies to Economic Growth in Nine OECD Countries. OECD Economic Studies, 1(5), 153–171.
Com (2003). Investing in Research: An Action Plan for Europe. 226 final/2.
Çakmak, E. and Gümüş, S. (2005). Türkiye’de beşeri sermaye ve ekonomik büyüme: Ekonometrik bir analiz (1960-2002). Ankara Üniversitesi SBF Dergisi, 60(1), 59-72.
Çetin, D. and Cincera, M. (2015). Circular Causality of R&D and Export in EU countries. World Journal of Applied Economics, 1, 82-105.
Dewan, E. and Hussein, S. (2001). Determinants of Economic Growth (Panel Data Approach). Working Paper Economics Department Reserve Bank of Fiji, 1(4).
Drysdale, P. (2012). Asia’s Human Capital and the Middle Income Trap. East Asia Forum.
Eichengreen, B., Park, D. and Shin, K. (2013). Growth Slowdowns Redux: New Evidence on the Middle-Income Trap. NBER Working Paper, 18673.
European Commission JRC Annual Report (2012).
Felipe, J., Kumar, U., Abdon, A. and Bacate, M. (2012). Product Complexity and Economic Development. Structural Change and Economic Dynamics, 23, 36–68.
Global Innovation Index (2016).
Griffith, R. (2000). How Important Is Business R&D for Economic Growth and Should the Government Subsidies It?. The Institute for Fiscal Studies Briefing Note, 12.
Gust, C. and Jaime, M. (2004). International comparisons of productivity growth: the role of information technology and regulatory practices. Labour Economics, 11(1), 33-58. Hidalgo, C. and Hausmann, R. (2009). The building blocks of economic complexity. Proceedings of
the National Academy of Sciences of the United States of America, 106(26), 10570–10575. Ifa, A. and Guetat, I. (2018). Does Public Expenditure on Education Promote Tunisian and Moroccan
GDP per capita? ARDL Approach. The Journal of Finance and Data Science, 1(3).
Jones, C. I. and Williams, J.C. (1999). Too Much of a Good Thing? The Economics of Investment in R&D. Working Papers 99015, Stanford University, Department of Economics.
Kagermann, H., Wahlster, W. and Helbig, J. (2013). Recommendations for Implementing the
Strategic Initiative Industrie 4.0. Available at: <
http://www.acatech.de/fileadmin/user_upload/Baumstruktur_nach_Website/Acatech/r oot/de/Material_fuer_Sonderseiten/Industrie_4.0/Final_report__Industrie_4.0_accessib le.pdf> [Accessed: March 30, 2018]
Kim, L.W. (2011). The Economic Growth Effect of R&D Activity in Korea. Korea and the World Economy, 12(1), 25-44.
Kokko, A., Gustavsson Tingvall, P. and Videnord, J. (2015). The Growth Effects of R&D Spending in the EU: A Meta-Analysis. Economics Discussion Papers, 9(40).
Korkmaz, S. (2010). Türkiye’de Ar-Ge Yatırımları ve Ekonomik Büyüme Arasındaki İlişkinin Var Modeli ile Analizi. Journal of Yasar University, 20(5), 3320-3330.
Kretschmer, T. (2012). Information and Communication Technologies and Productivity Growth: A Survey of the Literature. OECD Digital Economy Papers, 195, OECD Publishing, Paris. Mankiw, N. G., Romer, D. and Weil, D. N. (1992). A Contribution to the Empirics of Economic
Growth. The Quarterly Journal of Economics, 107(2), 407-437.
Mercan, M. and Sezer, S. (2014). The Effect of Education Expenditure on Economic Growth: The Case of Turkey. Procedia - Social and Behavioral Sciences, 109, 925-930.
Moretti, E. and Thulin, P. (2013). Local Multipliers and Human Capital in the United States and Sweden. Industrial and Corporate Change, 22(1), 39–362.
OECD (2013). Raising the Returns to Innovation: Structural Policies for a Knowledge-based Economy. OECD Economics Department Policy Notes, Vol. 17.
Olivier B. and Johnson, D. R. (2013). Macroeconomics, Boston: Pearson Education Ltd.
Peri, G. and Shih, K. (2013). Foreign Scientists and Engineers and Economic Growth in Canadian Labor Markets. IZA Discussion Paper, 7367.
Rajapathirana, R.P.J. and Hui, Y. (2018). Relationship between Innovation Capability, Innovation Type, and Firm Performance. Journal of Innovation & Knowledge, 3(1), 44–55.
Romer, P. M. (1990). Endogenous Technological Change. Journal of Political Economy, 98(5), 71-102.
Schmidheiny, K. (2016). Short Guides to Micro econometrics. Available at: <http://schmidheiny.name/teaching,> [Accessed: January 3, 2018]
Solow (1956). Technical Change and the Aggregate Production Function. The Review of Economics and Statistics, 39(3), 312-320.
Şahin, B. E. (2015). The Relationship between R&D Expenditures and Economic Growth: Panel Data Analysis 1990-2013. 207, EY International Congress on Economics II (EYC2015), Ankara, Turkey from Ekonomik Yaklasim Association.
Timmer, M. P. and Ark, v. B. (2005). Does Information and Communication Technology Drive EU-US Productivity Growth Differentials?. Oxford Economic Papers, 57(4), 693–716.
Ulku, H. (2004). R&D, Innovation, and Economic Growth: An Empirical Analysis. IMF Working Paper, 185(4).
UNIDO (2013). Creative Industries for Youth: Unleashing Potential and Growth. United Nations Industrial Development Organization. Vienna.
Urhie, E. (2014). Public Education Expenditure and Economic Growth in Nigeria: A Disaggregated Approach. Journal of Empirical Economics, 3(6), 370-382.
Yasar, A.B. and Sismanoglu, E. (2015). Innovation and the Effect of Research and Development (R&D) Expenditure on Growth in Some Developing and Developed Countries. Procedia Social and Behavioral Sciences, 195, 768-775.
Yılmaz, G. (2014). Turkish Middle Income Trap and Less Skilled Human Capital, Central Bank of the Republic of Turkey. Working Paper, 14(30).
Williams, R. (2018). Panel Data 4: Fixed Effects vs Random Effects Models. Available at: < https://www3.nd.edu/~rwilliam/stats3/panel04-fixedvsrandom.pdf,> [Accessed: August 18, 2018]