10
Siibidey Togan
Central, East European, Baltic and Turkish
Economies: A View to Future Membership in the EU*
Introduction
Major changes have affected the future of European Union (EU) during the last six years. Six years ago, the future of the EU seemed set: a gradual deep ening towards real and monetary union. The breakdown of communism radi cally shifted the challenge from deepening to widening. First to come were the countries of the EFTA (Europe Free Trade Association). Their member ship applications were a logical step. Since January I, 1995 these countries have participated in the decision making process of the EU. Added to this list are the potential applicants from the Central European Economies: the Czech Republic, Hungary, Poland and the Slovak Republic. These countries may in fact have a solid claim to EU membership. All of them have signed Association Agreements with EU, but no timetable for accession has been offered. The next group of potential applicants consist of Bulgaria and Romania. These countries, which have also signed Association Agreements with the EU, have some way to go in policy reforms before becoming viable candidates. The third group of countries are the Baltic countries: Estonia, Latvia and Lithuania. In addition, there are countries such as Slovenia which has indicated its desire to accede to the EU, and Belarus, Moldova and Ukraine whose potential membership is highly uncertain. Finally, we have the Mediterranean applicants consisting of Cyprus, Malta and Turkey.
The chapter presents a comparative study of the countries in Central and Eastern Europe (CEE), the Baltics and Turkey, and analyses the implications of an enlarged EU that includes countries in CEE, the Baltic countries and Turkey. The next section compares these economies, particularly in relation to their trade policies and the trade agreements they have concluded with the EU. This is followed by aspects related to Turkey-EU Customs Union Decision (CUD) and the Europe Agreements (EA). The chapter then turns to consideration of the potential for trade creation between the EU, CEE, the Baltics and Turkey. The final section discusses the potential accession of these countries to the EU.
* I w11 grateful to Bemard Hoekman for co111111e111s m1 w1 earlier drqfi of 1his chapter. All errors are of cm,r.1·e mine.
338 Siibidey Togan
The Fundamentals
The economies of the EU, CEE, the Baltics and Turkey are at different stages of development. The EU countries are developed economies. Turkey is a mid dle income, free market economy with a relatively large public sector. On the other hand, the CEE and the Baltic economies are since 1989 in the process of transition from centrally planned to free market economies, and they face all of the associated difficulties.
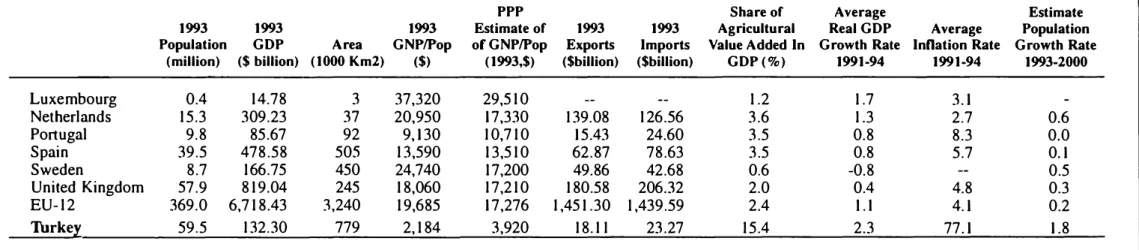
Table I provides basic data on the economies under consideration. Per capita income is lowest in Romania, followed by Bulgaria, Lithuania, Slovak Republic, Latvia, Turkey, Poland, Czech Republic, Estonia, Hungary and Slovenia. Turkey's per capita income lies between that of Poland and Latvia, and is higher than that of the Slovak Republic, Lithuania, Bulgaria and Romania. This ordering changes if one examines per capita incomes calculat ed on the basis of purchasing power parity (PPP). The poorest country is again Romania, though now it is followed by Lithuania, Turkey, Bulgaria, Poland, Latvia, Hungary, Slovak Republic, Estonia and Czech Republic. No figures are reported for Slovenia. Thus, in PPP terms, the Czech Republic is the rich est, and Turkish per capita income lies between that of Lithuania and Bulgaria.
In 1993, the exports (imports) of CEE-4 countries amounted to $ 4 1.3 (5 1.3) billion, those of the CEE-6 countries to$ 50.2 (6 1.9) billion, and those of Turkey to$ I 8. 1 (23.3) billion. Examination of the structure of production reveals that in Lithuania, the agricultural sector contributed 23 per cent to the country's 1993 gross domestic product (GDP) The share of agriculture in Turkey's GDP during the same year was 15 percent, 16 percent in Latvia, 13 percent in Bulgaria and I I percent in Estonia. In all of the remaining coun tries excluding Greece, the share of agriculture was less than 8 percent. During the period since the implementation of market oriented economic reforms, output in the region has declined sharply. Recently, output has start ed to stabilize. During 1993, output increased in Poland and Slovenia, and during I 994 it increased in all of the transition economies. In all the countries under consideration, inflation in 1994 did not exceed two digit figures except in Turkey where inflation reached a high of I 06 percent. Inflation during i 994 was running at an annual rate of I O percent in the Czech Republic, 19 percent in Hungary and 32 percent in Poland (IMF, I 995a). By I 995 all countries under investigation were under stand-by agreements with the International Monetary Fund (IMF). Finally, it should be noted that the rate of population growth in all the countries under consideration is relatively low, save in the case of Turkey.
Table 1: Basic Data on CEE, EU and Turkish Economies
I
;:sPPP Share of Average Estimated
1993 1993 1993 Estimate of 1993 1993 Agricultural Real GDP Average Population
�
Population GDP Area GNP/Pop GNP/Pop Exports Imports Value Added In Growth Rate Innation Rate Growth Rate
(million) ($ billion) (1000 Km2) ($) (1993, $) ($ billion) ($ billion) GDP(%) 1991-94 1991-94 1993-2000
...
t">'l CEE Countries Czech Republic 10.3 31.61 79 2,710 7,550 12.93 13.49 5.3 -5.7 25.2 0.1 Hungary 10.2 38.10 93 3,350 6.050 8.89 12.60 7.7 -3.4 24.6 -0.4 $::, Poland 38.3 85.85 313 2,260 5,000 14.00 18.83 7.0 1.4 45.2 0.2 ;s Slovak Republic 5.3 11.08 49 1.950 6,290 5.45 6.35 6.4 -5.9 26.6 0.4 CEE-4 64.1 166.64 534 2,574 5.810 41.26 51.26 6.8 -1.5 35.5 0.1 ;::;· Bulgaria 8.9 10.37 111 1,140 4,100 4.07 4.24 12.8 -5.0 146.1 -0.5 $::, Romania 22.8 25.97 238 1.140 2.800 4.89 6.40 20.9 -4.2 191.1 -0.1 ;:s CEE-6 95.8 202.98 883 2,317 5,337 50.23 61.91 8.9 -2.0 61.0 0.0 Former Yugoslavia � Slovenia 1.9 10.34 20 6,490 6.09 6.50 5.1 3.2 26.l 0.1 .:;· Baltic Countries � Estonia 1.6 5.09 45 3,080 6,502 0.46 0.62 I I.I -7.5 354.1 -0.5 C) Latvia 2.6 4.60 65 2,010 5,010 0.46 0.34 15.7 -14.8 305.1 -0.8 ;:s C) Lithuania 3.7 4.34 65 1,320 3,110 0.70 0.49 22.6 -23.1 431.9 -0.1 ;:: Baltic Countries 7.9 14.03 175 2,185 4,964 1.62 1.44 16.5 -14.7 362.1 -0.4 ;;;· European Union Austria 7.9 182.07 84 23,510 19.430 40.17 48.58 2.7 1.9 0.5 Belgium 10.0 210.58 31 21,650 19,640 112.51 125.06 1.8 0.8 2.5 0.3 Denmark 5.2 117.59 43 26,730 19,560 35.91 29.52 3.1 1.8 2.0 0.1 Finland 5.1 74.12 338 19,300 15,530 23.45 18.03 2.4 -2.1 0.4 France 57.5 1,251.69 552 22,490 19,000 206.26 202.27 2.6 0.8 2.3 0.4 Germany 80.7 1,910.76 357 23,560 16,850 380.15 348.63 1.0 1.7 3.5 0.2 Greece 10.4 63.24 132 7,390 9,000 7.96 20.54 12.5 1.2 14.3 0.3 Ireland 3.5 42.96 70 13,000 13,490 28.61 21.39 6.6 3.5 2.4 0.3 Italy 57.1 991.39 301 19,840 17,830 168.46 146.79 3.2 0.7 5.3 0.0
I
(...,, (...,,Table 1: Continued
PPP Share of Average
1993 1993 1993 Estimate of 1993 1993 Agricultural Real GDP Average
Population GDP Area GNP/Pop of GNP/Pop Exports Imports Value Added In Growth Rate Inflation Rate (million) ($ billion) (1000 Km2) ($) (1993,$) ($billion) ($billion) GDP(%) 1991-94 1991-94
Luxembourg 0.4 14.78 3 37,320 29,510 1.2 1.7 3.1 Netherlands 15.3 309.23 37 20,950 17,330 139.08 126.56 3.6 1.3 2.7 Portugal 9.8 85.67 92 9,130 10,710 15.43 24.60 3.5 0.8 8.3 Spain 39.5 478.58 505 13,590 13,510 62.87 78.63 3.5 0.8 5.7 Sweden 8.7 166.75 450 24,740 17,200 49.86 42.68 0.6 -0.8 United Kingdom 57.9 819.04 245 18,060 17,210 180.58 206.32 2.0 0.4 4.8 EU-12 369.0 6,718.43 3,240 19,685 17,276 1,451.30 1,439.59 2.4 I.I 4.1 Turke;t: 59.5 132.30 779 2,184 3,920 18.11 23.27 15.4 2.3 77.1
Source: World Development Repurt /995, World Bank; various issues of the "Economist /ntelligenc Unit Country Reports" on CEE economies;
OECD in Figures, /994 edition, OECD; various issues of European Economy, and World Economic Outlook, Oct /995 /MF. Note: Turkish data on GNP. per capita income, exports and imports refer to rhe year /994.
Estimate Population Growth Rate 1993-2000 0.6 0.0 0.1 0.5 0.3 0.2 1.8
I
VJ .:::<::l-!S:
�
Central, East European, Baltic and Turkish Economies 341
During the last five years, all of the CEE and Baltic countries have made sub stantial progress in structural reform. In particular, prices in these countries are now largely determined by market forces. Privatization has proceeded rapidly in all of the countries except in the cases of Romania, Bulgaria and Slovenia. The share of the private sector in GDP in the Czech Republic has increased from 3 percent in 1989 to 65 percent in 1994 and from 3 percent in 1989 to 40 percent in 1994 in Bulgaria. By 1994, more than half of GDP was generated in most of the countries by the private sector. In comparison, one should note that the share of state owned enterprises in total value-added in the Turkish economy was 10.6 percent in 1990.1
The transition economies still need to achieve macroeconomic stability, reduce economic distortions and free resources for productive activity. The countries will then be on course for a sustainable economic growth. In the meantime, there is much to be done in order to make the economy more responsive to market forces. To this end, the countries have to foster compe tition. It is recognized that opening up to international trade would be the most effective mean to instill competition in the economy.
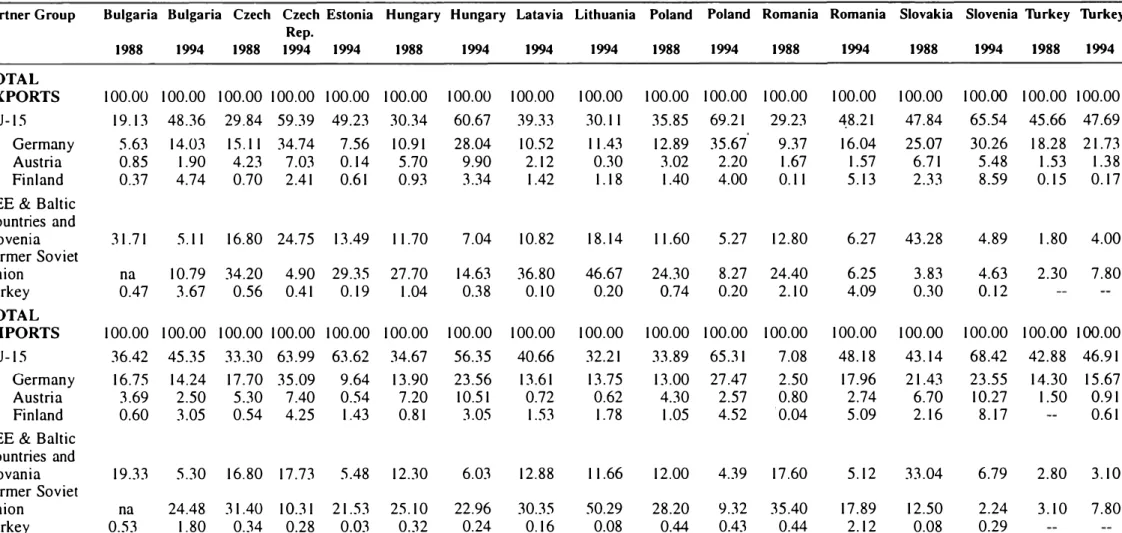
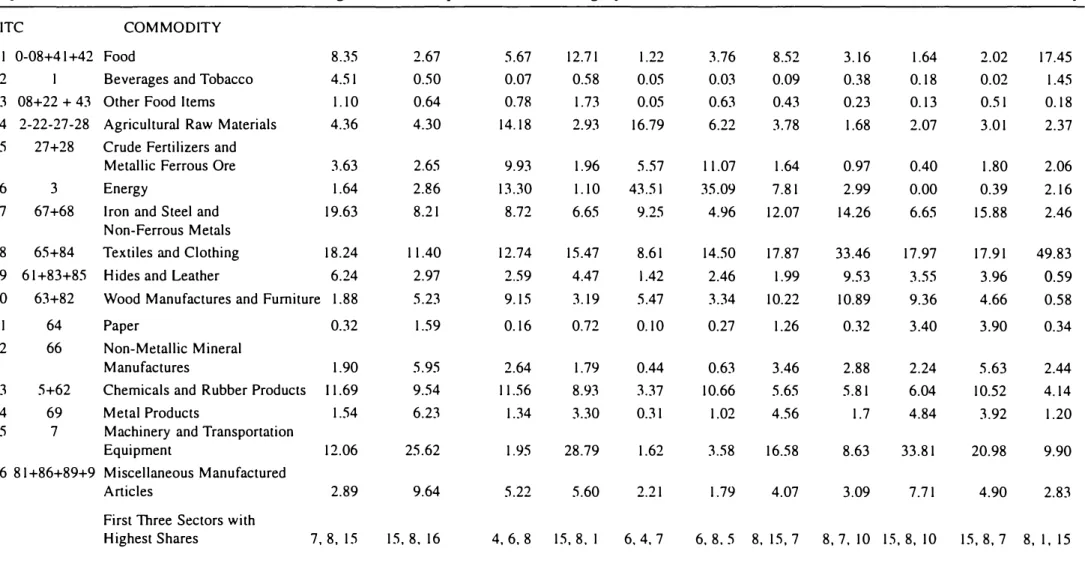
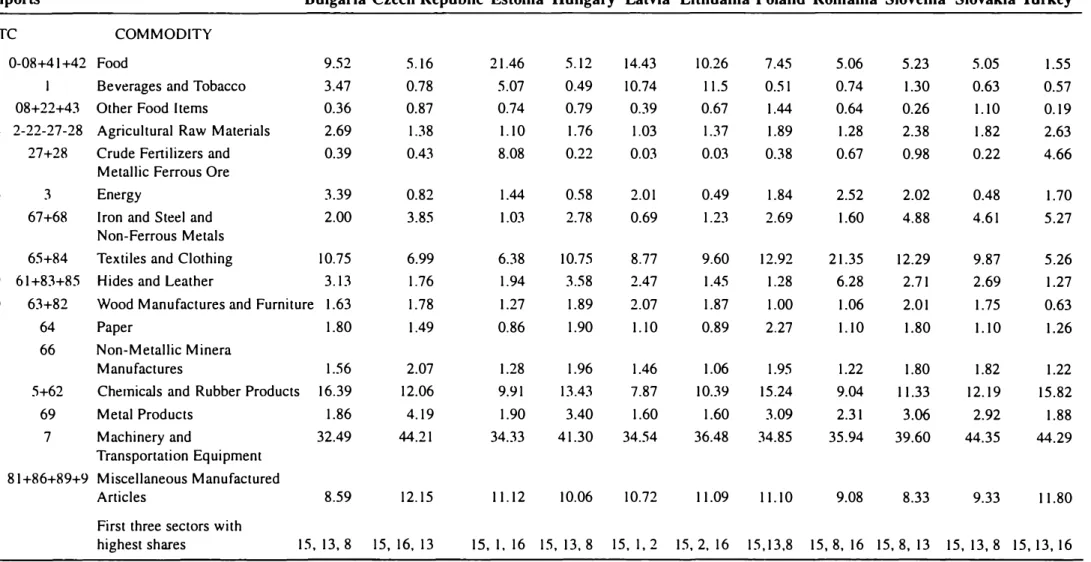
Table 2 shows the direction of trade of the countries under investigation during the years 1988 and 1994 and Table 3 presents the commodity compo sition. The following aspects are worth noting:
• The European Union has emerged to become the single most important trading partner for all of the CEE countries and Turkey during the period
1988- 1994.
• Germany is the single most important trading partner within the EU for the CEE countries.
• Trade among the CEE countries has decreased during the period 1988-1994.
• Trade between CEE countries and the former Soviet Union has decreased substantially over the period 1988- 1994.
• Textiles and clothing goods are the most important export items of Turkey, CEE and the Baltic countries to the EU.
Table 2: Territorial Composition of Trade of the CEE and Baltic Countries and of Turkey
I
during 1988 and 1994
NPartner Group Bulgaria Bulgaria Czech Czech Estonia Hungary Hungary Latavia Lithuania Poland Poland Romania Romania Slovakia Slovenia Turkey Turkey Rep. 1988 1994 1988 1994 1994 1988 1994 1994 1994 1988 1994 1988 1994 1988 1994 1988 1994 TOTAL EXPORTS 100.00 100.00 100.00 100.00 100.00 100.00 100.00 100.00 100.00 100.00 100.00 100.00 100.00 100.00 100.00 100.00 100.00 EU-15 19.13 48.36 29.84 59.39 49.23 30.34 60.67 39.33 30.11 35.85 69.21 29.23 '\8.21 47.84 65.54 45.66 47.69 Germany 5.63 14.03 15.11 34.74 7.56 10.91 28.04 10.52 11.43 12.89 35.67 9.37 16.04 25.07 30.26 18.28 21.73 Austria 0.85 1.90 4.23 7.03 0.14 5.70 9.90 2.12 0.30 3.02 2.20 1.67 1.57 6.71 5.48 1.53 1.38 Finland 0.37 4.74 0.70 2.41 0.61 0.93 3.34 1.42 1.18 1.40 4.00 0.11 5.13 2.33 8.59 0.15 0.17 CEE & Baltic
Countries and Slovenia 31.71 5.11 16.80 24.75 13.49 11.70 7.04 10.82 18.14 11.60 5.27 12.80 6.27 43.28 4.89 1.80 4.00 Former Soviet Union na 10.79 34.20 4.90 29.35 27.70 14.63 36.80 46.67 24.30 8.27 24.40 6.25 3.83 4.63 2.30 7.80 Turkey 0.47 3.67 0.56 0.41 0.19 1.04 0.38 0.10 0.20 0.74 0.20 2.10 4.09 0.30 0.12 TOTAL IMPORTS 100.00 100.00 100.00 100.00 100.00 100.00 100.00 100.00 100.00 100.00 100.00 100.00 100.00 100.00 100.00 100.00 100.00 EU-15 36.42 45.35 33.30 63.99 63.62 34.67 56.35 40.66 32.21 33.89 65.31 7.08 48.18 43.14 68.42 42.88 46.91 Germany 16.75 14.24 17.70 35.09 9.64 13.90 23.56 13.61 13.75 13.00 27.47 2.50 17.96 21.43 23.55 14.30 15.67 Austria 3.69 2.50 5.30 7.40 0.54 7.20 10.51 0.72 0.62 4.30 2.57 0.80 2.74 6.70 10.27 1.50 0.91 Finland 0.60 3.05 0.54 4.25 1.43 0.81 3.05 1.53 1.78 1.05 4.52 0.04 5.09 2.16 8.17 0.61 CEE & Baltic
Countries and V) Slovania 19.33 5.30 16.80 17.73 5.48 12.30 6.03 12.88 11.66 12.00 4.39 17.60 5.12 33.04 6.79 2.80 3.10 ::::: Former Soviet (:r-Union na 24.48 31.40 10.31 21.53 25.10 22.96 30.35 50.29 28.20 9.32 35.40 17.89 12.50 2.24 3.10 7.80
!
Turkey 0.53 1.80 0.34 0.28 0.03 0.32 0.24 0.16 0.08 0.44 0.43 0.44 2.12 0.08 0.29 �Note: Trade duri11g 1988 betwee11 each of the CEE countries and "CEE & Baltic Countries a11d Slove11ia" refers only lo trade between those countries and CEE countries.
Table 3: Commodity Composition Of Exports and Imports of CEE
I
"'
Exports Bulgaria Czech Republic Estonia Hungary Latvia Lithuania Poland Romania Slovenia Slovakia Turkey � SITC COMMODITY
I 0-08+41+42 Food 8.35 2.67 5.67 12.71 1.22 3.76 8.52 3.16 1.64 2.02 17.45 t"?"] 2 I Beverages and Tobacco 4.51 0.50 0.07 0.58 0.05 0.03 0.09 0.38 0.18 0.02 1.45
3 08+22 + 43 Other Food Items 1.10 0.64 0.78 1.73 0.05 0.63 0.43 0.23 0.13 0.51 0.18
"'
4 2-22-27-28 Agricultural Raw Materials 4.36 4.30 14.18 2.93 16.79 6.22 3.78 1.68 2.07 3.01 2.37 5:)5 27+28 Crude Fertilizers and �
Metallic Ferrous Ore 3.63 2.65 9.93 1.96 5.57 11.07 1.64 0.97 0.40 1.80 2.06
g.
6 3 Energy 1.64 2.86 13.30 1.10 43.51 35.09 7.81 2.99 0.00 0.39 2.16 ;::;·5:)
7 67+68 Iron and Steel and 19.63 8.21 8.72 6.65 9.25 4.96 12.07 14.26 6.65 15.88 2.46 ;::
Non-Ferrous Metals �
8 65+84 Textiles and Clothing 18.24 11.40 12.74 15.47 8.61 14.50 17.87 33.46 17.97 17.91 49.83
9 61+83+85 Hides and Leather 6.24 2.97 2.59 4.47 1.42 2.46 1.99 9.53 3.55 3.96 0.59 o:;· JO 63+82 Wood Manufactures and Furniture 1.88 5.23 9.15 3.19 5.47 3.34 10.22 10.89 9.36 4.66 0.58
II 64 Paper 0.32 1.59 0.16 0.72 0.10 0.27 1.26 0.32 3.40 3.90 0.34 Cl ;::
12 66 Non-Metallic Mineral Cl
Manufactures 1.90 5.95 2.64 1.79 0.44 0.63 3.46 2.88 2.24 5.63 2.44 <i;" 13 5+62 Chemicals and Rubber Products I 1.69 9.54 I 1.56 8.93 3.37 10.66 5.65 5.81 6.04 10.52 4.14 c., 14 69 Metal Products 1.54 6.23 1.34
:uo
0.31 1.02 4.56 1.7 4.84 3.92 1.2015 7 Machinery and Transportation
Equipment 12.06 25.62 1.95 28.79 1.62 3.58 16.58 8.63 33.81 20.98 9.90 16 81+86+89+9 Miscellaneous Manufactured
Articles 2.89 9.64 5.22 5.60 2.21 1.79 4.07 3.09 7.71 4.90 2.83 First Three Sectors with
Highest Shares 7, 8, 15 15, 8. 16 4,6.8 15, 8. I 6.4. 7 6. 8,5 8, 15, 7 8, 7, JO 15, 8, JO 15,8, 7 8, 1. 15
.
v.,, v.,,Table 3: Continued
I
-i:.. -i:..Imports Bulgaria Czech Republic Estonia Hungary Latvia Lithuania Poland Romania Slovenia Slovakia Turkey
SITC COMMODITY
0-08+41+42 Food 9.52 5.16 21.46 5.12 14.43 10.26 7.45 5.06 5.23 5.05 1.55
2 I Beverages and Tobacco 3.47 0.78 5.07 0.49 10.74 11.5 0.51 0.74 1.30 0.63 0.57
3 08+22+43 Other Food Items 0.36 0.87 0.74 0.79 0.39 0.67 1.44 0.64 0.26 1.10 0.19
4 2-22-27-28 Agricultural Raw Materials 2.69 1.38 1.10 1.76 1.03 1.37 1.89 1.28 2.38 1.82 2.63
5 27+28 Crude Fertilizers and 0.39 0.43 8.08 0.22 0.03 0.03 0.38 0.67 0.98 0.22 4.66
Metallic Ferrous Ore
6 3 Energy 3.39 0.82 1.44 0.58 2.01 0.49 1.84 2.52 2.02 0.48 1.70
7 67+68 Iron and Steel and 2.00 3.85 1.03 2.78 0.69 1.23 2.69 1.60 4.88 4.61 5.27
Non-Ferrous Metals
8 65+84 Textiles and Clothing 10.75 6.99 6.38 10.75 8.77 9.60 12.92 21.35 12.29 9.87 5.26
9 61+83+85 Hides and Leather 3.13 1.76 1.94 3.58 2.47 1.45 1.28 6.28 2.71 2.69 1.27
10 63+82 Wood Manufactures and Furniture 1.63 1.78 1.27 1.89 2.07 1.87 1.00 1.06 2.01 1.75 0.63
II 64 Paper 1.80 1.49 0.86 1.90 1.10 0.89 2.27 1.10 1.80 1.10 1.26
12 66 Non-Metallic Minera
Manufactures 1.56 2.07 1.28 1.96 1.46 1.06 1.95 1.22 1.80 1.82 1.22
13 5+62 Chemicals and Rubber Products 16.39 12.06 9.91 13.43 7.87 10.39 15.24 9.04 11.33 12.19 15.82
14 69 Metal Products 1.86 4.19 1.90 3.40 1.60 1.60 3.09 2.31 3.06 2.92 1.88
15 7 Machinery and 32.49 44.21 34.33 41.30 34.54 36.48 34.85 35.94 39.60 44.35 44.29
Transportation Equipment
16 81+86+89+9 Miscellaneous Manufactured l::;
Articles 8.59 12.15 11.12 10.06 10.72 11.09 11.10 9.08 8.33 9.33 11.80
First three sectors with
highest shares 15, 13, 8 15, 16, 13 15, 1, 16 15, 13, 8 15, 1, 2 15, 2, 16 15,13,8 15, 8, 16 15, 8, 13 15, 13, 8 15, 13, 16
Central, East European, Baltic and Turkish Economies 345
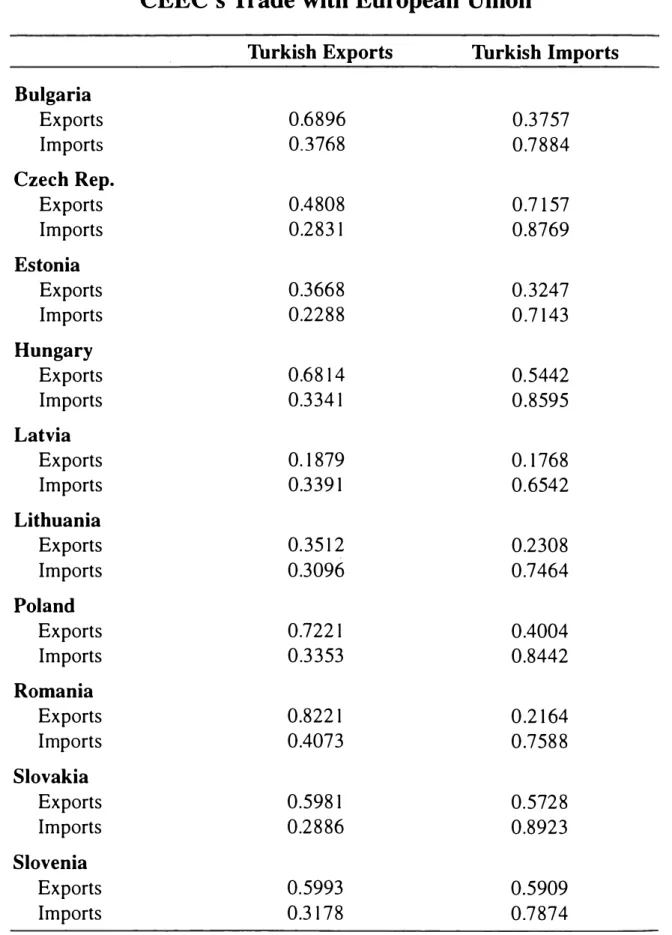
Table 4 shows the coefficient of similarity between the exports and imports of Turkey with those of the countries in transition. The index of sim ilarity is calculated by comparing the export vector x with the import vector m using the formula for the cosine between two vectors:
LXJ mi
a=
...Jfa;m;
where X.1 deljlotes country j 's export of commodity i, XJ refers to total exports
of country j, M.1 j-th c,:ountry's import of commodity i, Mi total imports of
country j, x,' =(�,'IX') is the share of commodity i in country j's total exports,
mi=
(M,' /Iy11) sha,re of commodity i in country j's total imports, x/ = (x', .. , x.') Gountryj's export share vector, and mi= (mi', .. ,m,,') COUljltry j'
&. import share
vector.
The coefficient of similarity varies between zero and one and has a straightforward interpretation. It is equal to one if the two (export and import) vectors are exactly the same. Conversely, the coefficient will equal zero in which case the two vectors are orthogonal if for each commodity exported the corresponding import of the same commodity equals zero, and for each com modity imported the export of commodity equals zero. Examination of the coefficient of similarity in the trading relationship between Turkey and the EU shows that:
• Turkish exports to the EU are similar to those of Romania, Poland, Bulgaria and Hungary to EU. The similarity between Turkish exports to the EU on the one hand, and the exports of the Baltic countries to the EU on the other hand is relatively low.
• Turkish exports to the EU are not similar to the imports of CEE countries from EU.
• Turkish imports from the EU are similar to the exports of Czech Republic to the EU. The similarity between Turkish imports from the EU and the exports of Latvia, Romania and Lithuania is relatively low.
• Turkish imports from the EU are similar to the imports of CEE and Baltic countries imports from the EU.
To analyze the sectors where countries have a comparative advantage, we calculate the index of revealed comparative advantage (RCA) which is given by:
(X IX)
RCA = In( ' ' )
(X�" IX'")
where X. denotes export of commodity i by the country considered, X its total exports, X,'" refers to the total exports of commodity i to the EU from all
346 SUbidey Togan
Table 4: Indexes of Similarity for Turkish Exports to and
Turkish Imports from European Union with
CEEC's Trade with European Union
Turkish Exports Turkish Imports
Bulgaria Exports 0.6896 0.3757 Imports 0.3768 0.7884 Czech Rep. Exports 0.4808 0.7157 Imports 0.2831 0.8769 Estonia Exports 0.3668 0.3247 Imports 0.2288 0.7 143 Hungary Exports 0.6814 0.5442 Imports 0.3341 0.8595 Latvia Exports 0. 1879 0. 1768 Imports 0.339 1 0.6542 Lithuania Exports 0.3512 0.2308 Imports 0.3096 0.7464 Poland Exports 0.7221 0.4004 Imports 0.3353 0.8442 Romania Exports 0.8221 0.2 164 Imports 0.4073 0.7588 Slovakia Exports 0.598 1 0.5728 Imports 0.2886 0.8923 Slovenia Exports 0.5993 0.5909 Imports 0.3178 0.7874
Le�·el t!{ Aggregation: 2-digit S/TC Source: Awlwr '.r rnlculation.
Central, East European, Baltic and Turkish Economies 347
sources excluding the exports of commodity i of the country under consider ation; X'" refers to the total exports to the EU from all sources excluding the total exports of the country under consideration. If this ratio is greater than one, then the country is said to have a comparative advantage in the produc tion of that product relative to the rest of the world. Alternatively, if the RCA is less than unity, then the country is said to have a comparative disadvantage in the production of the said commodity vis-a-vis the rest of the world.
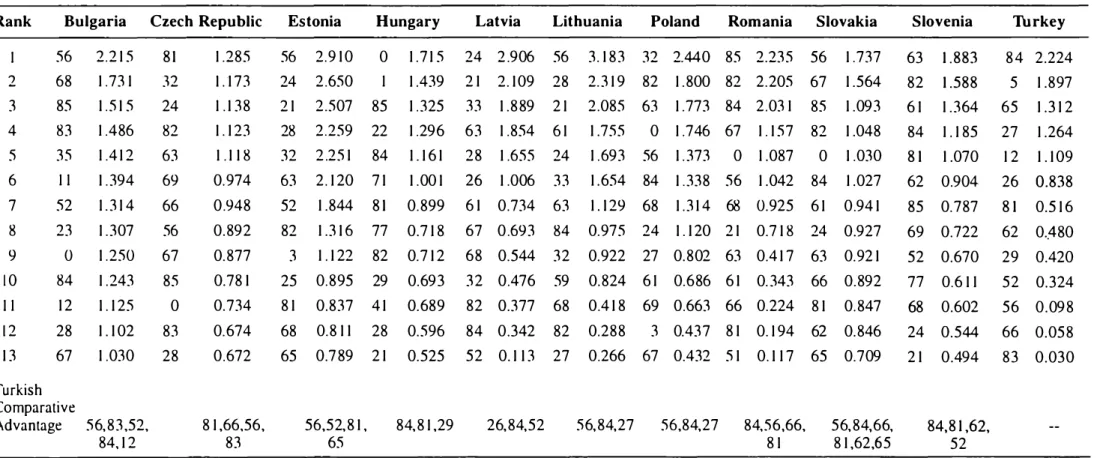
Table 5a shows the thirteen 2-digit SITC commodity groups (see the Appendix for a description of the 2-digit SITC groupings) with the highest RCA values in 1994. The table reveals the following aspects:
• the Czech Republic has a comparative advantage in the production of "sanitary, plumbing and heating" (SITC 8 1) materials, "coal" (SITC 32) and "cork and wood" (SITC 24).
• Hungary has a comparative advantage in the production of "live animals chiefly for food" (SITC 00), "111eat and meat preparations" (SITC O I) and "footwear" (SITC 85).
• Poland has a comparative advantage in "coal" (SITC 32), "furniture" (SITC 82) and "cork and wood manufactures" (SITC 63).
• Bulgaria has a comparative advantage in "manufactured fertilizers" (SITC 56), "non-ferrous metals" (SITC 68) and "footwear" (SITC 85).
• Romania has a comparative advantage in "footwear" (SITC 85),"furni ture" (SITC 82) and "clothing" (SITC 84).
• Turkey has a comparative advantage in "clothing" (SITC 84), "vegetables and fruit" (SITC 5) and "textiles" (SITC 65).
• Comparison of the sectors where the CEE countries enjoy a comparative advantage with those where Turkey has a comparative advantage reveals that both the Czech Republic and Turkey enjoy a comparative advantage in the production of the commodities "sanitary, plumbing and heating" (SITC 8 1 ), "non-metallic mineral manufactures" (SITC 66) and "manu factured fertilizers" (SITC 56); that Hungary and Turkey have a compar ative advantage in "clothing" (SITC 84) and "sanitary, plumbing and heat ing" (SITC 81 ); that Poland and Turkey have a comparative advantage in "manufactured fertilizers" (SITC 56), "clothing" (SITC 84) and "crude fertilizers" (SITC 27); that Bulgaria and Turkey have a comparative advantage in "manufactured fertilizers" (SITC 56), "travel goods" (SITC 83), and "inorganic chemicals"; and that Romania and Turkey have a com parative advantage in the production of "clothing" (SITC 84 ), "manufac tured fertilizers" (SITC 56), and "non-metallic mineral manufactures" (SITC 66).
Table Sa: Thirteen SITC Divisions with Highest RCA Values Computed for Trade with EU During 1994
I
Rank Bulgaria Czech Republic Estonia Hungary Latvia Lithuania Poland Romania Slovakia Slovenia Turkey 56 2.2 1 5 8 1 1 .285 56 2.9 10 0 1 .7 1 5 24 2.906 56 3. 183 32 2.440 85 2.235 56 1.737 63 1 .883 84 2.224 2 68 1.73 1 32 1 . 173 24 2.650 I 1 .439 2 1 2. 109 28 2.3 1 9 82 1 .800 82 2.205 67 1 .564 82 1 .588 5 1 .897 3 85 1.5 1 5 24 1 . 1 38 2 1 2.507 85 1.325 33 1 .889 2 1 2.085 63 1 .773 84 2.03 1 85 1 .093 6 1 1 .364 65 1.3 1 2 4 83 1.486 82 1. 1 23 28 2.259 22 1.296 63 1.854 6 1 1 .755 0 1.746 67 1. 157 82 1 .048 84 1 . 185 27 1.264 5 35 1 .4 1 2 63 1 . 1 1 8 32 2.25 1 84 1 . 16 1 28 1.655 24 1.693 56 1.373 0 1 .087 0 1.030 8 1 1 .070 1 2 1 . 109 6 I I 1.394 69 0.974 63 2. 120 7 1 1.00 1 26 1.006 33 1.654 84 1.338 56 1 .042 84 1 .027 62 0.904 26 0.838 7 52 1 .3 1 4 66 0.948 52 1 .844 8 1 0.899 6 1 0.734 63 1. 1 29 68 1 .3 1 4 68 0.925 6 1 0.94 1 85 0.787 8 1 0.5 16 8 23 1 .307 56 0.892 82 1 .3 1 6 77 0.7 18 67 0.693 84 0.975 24 1 . 120 2 1 0.7 1 8 24 0.927 69 0.722 62 0..480 9 0 1 .250 67 0.877 3 1 . 122 82 0.7 12 68 0.544 32 0.922 27 0.802 63 0.4 1 7 63 0.92 1 52 0.670 29 0.420 10 84 1 .243 85 0.78 1 25 0.895 29 0.693 32 0.476 59 0.824 6 1 0.686 6 1 0.343 66 0.892 77 0.6 1 1 52 0.324 I I 12 1 . 125 0 0.734 8 1 0.837 4 1 0.689 82 0.377 68 0.4 18 69 0.663 66 0.224 8 1 0.847 68 0.602 56 0.098 1 2 28 1 . 102 83 0.674 68 0.8 1 1 28 0.596 84 0.342 82 0.288 3 0.437 8 1 0. 1 94 62 0.846 24 0.544 66 0.058 13 67 1.030 28 0.672 65 0.789 2 1 0.525 52 0. 1 13 27 0.266 67 0.432 5 1 0. 1 1 7 65 0.709 2 1 0.494 83 0.030 Turkish Comparative Advantage 56,83,52, 8 1 ,66,56, 56,52,8 1 , 84,8 1 ,29 26,84,52 56,84,27 56,84,27 84,56,66, 56,84,66, 84,8 1 ,62, 84, 1 2 83 65 8 1 8 1 ,62,65 52
Source: A uthor :, calcullltion.< usinK 2-diKit S/TC trade dlltll from Eurostat. I .:::
Central, East European, Baltic and Turkish Economies 349
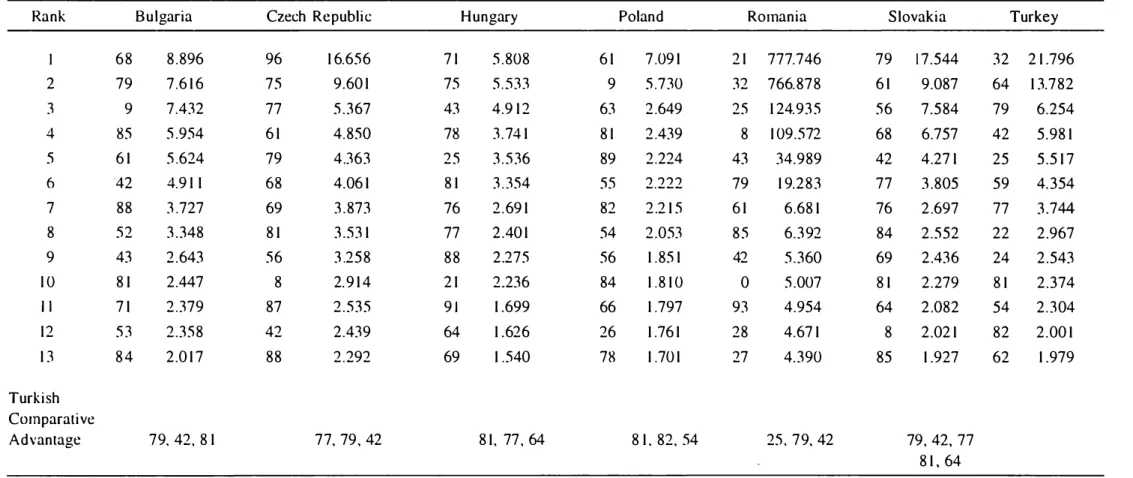
Table 5b identifies the "winning" sectors in each of the countries under consideration. These winning sectors have been identified as those that have experienced the largest growth rates in any one country 's exports during the period 1 988- 1 994. From the table it follows that the winning sectors for Turkey are "coal" (SITC 32) and "paper" (SITC 64), for Hungary "power generating machinery" (SITC 7 1 ) and "office machines" (SITC 75), and for Bulgaria "non-ferrous metals" (SITC 68) and "other transport equipment" (SITC 79) .
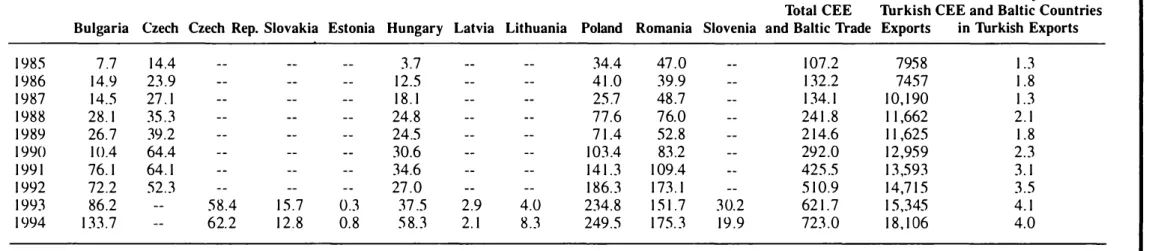
Table 6 shows the trade relations between CEE and B al tic countries on the one hand and Turkey on the other over the period 1 985- 1 994. The table reveals that the exports of Turkey to the CEE and Baltic countries have increased from $ 1 07 million in 1 985 to $ 723 million in 1 994; even with this phenomenal increase of close to seven-fold, the trading relations between these countries and Turkey remain limited: in 1 994 only 4 percent of Turkey's total exports found their way to the markets of the CEE and B altic countries. Similarly, only 3 percent of Turkey's total import bill in 1 994 were account ed for by exports from the CEE countries.
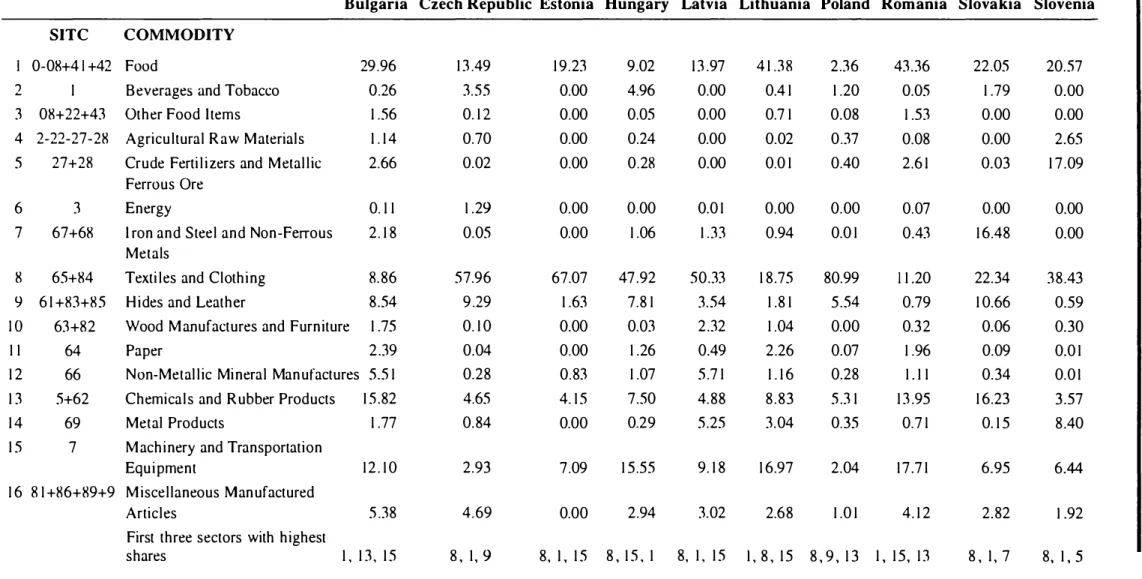
Table 7 gives the commodity composition of trade between CEE countries and Turkey during 1 994. The table reveals that:
• The main export items from Turkey to Poland are "textiles and clothing", "hides and leather" and "chemicals and rubber products". These commodi ties account for 92 percent of all exports to Poland. On the otherhand, Turkey 's main import items that originated from Poland were "machinery and transport equipment", "energy" and "textiles and clothing". These com modities account for 70 percent of all imports from Poland.
• The main export items from Turkey to Romania are "food", "machinery and transport equipment" and "chemicals and rubber products". These commodities accounted for 75 percent of Turkey 's total exports to Romania. On the other hand, the main items that Turkey imported from Bulgaria in 1 994 were "chemicals and rubber products", "energy" and "food". These commodities accounted for 38 percent of all imports from Romania.
• The main export items from Turkey to the Czech Republic in 1 994 were "textiles and clothing", "food" and "hides and leather". These commodi ties accounted for 69 percent of total Turkish exports to the Czech Republ ic. On the other hand, Turkey 's main import items from the Czech Republ ic were "machinery and transport equipment", "chemicals and rub ber products" and "iron and steel and non-ferrous metals". These three commodities accounted for 86 percent of all imports from the Czech Republ ic.
Table Sb: Thirteen SITC Divisions with Highest Export Shares in 1994
I
to Export Shares in 1989 for Trade with EU
0Rank Bulgaria Czech Republic H ungary Poland Romania S lovakia Turkey
68 8.896 96 16.656 71 5.808 61 7.091 21 777.746 79 17.544 32 21.796 2 79 7.616 75 9.601 75 5.533 9 5.730 32 766.878 61 9.087 64 13.782 3 9 7.432 77 5.367 43 4.912 63 2.649 25 124.935 56 7.584 79 6.254 4 85 5.954 61 4.850 78 3.741 81 2.439 8 109.572 68 6.757 42 5.981 5 61 5.624 79 4.363 25 3.536 89 2.224 43 34.989 42 4.271 25 5.517 6 42 4.911 68 4.061 81 3.354 SS 2.222 79 19.283 77 3.805 59 4.354 7 88 3 .727 69 3.873 76 2.691 82 2.215 61 6.681 76 2.697 77 3.744 8 52 3.348 81 3.531 77 2.401 54 2.053 85 6.392 84 2.552 22 2.967 9 43 2.643 56 3.258 88 2.275 56 1.851 42 5.360 69 2.436 24 2.543 10 81 2.447 8 2.914 21 2.236 84 1.810 0 5.007 81 2.279 81 2.374 I I 71 2.379 87 2.535 9 1 1.699 66 1.797 93 4.954 64 2.082 54 2.304 12 53 2.358 42 2.439 64 1.626 26 1.761 28 4.671 8 2.021 82 2.001 13 84 2.017 88 2.292 69 1 .540 78 1.701 27 4.390 85 1.927 62 1.979 Turkish Comparative Advantage 79. 42, 81 77, 79, 42 81. 77, 64 81. 82, 54 25, 79. 42 79. 42, 77 81, 64
I
.:::Table 6: Trade Between Turkey and CEE and Baltic Countries During 1985-1994 (Million US $)
I
EXPORTS
�[
Total Share of Exports to gi
Total CEE Turkish CEE and Baltic Countries
""
Bulgaria Czech Czech Rep. Slovakia Estonia Hungary Latvia Lithuania Poland Romania Slovenia and Baltic Trade Exports in Turkish Exports
...
1 985 7.7 14.4 3.7 34.4 47.0 107.2 7958 1 .3 cl 1 986 14.9 23.9 12.5 4 1.0 39.9 132.2 7457 1 .8 1 987 1 4.5 27. 1 18. 1 25.7 48.7 134. 1 10, 190 1.3 � 1 988 28. 1 35.3 24.8 77.6 76.0 24 1 .8 1 1 ,662 2. 1 0:, 1 989 26.7 39.2 24.5 7 1 .4 52.8 2 14.6 1 1 ,625 1 .8
e..
1 990 1 0.4 64.4 30.6 103.4 83.2 292.0 12,959 2.3 �-1 99 �-1 76. 1 64. 1 34.6 14 1 .3 109.4 425.5 13,593 3. 1 � 1 992 72.2 52.3 27.0 1 86.3 1 73. 1 5 10.9 14,7 1 5 3.5 ;:,,: 1 993 86.2 58.4 1 5.7 0.3 37.5 2.9 4.0 234.8 I 5 1.7 30.2 62 1.7 1 5,345 4. 1 I::>. 1 994 133.7 62.2 12.8 0.8 58.3 2. 1 8.3 249.5 1 75.3 1 9 .9 723.0 18, 1 06 4.0 IMPORTS .:;·Total Share of Imports to
�
Total CEE Turkish CEE and Baltic Countries c:,
Bulgaria Czech Czech Rep. Slovakia Estonia Hungary Latvia Lithuania Poland Romania Slovenia and Baltic Trade Imports in Turkish Imports c:,
1 985 98.7
:w.o
53.6 49.3 63.6 304.2 1 1 ,343 2.7 ;;;· 1986 4 1 .2 67.3 38.2 127.9 109.6 384.2 1 1 , 1 05 3.5""
1 987 9.4 45.9 70.6 62.5 229.4 4 1 7.8 14, 1 58 3.0 1988 15.7 27.8 92.9 78.6 197.9 4 12.9 14,335 2.9 1 989 3.3 72. 1 87.2 98. 1 238.5 499.2 1 5,792 3.2 1 990 3 1 .9 143.4 1 1 0.4 2 1 0.3 202.5 698.5 22,302 3. 1 1 99 1 1 39.9 155.4 133.6 1 50.6 198.6 778. 1 2 1 ,047 3.7 1 992 224.5 183.7 97. 1 86.6 256. 1 848.0 22,870 3.7 1 993 243.2 223.0 2 1.9 3.4 86.7 2.7 13.8 9 1 . 1 300.8 45.9 1 ,032.6 29,429 3.5 1 994 1 95.5 94.7 26.4 1.9 55.5 4.4 7.7 69. 1 228.9 3 1 .6 7 1 5.7 23,270 3. 1Table 7: Commodity Composition of Turkish Exports to and Imports from CEE
I
and Baltic Countries during 1994
NEXPORTS
Bulgaria Czech Republic Estonia Hungary Latvia Lithuania Poland Romania Slovakia Slovenia SITC COMMODITY
0-08+4 I +42 Food 29.96 1 3.49 19.23 9.02 1 3 .97 4 1 .38 2.36 43.36 22.05 20.57 2 I Beverages and Tobacco 0.26 3.55 0.00 4.96 0.00 0.4 1 1 .20 0.05 1 .79 0.00 3 08+22+43 Other Food Items 1 .56 0. 1 2 0.00 0.05 0.00 0.7 1 0.08 1 .53 0.00 0.00 4 2-22-27-28 Agricultural Raw Materials 1 . 1 4 0.70 0.00 0.24 0.00 0.02 0.37 0.08 0.00 2.65 5 27+28 Crude Fertilizers and Metallic 2.66 0.02 0.00 0.28 0.00 0.0 1 0.40 2.6 1 0.03 1 7.09
Ferrous Ore
6 3 Energy 0. 1 1 1 .29 0.00 0.00 0.0 1 0.00 0.00 0.07 0.00 0.00
7 67+68 Iron and Steel and Non-Ferrous 2. 1 8 0.05 0.00 1 .06 1 .33 0.94 0.0 1 0.43 1 6.48 0.00 Metals
8 65+84 Textiles and Clothing 8.86 57.96 67.07 47.92 50.33 1 8.75 80.99 1 1 .20 22.34 38.43 9 6 1 +83+85 Hides and Leather 8.54 9.29 1 .63 7.8 1 3.54 1 .8 1 5.54 0.79 1 0.66 0.59
J O 63+82 Wood Manufactures and Furniture 1 .75 0. 1 0 0.00 0.03 2.32 1 .04 0.00 0.32 0.06 0.30
I I 64 Paper 2.39 0.04 0.00 1 .26 0.49 2.26 0.07 1 .96 0.09 0.0 1
1 2 66 Non-Metallic Mineral Manufactures 5.5 1 0.28 0.83 1 .07 5.7 1 1 . 1 6 0.28 1 . 1 1 0.34 0.0 1 1 3 5+62 Chemicals and Rubber Products 15.82 4.65 4. 15 7.50 4.88 8.83 5.3 1 1 3.95 1 6.23 3.57 1 4 69 Metal Products 1 .77 0.84 0.00 0.29 5.25 3.04 0.35 0.7 1 0. 1 5 8.40
1 5 7 Machinery and Transportation :.:::
Equipment 12. 10 2.93 7.09 1 5.55 9. 1 8 1 6.97 2.04 17.71 6.95 6.44
!
1 6 8 1 +86+89+9 Miscellaneous ManufacturedArticles 5.38 4.69 0.00 2.94 3.02 2.68 1 .0 1 4.1 2 2.82 1 .92 First three sectors with highest
Table 7: Continued
I
IMPORTS :-�
Bulgaria Czech Republic Estonia Hungary Latvia Lithuania Poland Romania Slovakia Slovenia
SITC COMMODITY
...
gi
0-08+4 I +42 Food 3 . 1 5 3 .65 1 7 .22 1 6.7 1 0.00 1 1 . 37 1 .66 1 7 .48 3.97 9 . 9 1 c:l
2 I Beverages and Tobacco 0.00 0.00 0.00 0.0 1 0.00 0.00 0.00 0.00 0.00 0.00
3 08+22+43 Other Food Items 5 . 3 3 0.00 0.00 0.33 0.00 0.00 0.0 1 0.04 0.00 0.02 :3
4 2-22-27-28 Agricultural Raw Materials 9.44 2.93 8 1 .78 2 .42 54.77 3 3 .67 5 . 8 8 6 . 2 2 0.57 0. 1 7
5 27+28 Crude Fert i l i zers and 0.50 0.02 0.00 0.03 0.00 0.00 9 . 5 0.40 0.00 0.00
�-Metal lic Ferrous Ore l:l
6 3 Energy 1 4.74 0.00 0.43 0.05 0.00 0.58 1 9 . 6 1 20.03 0.00 0.00 ;:s !:)..
7 67+68 Iron and Steel and 34.48 5.99 0.00 7.52 4 1 .65 0.00 1 .43 1 3 .99 34.43 20.64 ;::-l
Non-Ferrous Metals
1
.:;·8 65+84 Texti les and Clothing 3.44 2.96 0.00 1 .66 0.00 5.59 1 4.53 5 . 1 6 28.73 24.96
;::-9 6 1 +83+85 H i des and Leat her 0.38 0.00 0.00 0.36 0.00 0.00 0.03 0. 1 9 0. 1 3 1 . 82
1 0 63+82 Wood Manufactures and Furniture 0.22 0.02 0.00 0. 1 4 0.00 0.00 0.00 0.22 ll.04 0. 1 6 ;:s c:,
I I 64 Paper 0.26 0.66 0.00 3 . 8 8 2.97 0.00 2 . 26 0.20 1 .76 1 . 36 Si
�-1 2 66 Non-Metal lic Mineral Manufactures 1 . 37 2 . 1 4 0.00 1 .09 0.00 2. I O 1 .57 2 .69 0.87 0.07 c., 1 3 5+62 Chemicals and Rubber Prod ucts 22.24 6 . 8 1 0.00 1 9.76 0.00 0.00 6.64 28 .79 7.68 4.75
1 4 69 Metal Products 0.28 0.50 0.00 2 . 89 0.00 0.00 0.58 0.5 1 0.06 1 . 1 7
1 5 7 Machinery and ,Transportation
Equi pment 2.78 68.65 0.00 4 1 . 3 1 0.6 1 43.32 35.57 3 .69 2 1 .64 30.92
16 8 1 +86+89+9 M isce l l aneous Manufactured
Articles 1 . 37 5 . 66 0.57 1 . 83 0.00 3 . 3 7 0.67 0.4 1 0. 1 4 4.04
First t hree sectors w i t h highest
I
l;., shares 7, 1 3. 6 1 5 , 1 3, 7 4, I , 1 6 1 5, 1 3, I 4, 7, I I 1 5 , 4, I 1 5 . 6. 8 1 3, 6, I 7, 8, 1 5 1 5, 8 , 7354 Siibidey Togan
Turkey-EU Customs Union Decision and the Europe
Agreements
The Turkey-EU Customs Union Decision (CUD) and the EA represent m ajor contributions to the i n tegration process of CEE and Turkish economies w i th i n Europe . The impl ications of these Agreements are far reaching, going beyond trade-related aspects to include such aspects as the progressive adap tation of the legal framework in the CEE and Baltic countries and Turkey to EU legislation .
Turkey-EU Customs Union
Turkey's appl ication to join the European Econom ic Community (EEC) was made on July 3 1 , 1 959. Fol l owing d i fficult and protracted negotiations, the appl ication ultimately resulted in the signing in Ankara on September 1 2,
1 963 of the Associ ation Treaty. The stated objective of the Agreement i s to promote the conti nuous and bal anced strengthening of trade and economic re lations between the parties, while taking ful l account o f the need to ensure acce lerated development o f the Turkish economy and the need to i mprove the level of employment and l i ving conditions of the Turkish people. According to the Ankara Treaty, the assoc i ation was to be implemented in three phases : a preparatory phase, a transition phase and a fi nal phase.
During the preparatory period, the EEC granted unilateral concessions to Turkey in the form of fi nancial assi stance and preferential tari ffs against Turkey 's tradi tional exports. In the meantime, Turkey did not have to alter i ts trade regime. On May 1 6, 1 967, Turkey lodged in B russels i ts appl ication for negotiations to enter the transition phase . The Addi tional Protocol to the Ankara Treaty was s igned on November 23, 1 970, and became effective on January I , 1 973. The basic aim o f the Addi tional Protocol was the eventual establi shment of a customs union which was eventual l y concl uded on March 6, 1 995. Henceforth, the fi nal phase of the assoc iation process became effec tive fol lowing ratification by the European Parl iament on January I , 1 996.
As of January I , 1 996, goods started to circulate freely between the terri tories of the parties. In add ition, Turkey has adopted of January I , 1 996 the Community's common external tari ff (CET) on goods from third parties and it w i l l embrace by the year 200 1 all of the pre ferential trade agreements the EU has concl uded over time.
Table 8 provides estimates of the nominal protection rates for the years 1 994 and 200 I , by which time all the adjustments req uired by the CUD have been completed . The economy-wide nomi nal protection rate ( NPR) against im ports from the EU was I O percent in 1 994 when weighted by the sectoral
Central, East European, Baltic and Turkish Economies 355
import values, against 22 percent against imports from third countries. Detailed examination of the structure of protection against goods originating from the EU during 1994 reveals that the highest Turkish NPRs were in the sectors of "fruits and vegetables" (72 percent), "alcoholic beverages" (72 per cent) and "non-alcoholic beverages" (57 percent). In the case of trade with third countries we note that during 1994 the highest NPRs were in the sectors "processed tobacco" (100 percent), "alcoholic beverages" (94 percent) and "fruits and vegetables" (73 percent).
Table 8: Turkish Nominal Protection Rates before and after
the Customs Union with EU
1-0 SECTOR NPR with EU NPR with EU NPR with Third Average MFN Average Tariff
CODE in 1994 After Customs Countries in Tariff Rates Rates for GSP
Union 1 994 after Customs Beneficiaries
Union after Customs
Union I Agriculture 4 1 .27 4 1 .26 4 1 .65 4 1 .26 4 1 .26 2 Animal Husbandry 3.48 1 .37 4. 1 8 1 .37 1 .37 3 Forestry 0.01 0.01 0.0 1 0.01 0.0 1 4 Fishery 47.92 47.84 54.08 47.84 47.84 5 Coal Mining 3 .33 0.00 3.33 4.00 0.00 6 Crude Petroleum 0.00 0.00 0.00 0.00 0.00
7 Iron Ore Mining 0.00 0.00 2.22 0.00 0.00
8 Other Metallic Ore Mining 0. 1 3 0.00 1 .2 1 0.00 0.00
9 Non-Metallic Mining 9.09 0.00 1 1 .02 0.95 0.95
1 0 Stone Quarrying 1 .95 0.00 2. 1 8 0.02 0.00
I I S laughtering and Meat 1 0.21 I0.21 1 0.2 1 1 0.2 1 1 0.2 1
1 2 Fruits an d Vegetables 72.49 68.0I 72.62 68.0 1 68.0 1
1 3 Vegetable and Animal Oil 1 6.3 1 1 6.3 1 1 6.38 1 6.29 1 6.29
1 4 Grain Mill Products 4 1 .33 4 1 .02 4 1 .33 4 1 .02 4 1 .02
1 5 Sugar Refining 28.79 28.79 28.79 28.79 28.79
1 6 Other Food Processing 26.47 1 8. 3 1 28.99 1 8. 3 1 1 8.3 1
1 7 Alcoholic Beverages 72. I O 5.25 94.28 1 1 .28 7.35 1 8 Non-Alcholic Beverages 56.92 0.00 69.8 1 1 4.83 0.00 1 9 Processed Tobacco 44.40 0.00 99.9 1 9.40 0.00 20 Ginning 0.00 0.00 2.22 0.72 0.72 2 1 Textiles 2 1 . 1 9 0.00 27. I O 1 7.30 7.60 22 Clothing 1 4.75 0.00 20.65 1 9.90 9.30
23 Leather and Fur Production 7.85 0.00 1 2.57 1 0.20 2.80
24 Footwear 24.40 0.00 35.70 22.50 9. 1 0
25 Wood Products 1 5.25 0.00 1 8.97 2.00 0.05
26 Wood Furniture 26.22 0.00 32.64 5.50 0.00
27 Paper and Paper Products 1 3 .59 0.00 1 7.58 2.70 0.00
28 Printing and Publishing 8.23 0.00 1 0.79 4.52 0.00
29 Fertilizers 8.22 0.00 1 6.38 8. 1 0 0.00
30 Pharmaceutical Production 3.33 0.00 8.99 5.30 0.00
3 1 Other Chemical Production 1 0.79 0.00 1 7.62 8.7 1 0.04
32 Petroleum Refining 22.54 0.00 24.35 2.70 0.00
356
Subidey ToganTable 8: Continued
1-0 SECTOR NPR with EU NPR witH EU NPR with Third Average MFN Average Tariff
CODE in 1994 After Customs Countries in Tariff Rates Rates for GSP
Union 1994 after Customs Beneficiaries
Union after Customs
Union
34 Rubber Products 1 9.57 0.00 23.9 1 5.60 0.03 35 Plastic Products 24.6 1 0.00 3 1 .68 9.90 0.00 36 Glass and Glass Production 1 6.85 0.00 2 1 .94 5.76 0.00 37 Cement 30.45 0.00 32.88 3. 1 4 0.00 38 Non-Metallic Mineral 1 8.33 0.00 23.2 1 5.47 0.00 39 Iron and Steel 8.00 0.00 1 0.70 5.50 3.30 40 Non-Ferrous Metals 4.52 0.00 8.43 3.20 0.50 4 1 Fabricated Metal Products 1 8.36 0.00 25.29 6.00 0. 1 1 42 Non-Electrical Machinery 7.36 0.00 1 2.50 4.40 0.00 43 Agricultural Machinery 6.98 0.00 1 2. 1 8 3.50 0.00 44 Electrical Machinery 9.69 0.00 1 6.64 8.30 0.00 45 Shipbuilding and Repairing 6. 1 3 0.00 1 2.89 0.50 0.00 46 Rai I road Equipment 0.00 0.00 4.61 4.04 0.00 47 Motor Vehicles 27.33 0.00 33. 1 0 9.40 0.00 48 Other Transport Equipment 0.01 0.00 1 .76 1 .60 0.00 49 Other Manufacturing
Industries 2.92 0.00 8. 1 9 2.95 0.00 MEAN 1 0.22 1 .34 22. 1 4 6.92 2.7 1 STANDARD DEVIATION 17.68 1 4.48 1 5.36 1 3.79 1 4.5 1
Source: Author 's calculations.
Own calculations for all sectors in columns I, 2 and 3.
NPRsfor sectors 21, 22, 23, 24, 39 and 40 in column 4 have been obtained from Laird and Yeats (1990);for sectors 25, 26, 27, 30, 34, 35, 42, 44, 45 and 47 from GAIT (/ 993) ; and author 's cal culations for remaining sectors.
The Additional Protocol to the Ankara Treaty divided up the imports of Turkey between two lists. Those industrial products in which it was thought that Turkey could achieve international competitiveness relatively early were placed on the " 12-year list." Other manufactured products were put on a 22-year list, for which a customs union (CU) would not be achieved until 1995. With the formation of the CU with the EU, Turkey has reduced the NPRs to zero on all the commodities that were included in the 12-year and 22-year lists.
Two other sets of products were treated separately: (i) agricultural prod ucts and (ii) products falling within the mandate of the "European Coal and Steel Community" (ECSC). In order to establish freedom of movement of agricultural products, Turkey will have to adjust its policy in such a way as to adopt the EU common agricultural policy (CAP). But as will be explained in more detail, it is most unlikely that the freedom of movement of agricultural
Central, East European, Baltic and Turkish Economies 357
products will be achieved in the near future. Therefore we expect the NPR's on agricultural products to remain unchanged over the next few years. As for the products falling under the ECSC, these were subsequently treated under a "Free Trade Agreement" (FTA) which was signed in December I 995 . The FTA envisions the gradual liberalization of trade in ECSC products over a period of three years. Therefore by the year 200 1 , the NPR's for products included in the 12 and 22-year lists and the ECSC products are projected to be zero. Referring back to Table 8, 38 industries will enjoy zero NPR. After the formation of the customs union, the average nominal protection rate in trade with EU will be reduced to 1 .34 percent. Furthermore, we note that the highest NPR in trade with the EU will affect the following sectors : "fruits and vegetables" (68 percent), "fishery" (48 percent) and "agriculture" (4 1 per cent).
In the case of trade with third parties, a distinction has to be made in respect of trade with member countries of the EFTA, the Mediterranean coun tries, the Central and Eastern European countries, the B altic countries, devel oping countries having the Generalized System of Preferences (GSP) treat ment and the Lome Convention countries. With each of these country groups, EU has concluded preferential trade agreements. Since Turkey after the for mation of the CU will have to apply the Community 's CET and accept all of the preferential agreements the EU has concluded over time, at the latest by 200 I , Turkey in five years will be faced with different sets of tariff rates for different groups of countries. In the case of EFTA countries, CEE countries, the Baltic countries and Israel, which have free trade agreements with the EU, the nominal tariff rates that will be applied by Turkey in the year 200 1 on imports from these countries will be identical to those applied on imports from the EU. Thus the NPR's given in column 2 of Table 8 will have to apply to about 54 percent of imports, which is the average share of Turkish imports from EU, EFTA, CEE and Baltic countries and Israel in total imports during the 1 99 1 - 1 993 period. For these countries, the average tariff will decrease from 22 percent to I percent. The share of developing countries that enjoy preferential access to the Turkish market (through the GSP) is around 28 per cent. Finally the share of countries like the USA, Japan and Canada, - whose exports to the EU face the CET, in Turkish imports is 19 percent. Columns 4 of Table 8 shows the average most favored nation (MFN) tariff rates obtai ned under the assumption that Turkey does not change the NPR's on agricultural commodities . Similarly column 5 of Table 8 shows under the same assump tions the average tari ff rates for GSP beneficiaries. Thus we assume that the tari ff rates Turkey will apply by 200 I will be as shown in columns 2, 4 and 5
of Table 8 . Note that the average NPR for EU countries and for countries that enjoy free trade agreements with the EU will be I percent, for countries like
358 Subidey Togan
USA, Japan and Canada 7 percent and for GSP beneficiaries 3 percent. Table 9 shows the average share of imports from different country groups in total Turkish imports as well as the corresponding Turkish NPR's applica ble on imports from these country groups before and after the formation of the customs union with the EU. The table makes it clear that all of Turkey's trad ing partners stand to benefit from the formation of the CU.
Table 9: Share of Country Groups' Imports in Total
Turkish Imports
Share in
NPR
NPR
Imports 1994 2001
( 1 99 1 - 1 993 Average) (Before CU) (After CU)
EU Countries 46.02 10.22 1.34
Countries EU has FfA with 7.75 22.14 1.34
GSP Countries 27.54 22.14 2.7 1
Countries EU Applies the
MFN Tariffs 18.46 22.14 6.92
Mediterranean Countries l .60 22.14 2.7 1
Source: Author 's calrnlatim1s based 011 Foreign Trade Statistics, State Institute of Statistics, Ankara. Regarding market access for Turkish exports to the EU, we note that the latter had abolished the nominal tariff rates on imports of industrial goods from Turkey on September I , 197 1. However, certain exceptions were made. The Community retained the right to charge import duties on some oil prod ucts over a fixed quota, and to implement a phased reduction of duties on imports of particular textile products originating in Turkey. In addition, trade of ECSC products have been protected by the Community through application of non-tariff barriers (NTBs) and anti-dumping measures. After the year 2001, the NPR applied by the EU on imports of all industrial goods from Turkey including textiles and steel products will be reduced to zero as long as Turkey will fulfill all of its obligations stated in the CUD. This means that Turkey needs to effectively implement the measures regarding "intellectual, industri al and commercial property rights" and "competition policy" including mea sures regarding "public aid". Furthermore, Turkey has to adopt EU garments and textile agreements with third countries. As emphasized above, the market access conditions of the Agreement will not cover the agricultural commodi ties. Finally one should note that in the event of non-fulfillment of obligations by Turkey by the year 200 I, the country will still be faced with anti-dumping and countervailing duty measures. In this case market access restrictions by 200 I would extend from the agricultural commodities to sensitive products
Central, East European, Baltic and Turkish Economies
359
such as textiles, clothing, iron and steel products.
The CUD offers rapid liberalization of trade. But there are some draw backs in the liberalization provided through countervailing duties, anti-dump ing procedures and safeguard measures which are mentioned in Articles 36, 42, 61 of the CUD. Article 36 specifies that as long as a particular practice is incompatible with the competition rules of the CU as specified in Articles 30-32 of the CUD and "in the absence of such rules if such practice causes or threatens to cause serious prejudice to the interest of the other Party or mate rial injury to its domestic industry" the Community or Turkey may take the appropriate measures. Article 42 allows anti-dumping actions as long as Turkey fails to implement effectively the competition rules of the CU and other relevant parts of the acquis communautaire. In those cases, Article 47 of the Additional Protocol signed in 1970 between Turkey and the EC will remain in force. Finally, Article 6 1 is about safeguards which offer another drawback in the liberalization. The Article states that safeguard clauses as specified in Article 60 of the Additional Protocol will remain in effect. According to Article 60 the Community may take necessary protective mea sures if serious disturbances occur in a sector of the economy of the Community or prejudice the external financial stability of one or more Member States, or if difficulties arise which adversely affect the economic sit uation in a region of the Community.
The Europe Agreements
During the 1990s, the CEE and Baltic countries introduced sweeping reforms which changed the nature of their trading regime, and set the stage for their enhanced integration into the world economy. The trade reforms comprised three elements. First, the system of compulsory import and export licenses of the period before 1990 was abolished and with it the state monopoly over for eign trade. Second, current account convertibility of the currencies was intro duced. Finally, nearly all quantitative restrictions on exports and imports were lifted. As a result, the customs tariff has become the primary instrument of foreign trade policy. There were frequent tariff adjustments during the period. Table 10 summarizes the developments in the trade regimes of the countries in transition.
The CEE countries sought support from the EU immediately following the political upheaval in their countries in the late 1980s. Support came in the form of Trade and Co-operation Agreements that were signed during the peri od 1988- 1990. Negotiations for the Association Agreements called the "Europe Agreements" (EA) between the EU on the one side and the Czech, Slovak Federal Republic, Hungary and Poland on the other side started in
360 Subidey Togan
December 1 990 and were signed on December 1 6, 1 99 1 . The Interim Agreements which cover the trade aspects of the Europe Agreements entered into force on March 1 , 1 992. S imilar Agreements with Romania and B ulgaria have been signed during 1 993 and the Interim Agreement with Romania became effective starting May 1 , 1 993 and in the case of B ulgaria starting with February 1 , 1 994. In the meantime all of the above Agreements have been rat ified by national parliaments and the European Parliament. In 1 995, negotia tions with the Baltic countries (Estonia, Latvia, Lithuania) were concluded and the Agreements were signed, and in 1 996 Slovenia followed suit. The last four agreements have not, as of January 1 997, been ratified.
All of the EAs have similar structure and contain between 1 22 and 1 24 Articles. Articles 1 -6 deal with political dialogue and general principles. Articles 7-36 refer to the movement of goods, and Articles 37-5 8 to the move ment of workers and establishment and supply of services. Articles 59-69 cover issues related to movement of capital, competition and approximation of laws. Articles 70- 1 03 refer to economic, cultural and financial co-operation. Articles 1 04- 1 24 contain institutional, general and final provisions. Each EA is accom panied by a set of Annexes and Protocols.
According to the stipulations of the Interim Agreements, a free trade area is to be established at the end of a transitional period of a maximum duration of ten years, divided into two successive stages of five years each, starting from the entry into force of the Agreement (March 1 992). Thus by March 2002 the countries consisting of the Czech Republic, Hungary, Poland, the Slovak Republic and the EU Member States will form a free trade area. On the Community side, the Association Agreements consolidate all the previous uni lateral trade concessions, while laying the ground for the complete removal of all trade obstacles by the end of the transitional period. The trade provisions involve the immediate removal of all quotas on industrial commodities except for textiles and ESCS products, while import tariffs will be progressively elim
inated over a period ranging between 2 and 5 years. The CEE countries will rec iprocate more slowly by phasing out tariffs and quotas over 4 to 9 years. To qualify for concessions under the EA, products must originate in CEE coun tries. The EAs recognize the mineral and agricultural products exported from the CEE countries as commodities originating in CEE countries. For all other commodities the rules of origin require that imported materials from outside of the CEE countries do not exceed 40 percent or 50 percent of the value of the output. In other words, this is a 60 percent local content requirement, which is rather strict. Finally, it should be stressed that the provisions of the EAs provide for a cumulation of origin among the CEE countries.
Table 10: Regimes of the Countries in Transition
CEE Countries Czech Rcpuhlic Slovak Rcpuhl ic Hunga1y Poland Romania Bulgaria Fonner Yugoslavia Slovenia Baltic Countries Estonia Latvia LithuaniaTradeTariff and Non-Tariff Import Barriers Average weighted lariff 5.7 % in 1 993. Qu;mtitative impult
restrictions on some agricultural products. textiles, dothing, steel and coal; licences for oil, gas and weapons.
A I O c;_. sun.:harge tin impuns cstahlishcd in Man:h 1 994 was rem11vcd in August. Average weighted tariff in 1 993 was 5.7 'lt:. Quantitative impon rcstril.:tiuns on some agricultural products. textiles. clothing. steel and coal ;
impmt licenscs for oil, gas and weapons.
Ahuut I O !X· of impons suhject to 4uotil or licensing restrictions. with num her increilsing in 1 994. Average unweightcd tariff changed from 13 % ( 1 989) tu 1 1 '.l· ( 1 99 1 ) to 16 % ( 1 992); funhcr increase in 1 994.
Average weighted tariff 1 1 % on industrial products and 18 % on agricul turill prodm:ts ( 1 993 ). Most quantitative restrictions eliminated in I 990. Quotas on wheat. cars, illcohol, cigars. dgarettcs, engine oil and petrol. Most licensing requirements eliminated in May 1 992. Weighted aver.ige tar iff 1 1 .7 '.l, ( 1 993 ). Restrictions only for arms, drugs ilnd items affecting national health. 30 % anti-dumping duty nn alcohol. vehides, TVs and video-rec..:orders imposed hctween May-Oct. 1 993.
Average tariff from 13 % ( 1 989) tu 1 1 % ( 1 99 1 ) tu 16 % ( 1 992). 22 'h: aver age tariff on industrial goods reponed in 1 994. Minimum prices for tyres and steel pipes. Restrictive impon licences for a limited numhcr of products. Some tariff quotas on processed foods and agricultural products.
Generally tariff free. Where tariffs arc applied rates range up to a maximum of 25 %. Customs formalities tax of I %. Snme quotas on agricultural and textile products (96 i;f_. of products free of quotas).
Only 14 % of imports arc suhjcct to duties ( 10 % for furs, sea and road vehi cles). average weighted tariff 1 .4 % ( 1 993 ). Licences for alcohol and tnhac..: co. No quantitative restrictions. Impon suhsidics aholishcd hcginning of
1 992.
Basic.: tariff 15 % (as of March 1 994), hut many exceptions at 0.5 %-(raw materials, food products); some high agricultural tariffs. Import licensing and quotas for military produclS and tuhacco. Nu impon suhsidics. l mpun tariffs 5- 1 5 (,l-,; higher for food products. alcohul, tohacco and ahuut a dozen manuf.u:tured goods (carrying lariffs up to 25 'H-). No quotas since Oct. 1 993 cxccpl for health and safety reasons.
Sourn: European RanJ.:. fnr Rt>com'!ruc1ion and Development. Transition Report. October / Yf.)4
Export Quotas and other Export Barriers
20 percent llf cxpons n:4uired licensing in 1 992. Expon tax of 1 00 % apfllics only to antiques and an works. Expon licensing for livestlx.:k and plants, some natural re:murccs, and products suc..:h as textiles and steel which arc suhject to 4uotas in other countries.
Expnn licensing for livestock and plants, some natural resources. and pnxJucts such as textiles and steel which arc suhjcct to 4untas in other countries.
Export of fuels. wheat and industrial raw materials suhjcc..:t to licenc..:cs (a linle less than 25 % nf cxporLc;). HO o/r or the agricultural hudget in
1 993 devoted tu cxpolt suhsidics. In 1 992 these amounted In an esti mated 13 o/, of cxpun value.
Minimal export restrictions. Most export suhsidics were eliminated in 1 990.
Export 4untas on raw materials for conservation reasons and drugs fur price support reasons. Occasional cxpon hans on li.xxJ, fruits and wmxJ pnxJucts. Reduced expun licensing rc4uircmcnts since June 1 993. Expnn taxes nn 30 items, mainly foodstuffs. have replaced most cxpon 4uotas. Expon 4uotas on six primary c..:ommnditics. Occ..:asional expon hans lm agricultural products. RegistratiLm :md licensing restrictions still upcrativc.
Tcmpurary expnn duties of I 0-25 o/,. on raw materials. Permit for export or susceptihlc gLx>ds.
M inimal cxpolt harriers. 1 00 o/, cxpolt tax nn antiques and ar1 works. Qumas removed except for export han on gravel and
specialised clay. Most licensing n:4uircmen1s removed Oct. 1 99 1 . No expon suhsidies.
Ex.pon taxes on raw materials, precious metals and anti4ues. Few 4uantitativc restrictions, mostly for health and national sec..:urity rea son,;. No expon suhsidies.
Some cxpult taxes un raw materials and foodstuffs. No cxpon subsi dies. Some quantitative rcstricti1ms. Expon licensing system abolished in July 1 993.
Exchange Regime
Current account convertibility for enterprises, some capii.al eonlrols. Peg 10 DM/USD basket Current account convertibility for enterprises, some capital conlrols. Peg to DM/USD basket. Current account convertib i l i ty (except tourism). Some restrictions remain on capital account. Peg to USD/ECU basket
Largely current account convcrlibility. limiLs (JO residenl capital account Lransactions. Prcannounccd crawling peg regime. Virtual current account convertihility (c:itcepl tourism), but capital controls. Floating e:itchangc rJlC.
Few rcslrictions on current account. heavy controls on capital account. Floating rate.
Full current account convenihility, some rcslrictions on capital account. Floating ex.change rate.
Full current account, virtual capital account convenihility. Currency board with rate fi:itcd
tu DM.
Full current and capital account convertibility. lnfonnal peg to SDR.
Full current and (virtually) capital account converitihility. Currency hoanJ, with rate fixed
to USD. � ;:: �