https://doi.org/10.1177/2515841419899819 https://doi.org/10.1177/2515841419899819 Ther Adv Ophthalmol
2020, Vol. 12: 1–10 DOI: 10.1177/ 2515841419899819 © The Author(s), 2020. Article reuse guidelines: sagepub.com/journals-permissions
Therapeutic Advances in Ophthalmology
journals.sagepub.com/home/oed 1
Introduction
Although hyperopia is one of the most seen refrac-tive errors, a total cycloplegic refraction greater than 5.00 diopters (D) of spherical equivalent is less frequent.1–4 Children with high hyperopia
carry a higher risk of having strabismus and amblyopia.5
Knowledge of normative values of thickness of macula, peripapillary retinal nerve fiber layer (RNFL), macular ganglion cell layer (GCL), and inner plexiform layer (IPL) in high hyperopic
children is of significance for understanding the impact of refractive error upon retinal morphol-ogy and also for interpretation of retinal and optic nerve disorders. It has been reported that detec-tion of the changes in peripapillary RNFL and the ganglion cell complex thicknesses are important methods for observing early anatomical destruc-tion in patients with glaucoma.6–8
Optical coherence tomography (OCT) allows evaluation of retinal morphology noninvasively. Spectral domain optical coherence tomography
Comparison of optical coherence
tomography measurements between high
hyperopic and low hyperopic children
Funda Dikkaya and Sevil Karaman Erdur Abstract
Purpose: To identify the peripapillary retinal nerve fiber layer, total macular, ganglion cell layer, and inner plexiform layer thicknesses in children with high hyperopia using spectral domain optical coherence tomography.
Methods: Twenty-one children with high hyperopia and 20 controls were enrolled in this study. Subjects with spherical equivalent +5.0 D or higher were evaluated in the study group and subject with spherical equivalent between +0.25 and +2.0 D in the control group. The retinal nerve fiber layer thickness, macular thickness, macular ganglion cell layer and inner plexiform layer thicknesses were measured using a spectral domain optical coherence tomography, and results were compared between groups.
Results: The nasal and inferior quadrant and the global retinal nerve fiber layer thickness were significantly thicker in the study group. The mean thickness of inferior quadrant of the inner macula was significantly thicker in the study group than those in the control group. The mean thickness of the ganglion cell layer in nasal, temporal and inferior quadrant of outer macula was significantly thinner in the study group than the control group. The mean thickness of the inner plexiform layer in the inferior quadrant of the inner macula and nasal and inferior quadrant of the outer macula were significantly higher in study group than those in control group.
Conclusion: High hyperopic children had thicker retinal nerve fiber layer when compared to the controls. This difference should be taken into account when evaluating children with glaucoma or other optic disc disorders.
Keywords: ganglion cell layer thickness, high hyperopia, inner plexiform layer thickness, macular thickness, optical coherence tomography, peripapillary retinal nerve fiber layer
Received: 23 August 2019; revised manuscript accepted: 10 December 2019.
Correspondence to:
Funda Dikkaya
Department of Ophthalmology, School of Medicine, Istanbul Medipol University, Bag˘cılar, 34124 Istanbul, Turkey.
fundadikkaya@hotmail. com
Sevil Karaman Erdur
Department of Ophthalmology, School of Medicine, Istanbul Medipol University, Istanbul, Turkey
(SD-OCT) with its higher resolution can be used to assess retinal layers including the macular GCL and IPL besides the peripapillary RNFL and macular thicknesses.9
In several studies RNFL, macular thickness, and macular retinal layer thickness have been investi-gated in the pediatric population with different refractive error, but number of studies with high hyperopic children is limited.6,10–24 Although
thicker RNFL in high hyperopic eyes has been shown, there is no study investigating total macu-lar, GCL and IPL thicknesses in high hyperopic eyes in the literature.15
The purpose of this study was to identify the peri-papillary RNFL, total macular, GCL and IPL thicknesses in school-aged children with high hyperopia using OCT. The correlations between the peripapillary RNFL, total macular, GCL and IPL thicknesses with refractive errors and axial length were also assessed.
Materials and methods
A total of 41 school-aged children were included into the study. Study group consisted of 21 chil-dren (12 boys and 9 girls) with high hyperopia, and control group consisted of 20 children (10 boys and 10 girls) with low hyperopia. The exclu-sion criteria for this study were age above 11 years, an earlier history of ocular surgery or trauma, the presence of amblyopia or strabismus, an astigma-tism greater than 3.0 D, a higher intraocular pres-sure (⩾21 mmHg), glaucomatous optic disc changes, optic disc or retinal disorders, corneal abnormalities, and cooperation deficit during OCT analysis.
A comprehensive ophthalmic examination includ-ing a visual acuity testinclud-ing with Snellen charts, cover test, measurement of intraocular pressure, biomicroscopic and dilated funduscopic exami-nations were performed to all patients. A non-contact tonometer (CT-80; Topcon Co, Tokyo, Japan) was used for intraocular pressure meas-urement. The refractive error value was acquired as the spherical equivalent with cycloplegic refraction. Cycloplegia was done by dropping of cyclopentolate 1% three times with 5 min apart. Autorefraction was performed with an auto ker-ato-refractometer (KR-8900; Topcon Co, Tokyo, Japan) at least 30 min after the last drop. Three sequential measurements were obtained, and the average of them was used for evaluation. Spherical
equivalent value +5.0 D or higher was termed as “High hyperopia,” and from +0.25 to +2.0 D was defined as “Low hyperopia.”25 The anterior
chamber depth and axial length were measured with IOLMaster (version 3.01; Carl Zeiss Meditec, Dublin, CA). One eye of the patients was randomly chosen for the analyses.
After cycloplegic autorefraction, RNFL thick-ness, macular thickthick-ness, macular GCL and IPL thicknesses were measured using an SD-OCT (version 1.10.0.0; Heidelberg Engineering, Heidelberg, Germany). Measurements were per-formed by an experienced technician. We ana-lyzed only high-quality OCT images without evidence of motion artifact or segmentation errors.
The RNFL thickness was obtained by averaging the results from the measurements of three con-secutive circular scans with a diameter of 3.4 mm centered at the optic nerve head and then the thicknesses of the four quadrants (superior, infe-rior, nasal, and temporal) were established based on this.
The macular thickness scan was achieved using the macular cube protocol through the dilated pupil. Specifically, the macula was divided into three rings with diameter of 1 mm (fovea), 3 mm (inner ring), and 6 mm (outer ring). At the same time, the inner and outer rings were separated into superior, nasal, inferior, and temporal quad-rants. The average macular thickness was reported for each of these nine regions (Figure 1).
SD-OCT has a software, which allows the seg-mentation of individual layers of the retina includ-ing the mRNFL, GCL, inner nuclear layer (INL), IPL, outer plexiform layer (OPL), and outer nuclear layer (ONL) (Figure 2). In addition, GCL and IPL results were evaluated for both study and control groups.
All statistical analyses were done using SPSS sta-tistical package for Windows 19 (SPSS for Windows, Chicago, IL, USA). Kolmogorov– Smirnov test was used to control the normality between samples, followed by a Levene test to estimate equal variances. Data between the high and low hyperopic groups were compared using the Mann–Whitney U-test. Spearman rank-order correlation coefficients (R) and 95% confidence intervals were calculated for evaluating the rela-tionship between mean RNFL thickness, macular
thickness, GCL and IPL with the spherical equiv-alence and axial length. Correlation strengths were interpreted using Dancey’s categorization:
R ⩽ 0.10, no association; 0.10 < R ⩽ 0.30, a weak association; 0.30 < R ⩽ 0.60, a moderate associa-tion; and R > 0.60, a strong association. All p val-ues less than 0.05 were considered statistically significant.
Results
Forty one eyes of 41 children were included in our study. There were 21 (51.2 %) high hyperopic eyes in the study group and 20 (48.7 %) low hyperopic eyes in the control group. The mean age of the patients in the study group was 8 ± 2.0 (range 6–11) years and was 7.0 ± 1.0 (range 6–10) years in the control group. Both groups had similar sex and age distribution (p = 0.865 and
p = 0.754, respectively).
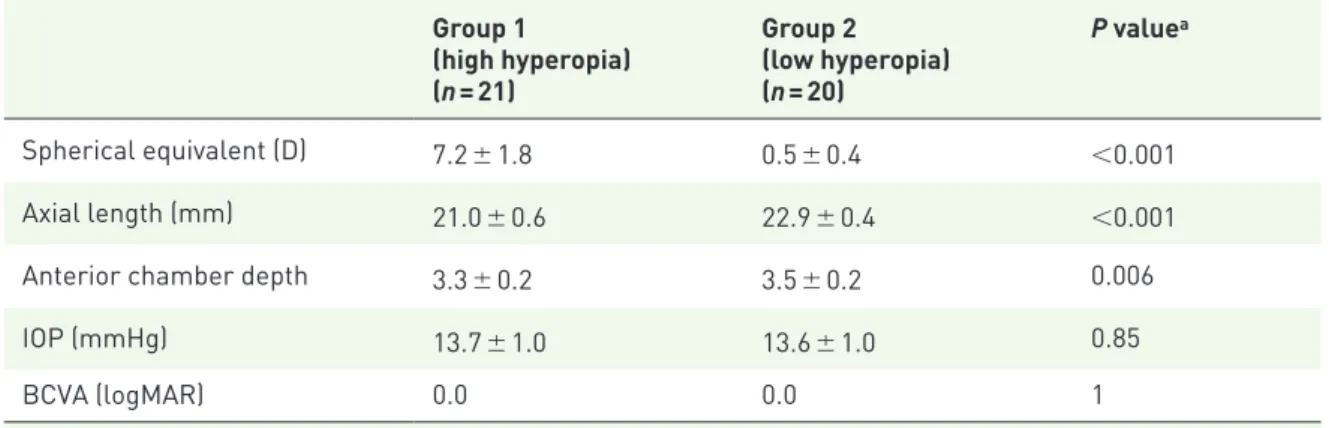
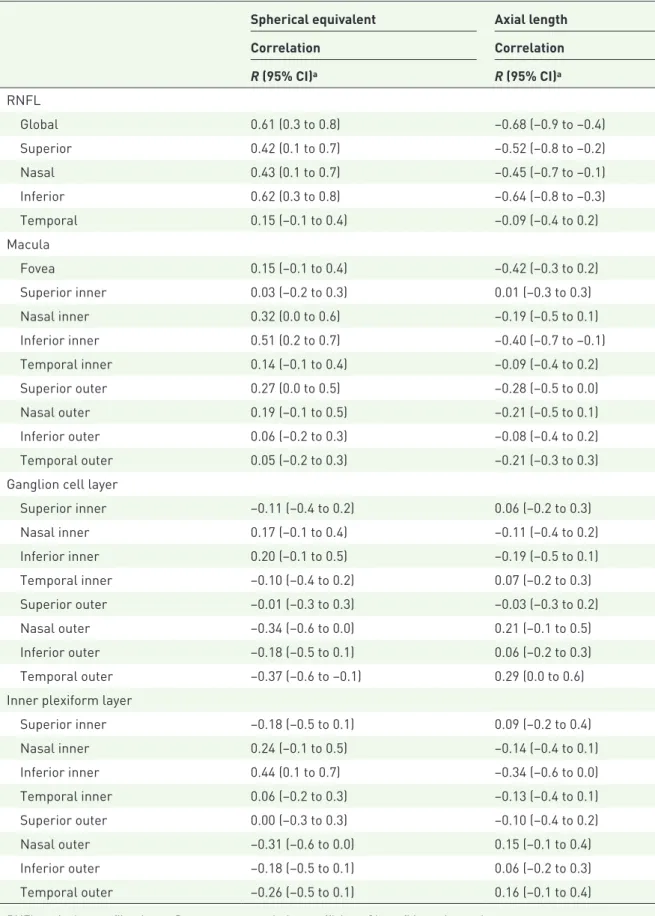
Table 1 presents spherical equivalent, axial length, anterior chamber depth, intraocular pressure, and visual acuity for both groups. The mean global peripapillary RNFL thickness and peripapillary RNFL thickness for superior, inferior, nasal, and temporal quadrants, and the mean thickness of the fovea and the four quadrants of both the inner and the outer macula for both groups are pre-sented in Table 2. The nasal and inferior quad-rant and the global peripapillary RNFL thicknesses were significantly higher in the study group when compared to the control group (p < 0.05). The mean thickness of the inferior quadrant of the inner macula was also significantly higher in the study group (p < 0.05). There were no significant difference in the mean value of the thickness of the fovea and other macular quadrants. Table 3 shows GCL and IPL thicknesses in the four quad-rants of both the inner and the outer macula. The mean thickness of the GCL in the nasal, tempo-ral, and inferior quadrant of the outer macula were significantly lower in study group compared to control group (p < 0.05). The mean thickness of the IPL in the inferior quadrant of the inner macula was significantly thicker in the study group than the control group, and the mean thickness of the IPL in the nasal and inferior quadrant of the outer macula were significantly thinner in the study group when compared to the control group (p < 0.05). Correlation analyses between RNFL, macular thickness, GCL, and IPL thicknesses and spherical equivalent or axial length are shown in Table 4. Inferior quadrant and global RNFL thickness was strongly associ-ated with spherical equivalent and axial length. Superior and nasal quadrant RNFL thickness were moderately associated with spherical equivalent and axial length. Temporal quadrant RNFL thickness was weakly associated with spherical equivalent, and there was no association between temporal quadrant RNFL and axial length. The relationship between the global RNFL and spher-ical equivalent and axial length is demonstrated by a scatter plot (Figure 3). Macular thicknesses in nasal and inferior inner quadrants were Figure 1. Heidelberg SD-OCT image of the macula
showing division of the central macula into nine sectors.
1: fovea, 2: superior inner macula, 3: nasal inner macula, 4: inferior inner macula, 5: temporal inner macula, 6: superior outer macula, 7: nasal outer macula, 8: inferior outer macula, and 9: temporal outer macula.
Figure 2. (a) Single horizontal scan of the macula showing a segmented ganglion cell layer and (b) single horizontal scan of the macula showing inner plexiform layer.
Table 1. Descriptive and ocular parameters of the groups. Group 1 (high hyperopia) (n = 21) Group 2 (low hyperopia) (n = 20) P valuea Spherical equivalent (D) 7.2 ± 1.8 0.5 ± 0.4 <0.001 Axial length (mm) 21.0 ± 0.6 22.9 ± 0.4 <0.001
Anterior chamber depth 3.3 ± 0.2 3.5 ± 0.2 0.006
IOP (mmHg) 13.7 ± 1.0 13.6 ± 1.0 0.85
BCVA (logMAR) 0.0 0.0 1
D, diopter; IOP, intraocular pressure; BCVA, best corrected visual acuity. aMann–Whitney U-test.
Table 2. Comparison of the mean thickness of the peripapillary RNFL, fovea, and the four quadrants of both the inner and the outer macula between the two groups.
Group 1 (high hyperopia) (n = 21) Group 2 (low hyperopia) (n = 20) P valuea Peripapillary RNFL Global RNFL (μm) 113.2 ± 13.1 101.4 ± 7.0 0.00 Superior RNFL (μm) 143.6 ± 26.1 130.9 ± 10.9 0.05 Inferior RNFL (μm) 151.3 ± 23.5 128.2 ± 14.0 0.00 Nasal RNFL (μm) 90.4 ± 19.2 75.9 ± 11.3 0.00 Temporal RNFL (μm) 67.7 ± 7.8 64.4 ± 20.8 0.50 Fovea (μm) 269.4 ± 29.9 267.6 ± 28.3 0.84
Total inner macula
Superior (μm) 342.0 ± 23.8 343.0 ± 12.1 0.87
Nasal (μm) 343.8 ± 15.6 336.7 ± 13.8 0.13
Inferior (μm) 341.9 ± 11.5 328.0 ± 15.3 0.00
Temporal (μm) 327.8 ± 12.8 325.9 ± 11.4 0.61
Total outer macula
Superior (μm) 306.6 ± 13.4 300.4 ± 11.2 0.11
Nasal (μm) 326.3 ± 15.6 323.5 ± 14.2 0.54
Inferior (μm) 298.5 ± 17.1 302.2 ± 18.2 0.51
Temporal (μm) 287.0 ± 11.4 287.6 ± 11.3 0.86
Bold values signify statistical difference. RNFL, retinal nerve fiber layer.
moderately correlated with spherical equivalent, and macular thickness in inferior inner quadrant was moderately correlated with axial length. Discussion
In this study, the differences of peripapillary RNFL, macular thickness, GCL, and IPL
thicknesses in the macula were analyzed between children with high or low hyperopia. The results had shown that, the mean RNFL, the RNFL of inferior and nasal quadrants, and the retinal thick-ness in the inferior quadrant of the inner macula were significantly thicker in children with high hyperopia when compared to children with low hyperopia. Furthermore in the high hyperopic Table 3. Comparison of the thickness of the ganglion cell layer and inner plexiform layer in the four quadrants of both the inner and the outer macula between the two groups.
Group 1 (high hyperopia) (n = 21) Group 2 (low hyperopia) (n = 20) P valuea
Ganglion cell layer Inner macula Superior (μm) 53.1 ± 3.4 54.6 ± 5.2 0.28 Nasal (μm) 52.6 ± 4.4 51.9 ± 4.4 0.60 Inferior (μm) 52.8 ± 3.0 50.7 ± 7.9 0.26 Temporal (μm) 48.0 ± 4.8 49.5 ± 4.8 0.33 Outer macula Superior (μm) 35.0 ± 3.6 35.4 ± 5.3 0.80 Nasal (μm) 38.1 ± 4.3 41.5 ± 4.7 0.02 Inferior (μm) 35.1 ± 5.0 39.1 ± 5.5 0.02 Temporal (μm) 35.1 ± 4.5 39.0 ± 2.8 0.00
Inner plexiform layer Inner macula Superior (μm) 41.4 ± 2.6 42.1 ± 2.9 0.27 Nasal (μm) 42.3 ± 2.2 41.1 ± 2.4 0.08 Inferior (μm) 41.5 ± 2.5 38.7 ± 3.2 0.00 Temporal (μm) 40.5 ± 3.1 40.1 ± 2.7 0.65 Outer macula Superior (μm) 28.4 ± 2.9 28.4 ± 2.1 0.97 Nasal (μm) 29.5 ± 3.3 31.8 ± 3.0 0.03 Inferior (μm) 28.1 ± 3.5 31.0 ± 4.4 0.03 Temporal (μm) 31.6 ± 2.4 33.2 ± 2.5 0.05
Bold values signify statistical difference. aMann–Whitney U-test.
Table 4. Correlations between RNFL, macular parameters, ganglion cell layer, and inner plexiform layer thickness and spherical equivalent or axial length.
Spherical equivalent Axial length
Correlation Correlation R (95% CI)a R (95% CI)a RNFL Global 0.61 (0.3 to 0.8) –0.68 (–0.9 to –0.4) Superior 0.42 (0.1 to 0.7) –0.52 (–0.8 to –0.2) Nasal 0.43 (0.1 to 0.7) –0.45 (–0.7 to –0.1) Inferior 0.62 (0.3 to 0.8) –0.64 (–0.8 to –0.3) Temporal 0.15 (–0.1 to 0.4) –0.09 (–0.4 to 0.2) Macula Fovea 0.15 (–0.1 to 0.4) –0.42 (–0.3 to 0.2) Superior inner 0.03 (–0.2 to 0.3) 0.01 (–0.3 to 0.3) Nasal inner 0.32 (0.0 to 0.6) –0.19 (–0.5 to 0.1) Inferior inner 0.51 (0.2 to 0.7) –0.40 (–0.7 to –0.1) Temporal inner 0.14 (–0.1 to 0.4) –0.09 (–0.4 to 0.2) Superior outer 0.27 (0.0 to 0.5) –0.28 (–0.5 to 0.0) Nasal outer 0.19 (–0.1 to 0.5) –0.21 (–0.5 to 0.1) Inferior outer 0.06 (–0.2 to 0.3) –0.08 (–0.4 to 0.2) Temporal outer 0.05 (–0.2 to 0.3) –0.21 (–0.3 to 0.3)
Ganglion cell layer
Superior inner –0.11 (–0.4 to 0.2) 0.06 (–0.2 to 0.3) Nasal inner 0.17 (–0.1 to 0.4) –0.11 (–0.4 to 0.2) Inferior inner 0.20 (–0.1 to 0.5) –0.19 (–0.5 to 0.1) Temporal inner –0.10 (–0.4 to 0.2) 0.07 (–0.2 to 0.3) Superior outer –0.01 (–0.3 to 0.3) –0.03 (–0.3 to 0.2) Nasal outer –0.34 (–0.6 to 0.0) 0.21 (–0.1 to 0.5) Inferior outer –0.18 (–0.5 to 0.1) 0.06 (–0.2 to 0.3) Temporal outer –0.37 (–0.6 to –0.1) 0.29 (0.0 to 0.6)
Inner plexiform layer
Superior inner –0.18 (–0.5 to 0.1) 0.09 (–0.2 to 0.4) Nasal inner 0.24 (–0.1 to 0.5) –0.14 (–0.4 to 0.1) Inferior inner 0.44 (0.1 to 0.7) –0.34 (–0.6 to 0.0) Temporal inner 0.06 (–0.2 to 0.3) –0.13 (–0.4 to 0.1) Superior outer 0.00 (–0.3 to 0.3) –0.10 (–0.4 to 0.2) Nasal outer –0.31 (–0.6 to 0.0) 0.15 (–0.1 to 0.4) Inferior outer –0.18 (–0.5 to 0.1) 0.06 (–0.2 to 0.3) Temporal outer –0.26 (–0.5 to 0.1) 0.16 (–0.1 to 0.4)
RNFL, retinal nerve fiber layer; R, spearman correlation coefficient; CI, confidence interval.
aCorrelation strengths interpreted using Dancey’s categorization: R ⩽ 0.10, no association; 0.10 < R ⩽ 0.30, a weak association; 0.30 < R ⩽ 0.60, a moderate association; and R > 0.60, a strong association.
group, GCL, and IPL in the nasal, temporal, and inferior quadrant of the outer macula were found to be thinner and IPL in the inferior quadrant of the inner macula was found to be thicker.
Glaucoma is defined as the progressive retinal ganglion cell loss causing optic disc damage and visual field defects.6 Peripapillary RNFL
thick-ness evaluation is an essential procedure for iden-tifying anatomical damage in glaucoma patients. On the contrary, previous studies showed that the diagnostic performance of the ganglion cell com-plex measurement, which is the total of RNFL, GCL, and IPL, is complementary to RNFL measurement, and ganglion cell complex may be able to better detect the type of glaucoma where macular loss occurs early. Thus, using ganglion cell complex in combination with RNFL increases detection rate of glaucoma.7 While RNFL is
formed by retinal ganglion cell axons, GCL includes retinal ganglion cell body and IPL includes retinal ganglion cell dendrites, axons of bipolar cells, and processes of amacrine cells. SD-OCT gives the chance of measuring the reti-nal layers at the macular level including RNFL, GCL, and the IPL.26 Measurements of these
parameters also play an important role in diagno-sis of other optic disc disorders like pseudo-papiledema, optic disc hypoplasia, small or large disk, and other optic neuropathies.27
The diagnosis and monitoring of glaucoma in children is a challenging task due to cooperation problems, which is the reason why rapid, objec-tive, and noninvasive imaging techniques like SD-OCT are important. However, our knowledge
regarding the use of RNFL, GCL, and IPL thick-nesses in children is limited due to the lack of nor-mative database.
In the literature, there are several studies that had evaluated RNFL thickness in children with differ-ent degrees of refractive error. The relationships between thinner RNFL and myopia, and an inverse correlation between RNFL and axial length have been reported by different authors.6,10–13 However Goh and colleagues14
found that superior, inferior, and nasal RNFL thickness were significantly thinner with decreas-ing spherical equivalent and increasdecreas-ing axial length; after adjusting for age and sex, none of the RNFL parameters were correlated with spherical equivalent and axial length contrary to the afore-mentioned findings.
There is limited number of studies with hyper-opic children. Tas and colleagues15 reported that
RNFL is thicker in inferior and nasal quadrants in children with high hyperopia when compared to low hyperopic ones. Kang and colleagues16 also
showed that hyperopic children had a thicker RNFL than emmetropic children and RNFL thickness decreased with increasing axial length. In another study, Lee and colleagues10 reported
that RNFL is thicker in hyperopic children, but when adjusted for age, there was no difference between the emmetropic and hyperopic groups. But Lee and colleagues10 and Kang and
col-leagues16 did not include children with high
hyper-opia in their studies. The findings of this study were similar to the findings from Tas and col-leagues15 study. The nasal and inferior quadrant
and the global peripapillary RNFL thicknesses were significantly higher in the study group. Temporal quadrant RNFL thicknesses were the most similar among groups. It seems that temporal quadrant is the most useful marker in the evalua-tion of the optic nerve disorders based on available normal values in OCT device. Thicker RNFL measurements may cause underestimation of glau-coma diagnosis in high hyperopic children and this normative data may be helpful for diagnosis of optic disc disorders in hyperopic children.
Relationship between macular retinal thickness and refractive error is controversial in the litera-ture. Huynh and colleagues17 showed retinal
thickness increases in central, inner and outer macular regions relatively to the increasing hyper-opia. They also reported that an increase in axial length showed association with a thinner inner and outer macula but not a thinner central mac-ula. Similarly Lim and colleagues18 and Chen and
colleagues19 found that thickness in parafoveal
region decreased with myopia and foveal thick-ness increased with myopia in the studies with myopic children and myopic young adults, respectively. In another study, mean thicknesses of inner and outer macula were thinner in high myopic group compared with low myopic group. However, foveal thickness was not different.13 Jin
and colleagues20 reported lower retinal thickness
in the superior parafoveal and superior and infe-rior perifoveal subfields in myopic children when compared to emmetropic ones. Thinning in peri-foveal and paraperi-foveal quadrants in myopic eyes was common finding in the studies.13,17–20 Jin and
colleagues20 found no significant difference in the
retinal thickness between emmetropes and hyper-opes, but high hyperopic children were not included in their study.
This study is the first study in the literature which compares macular thickness between high hyper-opic and low hyperhyper-opic children. Although retinal thicknesses in most quadrants of both inner and outer macula were thicker in the study group, the difference was only significant in the inferior quad-rant of the inner macula. It has been hypothesized that extending of a similar volume of retina over a larger area is responsible from thinning in inner and outer rings of macula, and myopia-related pathological subfoveal chorioretinal changes cause thickening in the fovea of myopic patients.21,22 So
it might be speculated that similar volume of retina over a smaller area may explain why macula is thicker in more hyperopic patients.
In addition, Borrelli and colleagues28 showed that
amblyopic eyes which were more hyperopic com-pared to controls had increased choriocapillaris vessel density as well as a greater outer parafoveal macular thickness, which may be due to altera-tions in outer retinal maturation.
The number of studies evaluating the relationship between GCL-IPL and refractive error in chil-dren is limited. Totan and colleagues23 reported a
significant negative correlation between GCL-IPL thickness and axial length in children with different refractive errors, but they did not find any relation with spherical equivalent. They thought that exclusion of children with high refractive error (exceeding ±4.0 D in spherical equivalent) from the study might have been rea-son for this result. Also Koh and colleagues24
showed that a thinner GCL-IPL was associated with longer axial length in adult population. Similarly Goh and colleagues14 found that
GCL-IPL thicknesses were negatively correlated with axial length in children with a refractive error between +5 and –10 D. In their study which used swept-source OCT, Jin and colleagues20 reported
thinner inferior parafoveal GCL thickness in hyperopes compared to emmetropes. In this study, there was no significant difference in GCL and IPL thicknesses in most of the quadrants unlike aforementioned studies which used Cirrus high-definition OCT. However, results of this study were similar to Jin and colleagues20 findings
with the thinner nasal, inferior and temporal quadrants in outer macula in the high hyperopic group. The smaller sample size and different OCT devices used for measurements might have been cause for this contradictory result.
Theoretically, the OCT optical system is known to be affected by a magnification factor which may affect any measurement on retinal plane. This magnification difference is affected by the power change due to a change in the axial length as well as the refractive properties of the cornea and lens.29 In the literature, there are studies
investigating the effect of refractive power on OCT measurements by wearing soft contact lenses.30,31 Lee and colleagues30 showed that
RNFL thickness was underestimated with increasing myopic refraction power and overesti-mated with increasing hyperopic refraction power. On the contrary, Abdi and colleagues31
reported that contact lens–induced myopia and hyperopia had no significant effect on foveal thickness, parafoveal thickness, and perifoveal
thickness readings in OCT. Limitation of our study is the lack of compensation of magnifica-tion effect in the analysis of the OCT data. Conclusion
In conclusion, when compared to low hyperopic children, high hyperopic children had thicker RNFL, and RNFL showed a positive correlation with spherical equivalent and negative correlation with axial length. Macular, GCL, and IPL thick-nesses did not show any significant change between the study and control groups in most of the quadrants. When evaluating children with glaucoma or other optic disc disorders, this differ-ence should be taken into account.
Conflict of interest statement
The authors declared no potential conflicts of interest with respect to the research, authorship, and/or publication of this article.
Funding
The authors received no financial support for the research, authorship, and/or publication of this article.
Ethical Statement
This study was approved by the Istanbul Medipol University Institutional Review Board (approval number: 10840098-604.01.01-E.2598) and was in accordance with the tenets in the Declaration of Helsinki. Written informed consent was pro-vided by the parents of the pediatric patients. ORCID iDs
Funda Dikkaya https://orcid.org/0000-0003- 2312-2521
Sevil Karaman Erdur https://orcid.org/0000- 0001-9829-7268
References
1. Katz J, Tielsch JM and Sommer A. Prevalence and risk factors for refractive errors in an adult inner city population. Invest Ophthalmol Vis Sci 1997; 38: 334–340.
2. Wensor M, McCarty CA and Taylor HR. Prevalence and risk factors of myopia in Victoria, Australia. Arch Ophthalmol 1999; 117: 658–663. 3. Attebo K, Ivers RQ and Mitchell P. Refractive
errors in an older population: the Blue Mountains Eye Study. Ophthalmology 1999; 106: 1066–1072.
4. Wang Q, Klein BEK, Klein R, et al. Refractive status in the Beaver Dam Eye Study. Invest
Ophthalmol Vis Sci 1994; 35: 4344–4347.
5. Webber A. Paediatric hyperopia, accommodative esotropia and refractive amblyopia. Clin Exp
Optom 2011; 94: 108–111.
6. Kim MJ, Lee EJ and Kim TW. Peripapillary retinal nerve fibre layer thickness profile in subjects with myopia measured using the Stratus optical coherence tomography. Br J Ophthalmol 2010; 94: 115–120.
7. Tan O, Chopra V, Lu AT, et al. Detection of macular ganglion cell loss in glaucoma by Fourier-domain optical coherence tomography.
Ophthalmology 2009; 116: 2305–2314.e1–e2.
8. Khanal S, Davey PG, Racette L, et al. Comparison of retinal nerve fiber layer and macular thickness for discriminating primary open-angle glaucoma and normal-tension glaucoma using optical coherence tomography.
Clin Exp Optom 2016; 99: 373–381.
9. Mwanza JC, Oakley JD, Budenz DL, et al. Macular ganglion cell-inner plexiform layer: automated detection and thickness reproducibility with spectral domain-optical coherence
tomography in glaucoma. Invest Ophthalmol Vis
Sci 2011; 52: 8323–8329.
10. Lee JW, Yau GS, Woo TT, et al. Retinal nerve fiber layer thickness in myopic, emmetropic, and hyperopic children. Medicine 2015; 94: e699. 11. Rauscher FM, Sekhon N, Feuer WJ, et al. Myopia
affects retinal nerve fiber layer measurements as determined by optical coherence tomography. J
Glaucoma 2009; 18: 501–505.
12. Leung CK, Chan WM, Yung WH, et al. Comparison of macular and peripapillary measurements for the detection of glaucoma: an optical coherence tomography study.
Ophthalmology 2005; 112: 391–400.
13. Lim HT and Chun YB. Comparison of OCT measurements between high myopic and low myopic children. Optom Vis Sci 2013; 90: 1473–1478.
14. Goh JP, Koh V, Chan YH, et al. Macular ganglion cell and retinal nerve fiber layer thickness in children with refractive errors—an optical coherence tomography study. J Glaucoma 2017; 26: 619–625.
15. Tas M, Oner V, Turkcu FM, et al. Peripapillary retinal nerve fiber layer thickness in hyperopic children. Optom Vis Sci 2012; 89: 1009–1013. 16. Kang MT, Li SM, Li H, et al. Peripapillary
association with refractive error in Chinese children: the Anyang Childhood Eye Study. Clin
Exp Ophthalmol 2016; 44: 701–709.
17. Huynh SC, Wang XY, Rochtchina E, et al. Distribution of macular thickness by
optical coherence tomography: findings from a population-based study of 6-year-old children. Invest Ophthalmol Vis Sci 2006; 47: 2351–2357.
18. Lim MC, Hoh ST, Foster PJ, et al. Use of optical coherence tomography to assess variations in macular retinal thickness in myopia. Invest
Ophthalmol Vis Sci 2005; 46: 974–978.
19. Chen S, Wang B, Dong N, et al. Macular measurements using spectral-domain optical coherence tomography in Chinese myopic children. Invest Ophthalmol Vis Sci 2014; 55: 7410–7416.
20. Jin P, Zou H, Zhu J, et al. Choroidal and retinal thickness in children with different refractive status measured by swept-source optical coherence tomography. Am J Ophthalmol 2016; 168: 164–176.
21. Luo HD, Gazzard G, Fong A, et al. Myopia, axial length, and OCT characteristics of the macula in Singaporean children. Invest Ophthalmol Vis Sci 2006; 47: 2773–2781.
22. Zhang Z, He X, Zhu J, et al. Macular
measurements using optical coherence tomography in healthy Chinese school age children. Invest
Ophthalmol Vis Sci 2011; 52: 6377–6383.
23. Totan Y, Gürağaç FB and Güler E. Evaluation of the retinal ganglion cell layer thickness in healthy Turkish children. J Glaucoma 2015; 24: e103–e118.
24. Koh VT, Tham YC, Cheung CY, et al. Determinants of ganglion cell-inner plexiform layer thickness measured by high-definition optical coherence tomography. Invest Ophthalmol
Vis Sci 2012; 53: 5853–5859.
25. Augsburger AR. Hyperopia. In: Amos JF (ed.)
Diagnosis and management in vision care. Boston,
MA: Butterworths, 1987, pp. 101–119. 26. Kim EK, Park HL and Park CK. Segmented
inner plexiform layer thickness as a potential biomarker to evaluate open-angle glaucoma: dendritic degeneration of retinal ganglion cell.
PLoS ONE 2017; 12: e0182404.
27. Pasol J. Neuro-ophthalmic disease and optical coherence tomography: glaucoma look-alikes.
Curr Opin Ophthalmol 2011; 22: 124–132.
28. Borrelli E, Lonngi M, Balasubramanian S,
et al. Increased choriocapillaris vessel density
in amblyopic children: a case-control study.
J AAPOS 2018; 22: 366–370.
29. Sanchez-Cano A, Baraibar B, Pablo LE, et al. Magnification characteristics of the optical coherence tomograph STRATUS OCT 3000.
Ophthalmic Physiol Opt 2008; 28: 21–28.
30. Lee J, Kim NR, Kim H, et al. Negative refraction power causes underestimation of peripapillary retinal nerve fibre layer thickness in spectral-domain optical coherence tomography. Br J Ophthalmol 2011; 95: 1284–1289.
31. Abdi S, Khosravi B, Pakravan M, et al. The effects of contact lens induced myopia and hyperopia on retinal thickness and volume measured by optical coherence tomography.
J Ophthalm Optom Sci 2017; 1: 1–8.
Visit SAGE journals online journals.sagepub.com/ home/oed