https://doi.org/10.1007/s12665-020-8864-1
ORIGINAL ARTICLE
Ecological assessment of heavy metals in soil around a coal‑fired
thermal power plant in Turkey
Ş. Turhan1 · A. M. K. Garad1 · A. Hançerlioğulları1 · A. Kurnaz1 · E. Gören2 · C. Duran3 · M. Karataşlı4 · A. Altıkulaç5 ·
G. Savacı6 · A. Aydın7
Received: 23 October 2018 / Accepted: 17 February 2020 / Published online: 6 March 2020 © Springer-Verlag GmbH Germany, part of Springer Nature 2020
Abstract
In this study, heavy metal concentrations in agricultural surface soil (0–5 cm) samples collected from the area around the Kangal lignite-fired thermal power plant were determined using energy-dispersive X-ray fluorescence spectrometry. Also, the pH values of agricultural soil samples were measured to assess the level of acidification. Geo-accumulation index (Igeo), enrichment factor (EF), contamination factor (CF), contamination degree (CD), modified contamination degree (mCD), and pollution load index (IPL) were estimated to assess the heavy metals pollution in soil samples. The average concentration of Fe, Ti, Mn, Cr, Ni, Zn, Zr, Co, Cu, Pb, As, Sn and Hg was found as 39,065 ± 5096, 2262 ± 738, 721 ± 119, 713 ± 236, 610 ± 199, 82 ± 37, 65 ± 26, 64 ± 19, 29 ± 3, 17 ± 7, 9 ± 7, 3 ± 1 and 2 ± 1 mg kg−1, respectively. The values of pH varied from 7.5 to 8.2 with an average value of 8.0 (moderately alkaline). The Igeo, EF and CF results reveal that the study area is heavily or very highly contaminated with Cr, Ni, and Hg. On the basis of the IPL value, the soil samples are polluted with heavy metals. However, the mCD indicates moderate heavy-metal contamination of the soil samples.
Keywords Soil pollution · Heavy metals · Geo-accumulation index · Enrichment factor · Contamination factor · Pollution load index · Lignite-fired power plant
Introduction
Energy is an essential commodity for economic and techno-logical developments and social life. Turkey is a develop-ing country and demands more energy to sustain economic development and population growth. In 2018, Turkey’s installed electrical power capacity reached 88,526 MW and approximately 68% of the total electricity production was obtained from fossil fuels such as coal (lignite coal 15%, imported coal %11 and hard coal %1) and natural gas (31%) (EPİAŞ 2018). Lignite coal is an important primary energy source in Turkey’s energy production because it is avail-able in abundance, domestic and economic. Turkey’s lignite reserves are estimated to be approximately 17.5 billion tons, which corresponds to approximately 2.1% of the total world coal reserves (MTA 2018). However, Turkish lignite coal has a low quality and contains high concentrations of sulfur, ash, dust, and moisture (Gören et al. 2017). Therefore, the majority of lignite coal produced annually is used to produce electrical energy in thermal power plants (MTA 2018). Tur-key’s installed power capacity of lignite-fired thermal power plants (LFTPPs) was 9.7 GW in February 2018 (TEİAŞ * Ş. Turhan
1 Department of Physics, Science and Letters Faculty,
Kastamonu University, 37150 Kastamonu, Turkey
2 Department of Physics, Science and Letters Faculty,
Cukurova University, 01330 Adana, Turkey
3 Department of Geography, Science and Letters Faculty,
Kastamonu University, 37150 Kastamonu, Turkey
4 Department of Electronics and Communication Engineering,
Faculty of Engineering and Architecture, Beykent University, Sarıyer, İstanbul, Turkey
5 Ula Ali Koçman Vocational School, Muğla Sıtkı Koçman
University, 48640 Ula, Muğla, Turkey
6 Forestry Faculty, Kastamonu University, 37150 Kastamonu,
Turkey
7 Department of Mathematics and Science Education,
Education Faculty, Kastamonu University, 37200 Kastamonu, Turkey
2018). The use of lignite coal as fuel in thermal power plants leads to major environmental problems such as the genera-tion of acid gases (SO2, SO3, NO, and NO2), fly ash, bottom ash and coal slag. Turkish LFTPPs produce more than 13 million tons of fly ash each year (Yüksek and Kaya 2017). Heavy metals contained in fly ash have potential risks for human health and soil and water ecosystems.
Soil is the ultimate target and sinks for environmental contaminants such as heavy metals dispersed in the natural environment by human activities (IAEA-TECDOC 2004). Environmental contaminants entering a soil system through discharge or emissions behave differently from site to site depending on the soil absorption properties, texture, density, humidity, and other factors (IAEA-TECDOC 2004). Heavy metals known as trace metallic elements are naturally occur-ring elements that have a high atomic weight and a density that is at least five times greater than that of water (Tchoun-wou et al. 2012). Heavy metals are also classified as human carcinogens or systemic toxicants according to the Interna-tional Agency for Research on Cancer because heavy metals are known to induce multiple types of organ damages, even at low exposure (Tchounwou et al. 2012).
During the past decade, many researchers have studied the effects of coal-fired thermal power plants (CFTPPs) on the pollution (or contamination) of environmental samples (soil, water, plant, etc.) with heavy metals and/or radionu-clides (Gür and Yaprak 2010; Agrawal et al. 2010; Demaku et al. 2011; Çayır et al. 2012; Lu et al. 2013; Xinwei et al.
2013; Okedeyi et al. 2014; Iruretagoiena et al. 2015; Özkul
2016; Howladar et al. 2016; Noli and Tsamos 2016; Verma et al. 2016; Huang et al. 2017; Zhao et al. 2017; Liu et al.
2017; Ćujić et al. 2017). Gür and Yaprak (2010) investi-gated the effect of radionuclide emission on the environ-ment from Yataǧan, Yeniköy and Kemerköy LFTPPs which are located in southwestern Anatolia of Turkey. They found that the average activity concentrations of 226Ra, 232Th, and 40K in surface soil samples from around these three LFTPPs were within the worldwide intervals reported by UNSCEAR. Agrawal et al. (2010) measured the concentration of Cd, Pb, As and Ni in soil samples collected from around four large CFTPPs in Singrauli region in India using an atomic absorp-tion spectrophotometer (AAS). They found that soils from various selected sites in each direction were largely contami-nated with metals. Demaku et al. (2011) analyzed the con-centrations of heavy metals (Pb, Zn, Cu, Cd, Fe and Ni) in soil, water, sludge and coal ash in the region of two CFTPPs (Kosova A and Kosova B) in Kosova using an inductively coupled plasma optical emission spectrometry (ICP-OES) and AAS. They found that the concentration of heavy met-als in water, sludge, soil, and ash was higher compared to the standards. Çayır et al. (2012) determined the activity concentration of radionuclides and level of heavy metals (Cd, Cr, Cu, Ni, Pb, Zn, Al, and Fe) in soil samples from the
surroundings of Afsin-Elbistan CFTPP in Kahramanmaraş province (Turkey). They found that emissions of A and B units of the CFTPP had enhanced element concentrations in the soil of the surrounding area. Xinwei et al. (2013) deter-mined the concentrations of heavy metals (Cu, Cr, Co, Mn, Ni, Pb, Zn and V) and natural radionuclides (226Ra, 232Th and 40K) in soil samples around Baqiao CFTPP in Xi’an (China) using X-ray fluorescence and gamma-ray spectrom-etry, respectively, and assessed the heavy metal contamina-tion level of soils calculating the pollucontamina-tion load index. They revealed that coal combustion for energy production has affected the natural radioactivity level and heavy metals (Cu, Pb, Zn, Co, and Cr) concentrations of soil around the CFTPP. Okedeyi et al. (2014) determined the concentration of metals (Fe, Cu, Mn, Ni, Cd, Pb, Hg, Cr and Zn) in soil and plant (Digitaria eriantha) samples within the vicinity of three CFTPPs (Matla, Lethabo and Rooiwal) in South Africa using ICP-OES and graphite furnace AAS. They calculated metal pollution index, accumulation factor, enrichment fac-tor, and geo-accumulation index to assess the metal pollution of samples. They indicated that the soils were moderately enriched with metals, exception for Pb. Özkul (2016) inves-tigated the heavy metal pollution of soil samples collected from the close vicinity of Tunçbilek CFTPP in Turkey using an inductively coupled plasma mass spectroscopy (ICP-MS). He estimated geo-accumulation index and enrichment factor to assess heavy metal pollution of soils. He found that the enrichment factors of As, Cr, Hg, Ni and Pb in most of the sampling sites indicated moderate significant to extremely high enrichment in the soils. Howladar et al. (2016) studied the quality of the soil samples taken from different distances from the Barapukuria CFTPP area in Dinajpur (Bangladesh). Noli and Tsamos (2016) analyzed the concentration of As, Βa, Co, Cr, Sr, Sc, Th, U, Zn in soil and water samples from the vicinity of a CFTPP in Northern Greece by using neu-tron activation analysis (NAA). They found that the obtained data in most of the cases did not exceed the normal levels and the investigated area was only slightly contaminated. Verma et al. (2016) investigated the heavy metal (Pb, Ni, Cr, Mn, and Fe) contamination of groundwater samples from site around ash pond of Parichha CFTPP in Jhansi (India) by using AAS. They indicated that the concentrations of heavy metals measured in groundwater samples were above the limits prescribed by WHO for groundwater. Huang et al. (2017) determined the concentrations of Pb, Cd, Hg, As, Cu and Cr in soil and cabbage samples collected from the area surrounding the Jinsha CFTPP in Guizhou Province (China) using an inductively coupled plasma atomic emission spec-trometry (ICP-AES). They indicated that the CFTPP contrib-uted to the Pb, Cd, As, Hg, Cu and Cr pollution in nearby soils, particularly Hg pollution. Liu et al. (2017) analyzed the contents of heavy metals (Hg, Cd, As, Ni, Pb, Cu, Cr and Zn) in soil samples from the near the Xilingol CFTPP in
Inner Mongolia using ICP-MS and assessed the level of soil pollution with heavy metals and ecological risks by calculat-ing potential ecological risk index. They identified three risk categories: (1) Hg and Cd were high-risk heavy metals, (2) Ni, Pb, Cu and Cr were medium-risk heavy metals and (3) Zn was a low-risk heavy metal. Ćujić et al. (2017) measured the concentrations of heavy metals (Cd, Co, Cr, Cu, Fe, Mn, Ni, Pb, V, and Zn) in soil samples which were collected in the vicinity of the largest CFTPP (Nikola Tesla) in Serbia and calculated enrichment factor, geo-accumulation index, contamination factor and pollution load index to assess the soil pollution due to heavy metals. They indicated that operation of the CFTPP had no significant negative impact on the surrounding environment with regard to the content of heavy metals.
As can be seen from the literature review above, the heavy metal contamination of environmental samples from the surroundings of CFTPPs has generally been investigated by determining the concentration of up to nine metals using analytical chemical methods (ICP-OES, ICP-AES, ICP-MS, and AAS) and calculating up to four ecological indices. This study differs from the similar studies in the literature as fol-lows: (1) it is the first detailed study investigating the heavy metal pollution of agricultural soil samples around the Kan-gal LFTPP in which poor-quality lignite coal has been used as fuel, (2) the determination of the concentration of selected thirteen heavy metals (Ti, Cr, Mn, Fe, Co, Ni, Cu, Zn, As, Zr, Sn, Hg and Pb) in one hundred and forty agricultural soil samples collected from the close area of the Kangal LFTPP is performed using an energy-dispersive X-ray fluorescence (EDXRF) spectrometric method and (3) the potential soil pollution due to heavy metals is assessed by estimating six ecological indices (geo-accumulation index, enrichment fac-tor, contamination facfac-tor, contamination degree, modified contamination degree and pollution load index).
Materials and methods
Collection of samples
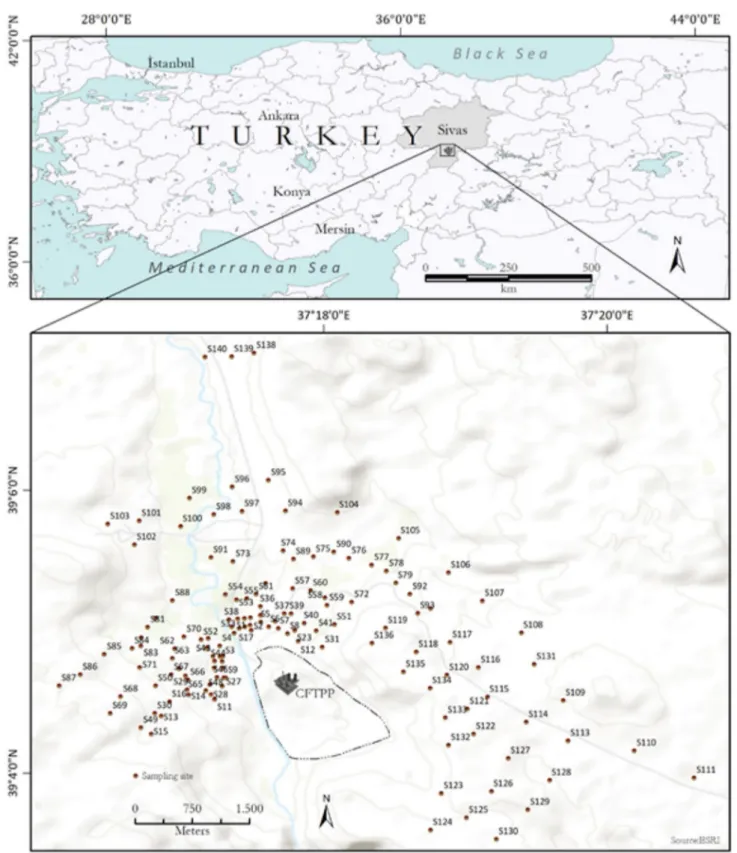
Kangal (39° 14′ 10″ N–37° 23′ 20″ E) is a district of Sivas province in Central Anatolia of Turkey. The Kangal Basin has a very short and cool summer, long and hard winter sea-son, and rainy spring and autumn seasons. Two wind direc-tions dominate the study area: west-northwest (WNW) and east-southeast (ESE). However, the wind intensity belongs to the light wind category (1.6–3.3 m/s). Moderate conditions prevail in the region. The effect of wind around the plant, therefore, remains limited. The Kangal LFTPP is located 25 km southwest of Kangal district at a latitude of 39° 04′ 40″ N and longitude of 37°17′45″ E. Kangal has available lignite coal reserves of 92 million tons. The lignite basin
formed in a Pliocene depositional environment is composed of two coal seams with thicknesses of approximately 10 m (Şen and Saraç 2000). Clay-bearing tuffits with a thickness of 3–5 m occur between these two coal seams (Şen and Saraç
2000). Kangal lignite has an average sulfur content, mois-ture content, calorific value and fly ash fraction of 3, 51%, 1100 kcal/kg and 21%, respectively (Gören et al. 2017). Kangal LFTPP has a total installed capacity of 457 MW and 1811 GW h gross production (Gören et al. 2017). The Kangal LFTPP has been in production for 29 years since 1989. The annual consumption of lignite coal of the Kan-gal LFTPP is approximately 6,832,889 tons. It produced 1,423,843 tons fly ash in 2015 (Gören et al. 2017).
Agricultural surface soil samples were collected from one hundred and forty sites in the northern, eastern and western agricultural areas of the Kangal LFTPP, as shown in Fig. 1. Sampling strategy includes random sampling. Agricultural soil samples were collected to a depth of 5 cm from each site with a stainless steel shovel in April 2015 and October 2016. Each site was recorded using a handheld global posi-tioning system. Each sample of about 2 kg was transported to the sample preparation laboratory in a thick plastic bag. Small stones, sand, grass, and other foreign materials were removed and kept in the laboratory atmosphere.
Sample preparation, pH measurement, and XRF analysis
The following procedure was used for the pH measurement of each soil sample: 10 g of air-dried soil sample was placed into a 50-mL beaker. 25 mL of distilled water was added to the beaker and left for 24 h. The pH was then measured using a pH meter (LaMotte 5 series).
The samples were dried at 110 °C until a constant weight was reached. Then, the soil samples were ground and homogenized manually by means of an agate. Each soil sample of 5 g was transferred into a sample cup which con-sists of a top and a bottom ring, 4-µm prolene foil serving for the sides and the bottom (Wien et al. 2005). Analyses of the major oxides, minor elements and trace heavy metals in the soil samples were performed using EDXRF spectrometer (Spectro Xepos) equipped with a thick binary Pd/Co alloy anode X-ray tube (50 W, 60 kV) (Turhan et al. 2018). The EDXRF spectrometer has an HAPG polarizer to improve the sensitivity to elements in the Na–Cl range and a band-pass filter to improve the performance for element detection in K–Mn range. The EDXRF spectrometer optimizes the excitation using polarization and secondary targets. It has an autosampler for up to 12 items and software modules. The target changer with up to eight polarization and sec-ondary targets offers many different excitation conditions, ensuring the optimal determination of all elements from K to U (Turhan et al. 2018). The EDXRF spectrometer employs
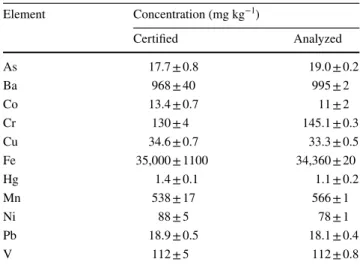
sophisticated calibration techniques such as “standardless” calibration, usually based on the Fundamental Parameters (FP) method. Soil certified reference material (NIST SRM 2709) was used for the quality assurance for the EDXRF
system. The results obtained with the EDXRF system on the certified reference material (NIST SRM 2709) are given in Table 1. The analysis procedures were completed by plac-ing the sample cups prepared for each soil sample into the
automatic sampler and counting them once for 2 h. The over-all uncertainty of the analytical procedure is between 4% and 15%. The detection limit of Ti, Cr, Mn, Fe, Co, Ni, Cu, Zn, As, Zr, Sn, Hg and Pb was determined as 2, 1, 1, 1, 3, 0.5, 0.5, 0.5, 0.5, 1, 2.5, 0.8 and 0.8 mg kg−1, respectively. Ecological parameters
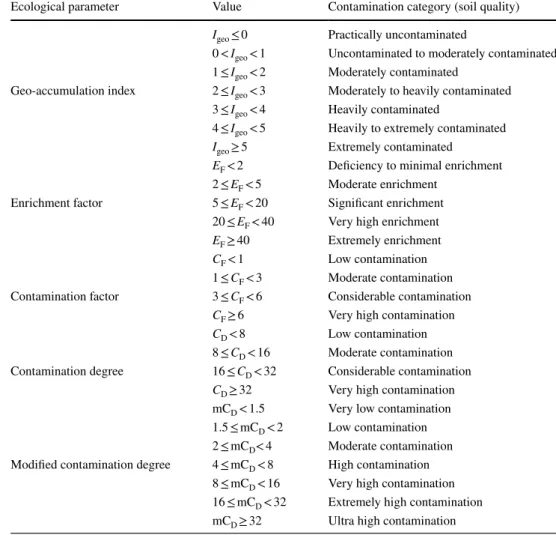
The heavy metal pollution of the soil due to anthropogenic activities can be estimated with different ecological param-eters or pollution indicators such as the geo-accumulation index, enrichment factor, contamination factor, contamina-tion degree, modified contaminacontamina-tion degree, and pollucontamina-tion load index.
The geo-accumulation index (Igeo), which was originally introduced by Muller (1969), was used to assess the degree of heavy metal pollution in the soil samples collected from the study area by comparing preindustrial and current heavy metal concentrations (Muller 1969). The Igeo was estimated using the following equation:
where Cn is the metal concentration of the soil sample, Bn is the average geochemical reference or background value of the earth’s crust, and the constant 1.5 represents natural fluc-tuations because of possible differences in the reference val-ues and very small anthropogenic influences (Özkul 2016; Muller 1969). In estimating this index, Yaroshevsky’s earth composition was taken as reference values (Yaroshevsky
2006). The Igeo values consist of seven categories, as shown in the second row of Table 2.
The enrichment factor (EF) was used to distinguish the anthropogenic metal source from natural process metal (1) I geo=log2 ( C n 1.5 × Bn ) ,
concentrations arising from human activities and to assess the degree of metal contamination (Buat-Menard and Chesselet
1979; Li et al. 2017). The EF was estimated using the following equation based on the standardization of a measured element against a reference element (Özkul 2016; Abanuz 2011):
where Cn is the concentration of any element or metal and
CRef is the concentration of a reference element or metal in the examined environment. On the basis of literature, the enrichment factor is estimated using one of the elements Al, Ca, Sc, Ti, Mn, Fe, Sr and Zr as reference element (Sen-gupta et al. 2010; Özkul 2016; Huang et al. 2017; Ćujić et al.
2017; Abunuz 2011). In this study, the enrichment factor was estimated in reference to Al and Yaroshevsky’s Earth crust composition (Yaroshevsky 2006). The concentration of Al in each soil sample was measured using the EDXRF spectrometer. The EF values consist of five classifications as given in the third row of Table 2.
The contamination factor (CF) can be used for the deter-mination of soil contadeter-mination. The CF is estimated using the following equation (Hakanson 1980):
where Cn is the concentration of each metal measured in the soil samples. The CF values consist of four classifications as given in the fourth row in Table 2.
The contamination degree (CD) was first suggested by Hakanson (1980) to simplify contamination control. The con-tamination degree of the study area was estimated as the sum of the CD estimated for each sample (Hakanson 1980; Dev-anesan et al. 2017):
where CF is the contamination factor given in Eq. (3). The
CD values consist of four classifications as given in the fifth row in Table 2.
The modified contamination degree (mCD) was introduced to assess the overall degree of contamination in a given area and estimated using the following equation (Devanesan et al.
2017): (2) E F= (Cn/ C Ref ) Sample (Cn/ C Ref ) Background , (3) C F= (Cn) Sample (Cn) Background , (4) CD= n ∑ i=1 CFi, (5) mCD= C D n ,
Table 1 Results of the certified soil reference material compared to the certified values
Element Concentration (mg kg−1) Certified Analyzed As 17.7 ± 0.8 19.0 ± 0.2 Ba 968 ± 40 995 ± 2 Co 13.4 ± 0.7 11 ± 2 Cr 130 ± 4 145.1 ± 0.3 Cu 34.6 ± 0.7 33.3 ± 0.5 Fe 35,000 ± 1100 34,360 ± 20 Hg 1.4 ± 0.1 1.1 ± 0.2 Mn 538 ± 17 566 ± 1 Ni 88 ± 5 78 ± 1 Pb 18.9 ± 0.5 18.1 ± 0.4 V 112 ± 5 112 ± 0.8
where CD is the contamination degree given in Eq. (4) and n is the number of analyzed metals. The values of mCD consist of seven classifications as given in the last row in Table 2.
The pollution load index (IPL) was used to assess the metal contamination levels of soil and estimated using the following equation (Ćujić et al. 2017; Lu et al. 2013):
where CF is the contamination factor given in Eq. (3) and n is the number of analyzed metals. If the IPL value estimated for the entire sampling sites in the investigated area is higher than one, the area is polluted with metals.
(6) I PL= n √ √ √ √ n ∏ i CFi,
Results and discussion
pH value and chemical composition of soils in the study area
The pH values of the soil samples varied from 7.5 (slightly alkaline) to 8.2 (moderately alkaline) with an average value of 8.0 (moderately alkaline). The pH values indicate that the soil samples are alkaline.
Descriptive statistics and the earth’s crust averages for major and minor oxides in the soil samples are given in Table 3. The soil samples mainly consist of SiO2, CaO, MgO, Al2O3, and Fe2O3. All minor oxides (Na2O, K2O, TiO2, SO3, P2O5, and Cr2O5) constitute approximately 2% of the soil. The average concentration of SiO2 is approxi-mately two times lower than the earth’s crust average of 53.54%. Such soils generally have a basic rock feature and are clayey and dark-colored. The average concentrations of CaO, MgO and Fe2O3 are 2.2, 1.5 and 5 times higher than the earth’s crust average of 9.41%, 5.44%, and 1.11%, respectively.
Table 2 Ecological parameters
and contamination levels Ecological parameter Value Contamination category (soil quality)
Igeo ≤ 0 Practically uncontaminated
0 < Igeo < 1 Uncontaminated to moderately contaminated
1 ≤ Igeo < 2 Moderately contaminated
Geo-accumulation index 2 ≤ Igeo < 3 Moderately to heavily contaminated
3 ≤ Igeo < 4 Heavily contaminated
4 ≤ Igeo < 5 Heavily to extremely contaminated
Igeo ≥ 5 Extremely contaminated
EF < 2 Deficiency to minimal enrichment
2 ≤ EF < 5 Moderate enrichment
Enrichment factor 5 ≤ EF < 20 Significant enrichment
20 ≤ EF < 40 Very high enrichment
EF ≥ 40 Extremely enrichment
CF < 1 Low contamination
1 ≤ CF < 3 Moderate contamination
Contamination factor 3 ≤ CF < 6 Considerable contamination
CF ≥ 6 Very high contamination
CD < 8 Low contamination
8 ≤ CD < 16 Moderate contamination
Contamination degree 16 ≤ CD < 32 Considerable contamination
CD ≥ 32 Very high contamination
mCD < 1.5 Very low contamination
1.5 ≤ mCD < 2 Low contamination
2 ≤ mCD< 4 Moderate contamination
Modified contamination degree 4 ≤ mCD < 8 High contamination
8 ≤ mCD < 16 Very high contamination
16 ≤ mCD < 32 Extremely high contamination
Heavy metal concentration of the soil samples and pollution assessment
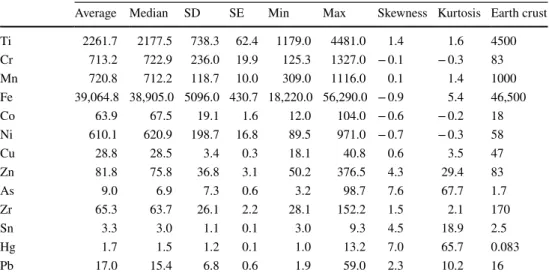
The descriptive statistics and the earth’s crust average for the heavy metal concentrations in the soil samples are given in Table 4. The analyzed average heavy metal concentration is in the order of Fe > Ti > Mn > Cr > Ni > Zn > Zr > Co > Cu > Pb > As > Sn > Hg. The concentration of Cd in the soil sam-ples is below the detection limit of 2 mg/kg. From Table 4, the skewness and/or kurtosis have a negative value which indicates the flat distribution for the heavy metals. Table 5
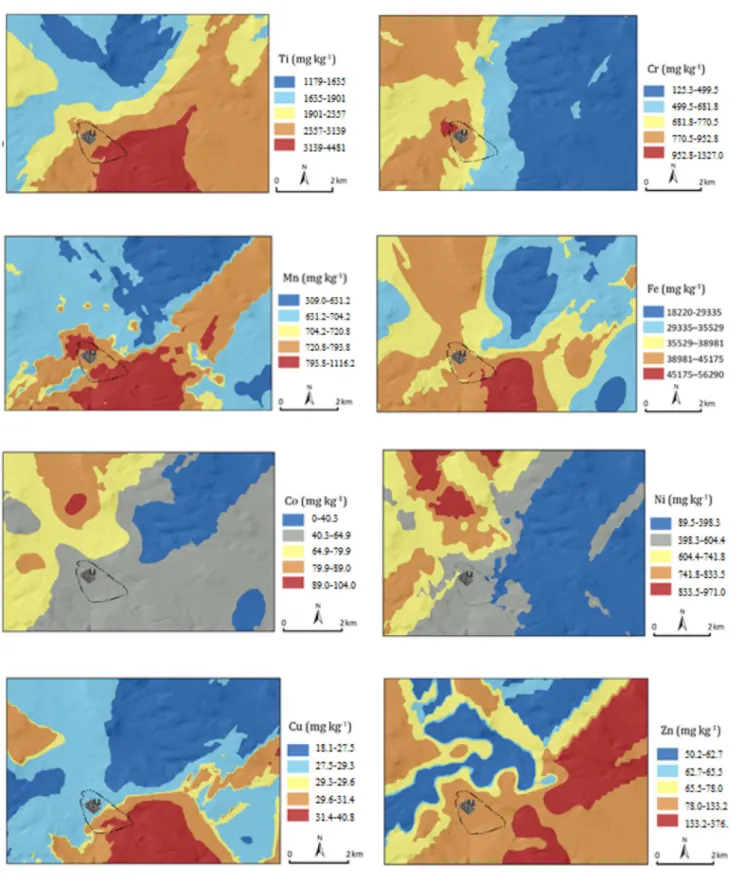
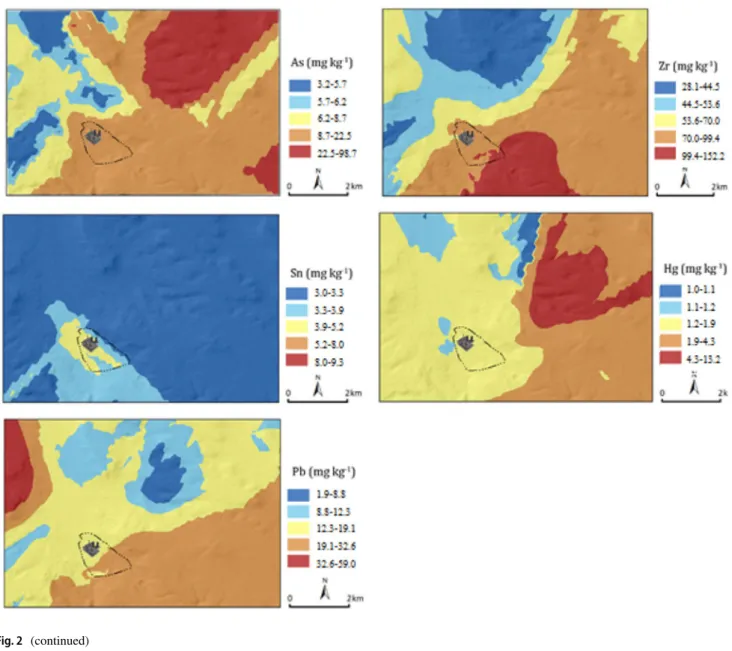
reports the comparison of heavy metal concentration in the study with those reported for CFTPPs in different countries. The spatial distribution maps of heavy metal concentrations in the soil samples obtained by ordinary kriging and the quantile classification method is shown in Fig. 2 (Ćujić et al.
2017).
The values of the Igeo and EF of heavy metals estimated for the soil samples are given in Tables 6 and 7, respectively.
The values of the CF, CD, and contribution of each heavy metal to the average value of CD, mCD and IPL are listed in Table 8.
The titanium (Ti) concentrations in the soil samples varied from 1179.0 (S105 on the north-eastern side) to 4481.0 mg kg−1 (S133 on the eastern side) with an average value of 2261.7 mg kg−1. The average Ti concentration is approximately two times lower than the earth’s crust average of 4500 mg kg−1 (Yaroshevsky 2006). The I
geo values for Ti varied from −2.5 to −0.6 with an average value of −1.6. On the basis of the Igeo values, no contamination was detected. The EF values for Ti varied from 0.6 to 1.8 with an average value of 1.1. The average EF value indicates deficiency to minimal enrichment. The CF values for Ti varied from 0.3 to 1.0 with an average value of 0.5. The average CF value reflects low contamination.
The chromium (Cr) concentrations in the soil samples varied from 125.3 (S106 on the north-eastern side) to 1327.0 mg kg−1 (S26 on the western side) with an average
Table 3 Descriptive statistical data for major and minor oxides in the soil samples
SD standard deviation, SE standard error, N number of sample Concentration (%)
SiO2 CaO MgO Al2O3 Fe2O3 Na2O K2O TiO2 SO3 P2O5 Cr2O5
Average 29.47 21.08 8.41 7.09 5.54 0.74 0.71 0.38 0.23 0.15 0.10 Median 28.77 20.26 8.22 6.47 5.56 0.69 0.63 0.36 0.20 0.14 0.11 SD 6.60 5.17 2.97 2.61 0.80 0.25 0.27 0.12 0.14 0.05 0.03 SE 0.56 0.44 0.25 0.22 0.07 0.02 0.02 0.01 0.01 0.01 0.01 Min 5.65 7.19 2.16 1.49 2.61 0.20 0.26 0.20 0.07 0.09 0.02 Max 55.50 41.95 21.19 19.59 8.05 1.68 1.72 0.75 1.38 0.52 0.19 Skewness 0.47 1.51 0.72 2.00 − 1.03 1.40 1.63 1.37 5.07 3.26 − 0.15 Kurtosis 3.62 4.90 2.53 5.69 4.31 2.47 2.11 1.44 37.24 16.28 − 0.26 N 140 140 140 140 140 140 140 140 140 140 140 Earth’s crust 53.54 9.41 5.44 15.87 1.11 2.66 1.09 0.97 0.05 0.19 –
Table 4 Descriptive statistical data for the heavy metal concentrations of the soil samples
Heavy metal Concentration (mg kg−1)
Average Median SD SE Min Max Skewness Kurtosis Earth crust
Ti 2261.7 2177.5 738.3 62.4 1179.0 4481.0 1.4 1.6 4500 Cr 713.2 722.9 236.0 19.9 125.3 1327.0 − 0.1 − 0.3 83 Mn 720.8 712.2 118.7 10.0 309.0 1116.0 0.1 1.4 1000 Fe 39,064.8 38,905.0 5096.0 430.7 18,220.0 56,290.0 − 0.9 5.4 46,500 Co 63.9 67.5 19.1 1.6 12.0 104.0 − 0.6 − 0.2 18 Ni 610.1 620.9 198.7 16.8 89.5 971.0 − 0.7 − 0.3 58 Cu 28.8 28.5 3.4 0.3 18.1 40.8 0.6 3.5 47 Zn 81.8 75.8 36.8 3.1 50.2 376.5 4.3 29.4 83 As 9.0 6.9 7.3 0.6 3.2 98.7 7.6 67.7 1.7 Zr 65.3 63.7 26.1 2.2 28.1 152.2 1.5 2.1 170 Sn 3.3 3.0 1.1 0.1 3.0 9.3 4.5 18.9 2.5 Hg 1.7 1.5 1.2 0.1 1.0 13.2 7.0 65.7 0.083 Pb 17.0 15.4 6.8 0.6 1.9 59.0 2.3 10.2 16
Table 5 Com par ison of hea vy me tal concentr
ations in soil sam
ples of in ves tig ated ar ea wit h t hose r epor ted f or CFTPPs pr oduction ar eas w or ldwide Hea vy me tal TPP (Countr y) Se yit ömer LFTTP (T ur -key ) Kolaghat CFTTP (India) Afşin- Elbis tan LFTTP (Tur ke y) Baqiao CFTTP (China) Matla CFTPP (Sout h Afr ica) Le thabo CFTPP (Sout h Afr ica) Rooiw al CFTPP (Sout h Afr ica) Tunçbilek LFTPP (Tur ke y)
Xilingol CFTPP (Inner Mon
-golia) Jinsha CFTTP (China) Nik ola T esla CFTTP (Serbia) K ang al LFTPP (Tur ke y) Av er ag e concentr ation (mg k g −1) Cr 356 103 62 99 63 58 70 – 32 53 32 713 Mn 923 1263 – 626 215 187 183 288 – – 610 721 Fe 124,544 – 13 – 1836 1744 1735 – – – 29,030 39,065 Co 86 19 – 18 – – – – – – 13 64 Ni – 55 90 30 32 34 24 558 16 – 56 610 Cu 115 74 30 40 56 40 56 20 8 36 18 29 Zn 65 170 89 125 87 58 75 58 27 – 80 82 As – 3.5 – – – – – 28 13 26 – 9 Hg – – – – 0.1 0.2 0.1 0.6 0.02 0.7 – 1.7 Pb 16 23 27 40 52 19 74 21 12 46 24 17 Ref er ences Güleç e t al. ( 2011 )
Mandal and Sengup
ta ( 2006 ) Ça yır e t al. ( 2012 ) Lu e t al. ( 2013 ) Ok ede yi e t al. ( 2014 ) Ok ede yi et al. (2014 ) Ok ede yi et al. (2014 ) Özk ul ( 2016 ) Liu e t al. ( 2017 ) Huang e t al. ( 2017 ) Ćujić e t al. ( 2017 ) This s tudy
value of 713.2 mg kg−1. The average Cr concentration is approximately nine times higher than the earth’s crust average of 83 mg kg−1; while, the average Cr concentration
is lower than the ultrabasic rocks average of 2000 mg kg−1 (Yaroshevsky 2006). From Table 5, the average Cr concen-tration is higher than those obtained for TPPs in various
Fig. 2 (continued)
Table 6 Geo-accumulation index values of heavy metals estimated for the soil samples
Heavy metal Igeo value Contamination category
Min Max Average
Ti − 2.52 − 0.59 − 1.64 Practically uncontaminated
Cr 0.01 3.41 2.42 Moderately to heavily contaminated
Mn − 2.28 − 0.43 − 1.08 Practically uncontaminated
Fe − 1.94 − 0.31 − 0.85 Practically uncontaminated
Co − 1.17 1.95 1.15 Moderately contaminated
Ni 0.04 3.48 2.70 Moderately to heavily contaminated
Cu − 0.79 − 1.96 − 1.30 Practically uncontaminated Zn − 1.31 1.60 − 0.69 Practically uncontaminated As 0.33 5.27 1.59 Moderately contaminated Zr − 3.18 − 0.74 − 2.06 Practically uncontaminated Sn − 0.32 1.31 − 0.25 Practically uncontaminated Hg 3.01 6.73 3.64 Heavily contaminated Pb − 3.66 1.30 − 0.59 Practically uncontaminated
countries. The Igeo values for Cr varied from 0.01 to 3.41 with an average value of 2.42. The average Igeo value reflects moderate to heavy contamination. The EF values for Cr varied from 4.1 to 37.0 with an average value of 20.1. The average EF value indicates significant to very high enrichment. The CF values for Cr varied from 1.5 to 16.0 with an average value of 8.6. The average CF value
denotes very high contamination. The contribution of Cr to the average contamination degree is 15%.
The manganese (Mn) concentrations in the soil samples varied from 309.0 (S111 on the east side) to 1116.0 mg kg−1 (S132 on the east side) with an average value of 720.8 mg kg−1. The average Mn concentration is lower than the earth’s crust average of 1000 mg kg−1 (Yaro-shevsky 2006). From Table 5, the average Mn concentration is higher than those obtained for Baqiao, Matla, Lethabo, Rooiwal, Tunçbilek, and Nikola TPPs; while, the average Mn concentration is lower than those obtained for Seyitömer and Kolaghat TPPs. The Igeo values for Mn varied from − 2.3 to − 0.4 with an average value of − 1.1. On the basis of the
Igeo values, no contamination was detected. The EF values for Mn varied from 0.7 to 2.0 with an average value of 1.6. The average EF value implies minimal to moderate enrich-ment. The CF values for Mn varied from 0.3 to 1.1 with an average value of 0.7. The average CF value indicates low contamination.
The iron (Fe) concentrations in the soil samples varied from 18,220.0 (S105 on the northeast side) to 56,290.0 mg kg−1 (S116 on the east side) with an average value of 39,064.8 mg kg−1. The average Fe concentration is lower than the earth’s crust average of 46,500 mg kg−1 (Yaroshevsky 2006). From Table 5, the average Fe con-centration is higher than those obtained for Afşin-Elbistan, Matla, Lethabo, Rooiwal and Nikola TPPs; while, the aver-age Fe concentration is lower than that obtained for Sey-itömer TPP. The Igeo values for Fe varied from − 1.9 to − 0.3 with an average value of − 0.9. On the basis of the
Igeo values, no contamination was detected. The EF values for Fe varied from 0.8 to 2.8 with an average value of 1.9.
Table 7 Enrichment factor values of heavy metals estimated for the soil samples
Heavy metal EF value Enrichment level
Min Max Average
Ti 0.3 1.0 0.5 Deficiency to minimal
enrichment
Cr 4.1 37.0 20.1 Very high enrichment
Mn 0.7 2.0 1.6 Deficiency to minimal
enrichment
Fe 0.8 2.8 1.9 Deficiency to minimal
enrichment
Co 1.5 16.2 8.4 Significant enrichment
Ni 4.3 48.8 25.5 Very high enrichment
Cu 0.6 1.9 1.4 Deficiency to minimal enrichment Zn 1.2 4.1 2.1 Moderate enrichment As 14.4 166.0 11.8 Significant enrichment Zr 0.4 1.2 0.8 Deficiency to minimal enrichment Sn 0.9 8.6 3.0 Moderate enrichment Hg 9.4 365.2 46.3 Extremely enrichment Pb 0.3 8.0 2.3 Moderate enrichment
Table 8 Contamination factor,
contamination degree, modified contamination degree and pollution load index
Metal CF value Contamination category Contributions to average
contamination degree (%)
Min Max Average
Ti 0.26 1.00 0.50 Low 0.9 Cr 1.51 15.99 8.59 Very high 15.1 Mn 0.31 1.12 0.72 Low 1.3 Fe 0.39 1.21 0.84 Low 1.5 Co 0.67 5.78 3.55 Considerable 6.2 Ni 1.54 16.74 10.52 Very high 18.4 Cu 0.39 0.87 0.61 Low 1.1 Zn 0.60 4.54 0.99 Low 1.7 As 1.88 58.06 5.29 Considerable 9.3 Zr 0.17 0.90 0.38 Low 0.7 Sn 1.20 3.72 1.31 Moderate 2.3 Hg 12.05 159.04 20.75 Very high 36.4 Pb 0.12 3.69 1.06 Moderate 1.9 CD 21 273 55 Very high
mCD 1.3 17.0 3.4 Moderate degree of contamination
The average EF value indicates minimal to moderate enrich-ment. The CF values for Fe varied from 0.4 to 1.2 with an average value of 0.8. The average CF value denotes low contamination.
The cobalt (Co) concentrations in the soil samples varied from 12.0 (S106 on the northeast side) to 104.0 mg kg−1 (S97 on the north side) with an average value of 63.9 mg kg−1. The average Co concentration is approximately four times higher than the earth’s crust average of 18 mg kg−1; while, the average concentration of Co is lower than the ultrabasic rocks average of 200 mg kg−1 (Yaroshevsky 2006). From Table 5, the average Co concentration is higher than those obtained for Kolaghat, Baqiao and Nikola TPPs; while the average Co concentration is lower than that obtained for Seyitömer TPP. The Igeo values for Co varied from − 1.27 to 1.95 with an average value of 1.15. The average Igeo denotes no to moderate contamination. The EF values for Co varied from 1.5 to 16.2 with an average value of 8.4. The average
EF value denotes moderate to significant enrichment. The CF values for Co varied from 0.7 to 5.8 with an average value of 3.6. The average CF value denotes considerable contamina-tion. The contribution of Co to the average contamination degree is 6%.
The nickel (Ni) concentrations in the soil samples varied from 89.5 (S106 on the north-eastern side) to 971.0 mg kg−1 (S95 on the northern side) with an average value of 610.1 mg kg−1. The average Ni concentration is approxi-mately ten times higher than the earth’s crust average of 58 mg kg−1; while, the average Ni concentration is lower than the ultrabasic rocks average of 2000 mg kg−1 (Yaro-shevsky 2006). From Table 5, the average Ni concentration is higher than those obtained for TPPs in various countries. The Igeo values for Ni varied from 0.04 to 3.48 with an aver-age value of 2.70. The averaver-age Igeo value denotes moderate to heavy contamination. The EF values for Ni varied from 4.3 to 48.8 with an average value of 25.5. The average EF value denotes significant to very high enrichment. The CF values for Ni varied from 1.5 to 16.7 with an average value of 10.5. The average CF value denotes very high contamina-tion. The contribution of Ni to the average contamination degree is 18.4%.
The copper (Cu) concentrations in the soil samples varied from 18.1 (S106 on the north-eastern side) to 40.8 mg kg−1 (S129 on the south eastern side) with an average value of 28.8 mg kg−1. The average Cu concentration is lower than the earth’s crust average of 47 mg kg−1 (Yaroshevsky 2006). From Table 5, the average Cu concentration is higher than those obtained for Tunçbilek, Xilingol and Nikola TPPs while the average Cu concentration is lower than those obtained for Seyitömer, Kolaghat, Baqiao, Matla, Lethabo, Rooiwal, and Jinsha TPPs. The Igeo values for Cu varied from − 0.8 to − 2.0 with an average value of − 1.3. On the basis of the Igeo values, no contamination was detected. The
EF values for Cu varied from 0.6 to 1.9 with an average value of 1.4. The average EF value denotes deficiency to minimal enrichment. The CF values for Cu varied from 0.4 to 0.9 with an average value of 0.6. The average CF value denotes low contamination.
The zinc (Zn) concentrations in the soil samples varied from 50.2 (S105 on the northeast side) to 376.5 mg kg−1 (S131 on the east side) with an average value of 81.8 mg kg−1. The average concentration of Zn is slightly lower than the earth’s crust average of 83 mg kg−1 (Yaro-shevsky 2006). From Table 5, the average Zn concentra-tion is higher than those obtained for Seyitömer, Lethabo, Rooiwal, Tunçbilek, Xilingol, and Nikola TPPs while the average Zn concentration is lower than those obtained for Kolaghat, Afşin-Elbistan, Baqiao and TPPs. The Igeo values for Zn varied from − 1.3 to − 1.6 with an average value of − 0.7. On the basis of the Igeo values, no contamination was detected. The EF values for Zn varied from 1.2 to 4.1 with an average value of 2.1. The average EF value denotes minimal to moderate enrichment. The CF values for Zn varied from 0.60 to 4.5 with an average value of 1. The average CF value denotes low contamination.
The arsenic (As) concentrations in the soil samples vary from 3.2 (S140 on the north-eastern side) to 98.7 mg kg−1 (S106 on the north-eastern side) with an average value of 9.0 mg kg−1. The average concentration of As is approxi-mately five times higher than the earth’s crust average of 1.7 mg kg−1 (Yaroshevsky 2006). From Table 5, the aver-age As concentration is higher than that obtained for Kola-ghat while the average As concentration is lower than those obtained for Tunçbilek, Xilingol and Nikola TPPs. The Igeo values for As varied from 0.3 to 5.3 with an average value of 1.6. The average Igeo value denotes no to moderate con-tamination. The EF values for As varied from 4.4 to 166.0 with an average value of 11.8. The average EF value denotes significant enrichment. The CF values for As varied from 1.9 to 58.1 with an average value of 5.3. The average CF value indicates considerable contamination. The contribution of As to the average contamination degree is 9.3%.
The zirconium (Zr) concentrations of the soil sam-ples varied from 28.1 (S105 on the northeastern side) to 152.2 mg kg−1 (S133 on the eastern side) with an average value of 65.3 mg kg−1. The average Zr concentration is lower than the earth’s crust average of 170 mg kg−1 (Yaroshevsky
2006). The Igeo values for Zr varied from − 3.2 to − 0.7 with an average value of − 2.1. On the basis of the Igeo values, no contamination was detected. The EF values for Zr varied from 0.4 to 1.2 with an average value of 0.8. The average EF value indicates deficiency to minimal enrichment. The CF values for Zr varied from 0.17 to 0.90 with an average value of 0.38. The average CF value denotes low contamination.
The tin (Sn) concentrations of the soil samples varied from 3.0 (S133 on the eastern side) to 9.3 mg kg−1 (S17 on
the western side) with an average value of 3.3 mg kg−1. The average Sn concentration is slightly higher than the earth’s crust average of 2.5 mg kg−1 (Yaroshevsky 2006). The I
geo values for Sn varied from − 0.3 to 1.3 with an average value of − 0.3. On the basis of the Igeo values, no contamination was detected. The EF values for Sn varied from 0.9 to 8.6 with an average value of 3.0. The average EF value denotes minimal to moderate enrichment. The CF value for Sn varied from 1.2 to 3.7 with an average value of 1.3. The average CF value denotes moderate contamination.
The mercury (Hg) concentrations of the soil samples varied from 1.0 (S85 on the western side) to 13.2 mg kg−1 (S107 on the northeastern side) with an average value of 3.3 mg kg−1. The average Hg concentration is significantly higher than the earth’s crust average of 0.083 mg kg−1. From Table 5, the average Hg concentration is higher than those obtained for TPPs in various countries. The Igeo values for Hg varied from 3.1 to 6.7 with an average value of 3.6. The average Igeo value denotes heavy contamination. The EF val-ues for Hg varied from 9.4 to 365.2 with an average value of 46.3. The average EF value denotes very high to extreme enrichment. The CF values for Hg varied from 12 to 159 with an average value of 21. The average CF value indicates very high contamination. The contribution of Hg to the average contamination degree is 36.4%.
The lead (Pb) concentrations of the soil samples varied from 1.9 (S106 on the northeastern side) to 59.0 mg kg−1 (S103 on the northwestern side) with an average value of 17.0 mg kg−1. The average Pb concentration is slightly higher than the earth’s crust average of 16 mg kg−1 (Yaro-shevsky 2006). From Table 5, the average Pb concen-tration is higher than those obtained for Seyitömer and Xilingol TPPs while the average Pb concentration is lower
than those obtained for Kolaghat, Afşin-Elbistan, Baqiao, Matla, Lethabo, Rooiwal, Tunçbilek, Jinsha and Nikola TPPs. The Igeo values for Pb varied from − 0.4 to 1.3 with an average value of − 0.6. On the basis of the Igeo val-ues, no contamination was detected. The EF values for Pb varied from 0.3 to 8.0 with an average value of 2.3. The average EF value reflects minimal to moderate enrichment. The CF values for Pb varied from 0.1 to 3.7 with an aver-age value of 1.1. The averaver-age CF value denotes moderate contamination.
The CD values of all metals estimated for the soil sam-ples varied from 21 to 273 with an average value of 55, indicating that the investigated area is highly contaminated with heavy metals. The mCD values of all metals estimated for the soil samples varied from 1.3 to 17.0 with an aver-age value of 3.4, indicating that the study area is moder-ately contaminated with heavy metals. The IPL values of all metals estimated for the soil samples varied from 0.73 to 3.6 with an average value of 1.66, indicating that the study area is contaminated with heavy metals.
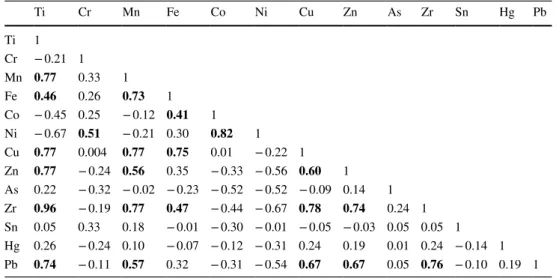
The Pearson correlation coefficient matrix of metals in the soil samples is presented in Table 9. Significant positive correlation coefficients (p ≤ 0.01; higher than 0.4) were obtained for the following metals: Ti versus Mn (0.77), Fe (0.46), Cu (0.77), Zn (0.77), Zr (0.96), Pb (0.74); Cr versus. Ni (0.51); Mn versus Fe (0.73), Cu (0.77), Zr (0.77), Pb (0.57); Fe versus Co (0.41), Cu (0.75), Zr (0.47); Co versus Ni (0.82); Cu versus Zn (0.60), Zr (0.78), Pb (0.67); Zn versus Zr (0.74), Pb (0.67) and Zr versus Pb (0.76). The strong correlation between these metals indicates that the contaminants in the soil samples from the study area have a common source, which origi-nates from lignite coal seams (Ćujić et al. 2017).
Table 9 Pearson correlation coefficient matrix of the heavy metals in soil samples
Bold value indicates significant correlation at p ≤ 0.01
Ti Cr Mn Fe Co Ni Cu Zn As Zr Sn Hg Pb Ti 1 Cr − 0.21 1 Mn 0.77 0.33 1 Fe 0.46 0.26 0.73 1 Co − 0.45 0.25 − 0.12 0.41 1 Ni − 0.67 0.51 − 0.21 0.30 0.82 1 Cu 0.77 0.004 0.77 0.75 0.01 − 0.22 1 Zn 0.77 − 0.24 0.56 0.35 − 0.33 − 0.56 0.60 1 As 0.22 − 0.32 − 0.02 − 0.23 − 0.52 − 0.52 − 0.09 0.14 1 Zr 0.96 − 0.19 0.77 0.47 − 0.44 − 0.67 0.78 0.74 0.24 1 Sn 0.05 0.33 0.18 − 0.01 − 0.30 − 0.01 − 0.05 − 0.03 0.05 0.05 1 Hg 0.26 − 0.24 0.10 − 0.07 − 0.12 − 0.31 0.24 0.19 0.01 0.24 − 0.14 1 Pb 0.74 − 0.11 0.57 0.32 − 0.31 − 0.54 0.67 0.67 0.05 0.76 − 0.10 0.19 1
Conclusions
This study was carried out to assess the environmental consequence of the operation of the Kangal LFTTP in Sivas province of Turkey, with regard to the acidification and heavy metals in soils. For this assessment, (1) a total of 140 agricultural soil samples were collected around Kangal LFTPP using random sample technique, (2) the pH value was measured for each soil sample, (3) major, minor and trace element concentration were analyzed for of each soil sample and (4) the geo-accumulation index, enrich-ment factor, contamination factor, contamination degree, modified contamination degree and pollution load index were estimated for each soil samples.
The random sample technique used may have some advantages and disadvantages compared to other sample techniques (directed random composite sampling, bench-mark sampling, landscape-directed benchbench-mark sampling, and grid sampling), but the use of a repeatable technique is crucial to monitoring soil pollution. Furthermore, random selection of 140 samples without any sample size calcula-tion can be regarded as one of the limits of this study.
The average pH of the soil samples was measured as 8.0. This pH value shows that the investigated area is of moderate alkaline. In this case, the investigated area was not affected by the acid gases emitted from the Kangal LFTPP to the atmosphere.
The concentrations of selected thirteen heavy metals (Ti, Cr, Mn, Fe, Co, Ni, Cu, Zn, As, Zr, Sn, Hg, and Pb) were analyzed using EDXRF spectrometry which is a com-mon method for highly accurate and reproducible non-destructive element analyses. The average Cr, Co, Ni, As, Sr, Sn, Hg and Pb concentrations are higher than those reported for the earth crust. The average concentration of Cr, Mn, Fe, Co, Ni, Cu, Zn, As, Hg and Pb is in agreement with heavy metal concentrations obtained for some coal (or lignite)-fired TPPs in the world using different analyti-cal methods ICP-AES, ICP-OES, ICP-MS, etc. Although EDXRF technique includes some advantages such as easy sample preparation and instrument operation, the detection limits determined for elements are high compared to other instrumental techniques such as ICP-AES, ICP-OES, and ICP-MS.
On the basis of the geo-accumulation, enrichment factor and contamination degree index for these metals, the soil samples from the study area are heavily contaminated with Cr, Ni, and Hg. On the basis of the average contamina-tion degree index of 273, the degree of contaminacontamina-tion of the soil samples is very high. When the average value of the modified contamination degree modified index of 17.0 is taken into account, the pollution in the soil is moder-ate. As a result, the soil samples are contaminated with
heavy metals when the average value of the pollution load index is taken into consideration. Since the heavy metal concentrations of the agricultural area around the Kangal LFTTP are not known before the installation of the plant, taking the average values of earth crust as a reference or background value may be the negative aspect of the heavy metal pollution assessment method.
Consequently, the data obtained in this study can be used as a valuable database or guiding information or reference point for monitoring the eco-toxic metals pollution for the next decades. Based on this study, it can be investigated how the eco-toxic metal accumulation in the agricultural area around the thermal power plant is dependent on soil parameters and how this pollution changes with soil pro-file. In the last decade, new lignite deposits including fertile agricultural lands in Turkey and the private sector is encour-aged to establish a new thermal power plants to areas where the lignite deposits. In this case, the number of lignite-fired thermal power plants will increase rapidly in the next dec-ade. From this perspective, this study raises an awareness of the negative impacts of thermal power plants on the environment.
Acknowledgements This study was carried out within the framework of a doctoral thesis conducted at Kastamonu University. Elemental analyses were performed at Kastamonu University Central Research Laboratory.
References
Abanuz YG (2011) Heavy metal contamination of surface soil Gebze industrial area Turkey. Microchemical J 99:82–92
Agrawal P, Mittal A, Prakash R, Kumar M, Singh TB, Tripathi SK (2010) Assessment of contamination of soil due to heavy met-als around coal fired thermal power plants at Singrauli region of India. Bull Environ Contam Toxicol 85:2019–2223
Buat-Menard P, Chesselet R (1979) Variable influence of the atmos-pheric flux on the trace element chemistry of oceanic suspended matter. Earth Planet Sci Lett 42:399–411
Çayır A, Belivermiş M, Kılıç Ö, Coşkun M, Coşkun M (2012) Heavy metal and radionuclide levels in soil around Afşin-Elbistan coal-fired thermal power-plant. Environ Earth Sci 67:1183–1190 Ćujić M, Dragović S, Dordević M, Dragović R, Gajić B (2017) Reprint
Environmental assessment of heavy metals around the largest coal fired power plant in Serbia. CATENA 148:26–34
Demaku S, Shehu I, Jusufi S, Arbneshi T, Dobra B (2011) Heavy metals in coal ash, soil, water and sludge near the two coal-fired power stations in Kosova. J Int Environ Appl Sci 6(3):412–416 Devanesan E, Gandhi MS, Senthilkumar Selvapandiyan M, Ravisankra
R (2017) Heavy metal and potential ecological risk assessment in sediments collected from Poombuhar to Karaikal coast of Tamil-nadu using energy dispersive X-ray fluorescence (EDXRF) tech-nique. Beni-Suef Univ J Appl Sci 6:285–292
EPİAŞ (2018) Web page. http://kojen turk.org/uploa ds/dokum anlar /
Epias _2018_Yilli k_Bulte ni_pdf.
Gören E, Turhan Ş, Kurnaz A, Garad AMK, Duran C, Uğur FA, Yeğingil Z (2017) Environmental evaluation of natural
radioactivity in soil near a lignite-burning power plant in Turkey. Appl Radiat Isot 129:13–18
Güleç N, Günal BÇ, Erler A (2011) Assessment of soil and water contamination around an ash-disposal site: a case study from the Seyitömer coal-fired power plant in western Turkey. Environ Geol 40(3):331–344
Gür F, Yaprak G (2010) Natural radionuclide emission from coal-fired power plants in the southwestern of Turkey and the population exposure to external radiation in their vicinity. J Environ Sci Health A 45(14):1900–1908
Hakanson L (1980) An ecological risk index for aquatic pollution con-trol. A sedimentological approach. Water Res 141:975–1001 Howladar MF, Ahmed T, Deb PK, Shine FMM, Rahman MA (2016)
Analysing the top soil chemistry for environments around the Barapukuria thermal power plant, Bangladesh. Int J Sci Eng Res 7(12):146–150
Huang X, Hu J, Qin F, Quan W, Cao R, Fan M, Wu X (2017) Heavy metal pollution and ecological assessment around the Jinsha coal-fired power plant (China). Int J Environ Res Public Health 14(12):1–12
IAEA-TECDOC-1415 (2004) Soil sampling for environmental con-taminants. IAEA, Vienna
Iruretagoiena AR, Vallejuelo SFO, Gredilla A, Ramos CG, Oliveira MLS, Arana G, Diego A, Madariaga JM, Silva LFO (2015) Fate of hazardous elements in agricultural soils surrounding a coal power plant complex from Santa Catarina (Brasil). Sci Total Envi-ron 508:374–382
Li HH, Chen LJ, Yu L, Guo ZB, Shan CQ, Lin JQ, Gu YG, Yang ZB, Yang YX, Shao JR, Zhu XM, Cheng Z (2017) Pollution character-istics and risk assessment of human exposure to oral bioaccessibil-ity of heavy metals via urban street dusts from different functional areas in Chengdu, China. Sci Total Environ 586:1076–1084 Liu D, Quan Y, Ren Z, Wu G (2017) Assessment of heavy metal
con-tamination in soil associated with Chinese coal-fired power plants: a case study in Xilingol, Inner Mongolia. Int J Sust Dev World Ecol 24(5):439–443
Lu X, Liu W, Zhao C, Chen C (2013) Environmental assessment of heavy metal and natural radioactivity in soil around a coal-fired power plant in China. J Radioanal Nucl Chem 295:1845–1854 Mandal A, Sengupta D (2006) An assessment of soil contamination due
to heavy metals around a coal-fired thermal power plant in India. Environ Geol 51:409–420
MTA (General Directorate of Mineral Research and Exploration)
(2018) http://www.mta.gov.tr/v3.0/arast irmal ar/komur -arama
-arast irmal ari
Muller G (1969) Index of geoaccumulation in sediments of the Rhine River. Geol J 2:108–118
Noli F, Tsamos P (2016) Concentration of heavy metals and trace ele-ments in soils, waters and vegetables and assessment of health risk in the vicinity of a lignite-fired power plant. Sci Total Environ 563(564):377–385
Okedeyi OO, Dube S, Awofolu OR, Nindi MM (2014) Assessing the enrichment of heavy metals in surface soil and plant (Digitaria eriantha) around coal-fired power plants in South Africa. Environ Sci Pollut Res 21:4686–4696
Özkul C (2016) Heavy metal contamination in soils around the Tun-çbilek thermal power plant (Kütahya, Turkey). Environ Monit Assess 188(284):1–12
Şen Ö, Saraç C (2000) Geology and evaluation of Kalburçayın (Kan-gal, Sivas) lignite basin by block Kriging. Geol Bull of Turkey (Türkiye Jeoloji Bulteni) 43(1):21–31 (in Turkish)
Sengupta S, Chatterjee T, Ghosh PB, Saha T (2010) Heavy metal accu-mulation in agricultural soils around a coal fired thermal power plant (Farakka) in India. J Environ Sci Eng 52(4):299–306 Tchounwou PB, Yedjou CG, Patiolla AK, Sutton DJ (2012) Heavy
metals toxicity and the environment. EXS 101:133–164
TEİAŞ (Turkey Electricity Transmission Company) (2018) https ://
www.teias .gov.tr/tr
Turhan Ş, Gören E, Garad AMK, Altıkulaç A, Kurnaz A, Duran C, Hançerlioğulları A, Altunal V, Güçkan V, Özdemir A (2018) Radiometric measurement of lignite coal and its by-products and assessment of the usability of fly ash as raw materials in Turkey. Radiochim Acta 106(7):611–621
Verma C, Madan S, Hussain A (2016) Heavy metal contamination of groundwater due to fly ash disposal of coal-fired thermal power plant, Parichha, Jhansi, India. Cogent Eng 3:1–8
Wien K, Wissmann D, Kölling M, Schulz HD (2005) Fast application of X-ray fluorescence spectrometry aboard ship: how good is the new portable Spectro Xepos analyser? Geo Mar Lett 25:248–264 Yaroshevsky AA (2006) Abundances of chemical elements in the
earth’s crust. Geochem Int 44(1):48–55
Yüksek S, Kaya S (2017) Building material production from fly ash, lime gypsum. APJES 5(3):58–70 (in Turkish)
Zhao S, Duan Y, Chen L, Li Y, Yao T, Liu S, Liu M, Lu J (2017) Study on emission of hazardous trace elements in a 350 MW coal-fired power plant. Part I. Mercury. Environ Pollut 229:863–870
Publisher’s Note Springer Nature remains neutral with regard to jurisdictional claims in published maps and institutional affiliations.