Kastamonu Eğitim Dergisi
Kastamonu Education Journal
Ocak 2019 Cilt:27 Sayı:1
kefdergi.kastamonu.edu.tr
Determination of the Factors Affecting the Quality of Education in
Technical and Vocational Universities
Teknik ve Mesleki Üniversitede Öğretim Kalitesini Etkileyen Faktörlerin
Açıklanması
Shahram ESKANDARIPOUR
1, Gholamreza HAJIHOSSEINNEZHAD
2, Majid ALIASGARI
3, Ali HOSSEINIKHAH
4Abstract
This study aimed to explain factors affecting quality of teaching and determine their impact on teaching quality. The mixed research approach and sequential exploratory strategy of classification model were used to collect the data. The population (qualitative method) consisted of staff at central organization of a technical and vocational university and top technicians and researchers of a technical and vocational university in 2011- 2016; they were selected using mixed sampling (homogeneous and snowball) method. The population (quantitative method) also consisted of educational assistants, heads of research and education department, and faculty members in 2016. In qualitative study, the exploratory interviews and semi-structured interviews were used for collecting the data. In quantitative study, the identified categories which were derived from encoding qualitative data were used to create paired comparison questionnaires; they included factors affecting quality of teaching. Using Expert Choice Software, the results were analysed by AHP method. The findings indicated that the contribution of teacher, educational en-vironment, and students were estimated to be 41, 33, and 26 percent, respectively. Among teacher components, the professional skills of teacher (weight 361 out of 1000) was determined to be the most important component; among student components, the academic records and experiences (weight 385 out of 1000) was determined to be the most important component; and among educational environment components, quality of environment and educational conditions (weight 341 out of 1000) was determined to be the most important component.
Keywords: Educational quality, technical and vocational university, analytical hierarchy process, mixed research method
Öz
Bu çalışma, öğretimin kalitesini etkileyen faktörleri açıklamayı ve bunların öğretim kalitesi üzerindeki etkilerini belirlemeyi amaçlamaktadır. Verilerin toplanması için karma araştırma yaklaşımı ve sınıflandırma modelinin sıralı keşif stratejisi kullanılmıştır. Araştırma evrenini (nitel yöntem), 2011-2016 yıllarında teknik ve meslek üniversitenin merkezi biriminde görev yapan personel ve teknik ve mesleki üniversite araştırmacıları ile üst düzey teknisyenleri oluşturmaktadır. Katılımcılar karışık örnekleme (homojen ve kartopu) metodu kullanılarak seçilmiştir. Araştırmanın nicel boyutu için katılımcılar 2016 yılında görev yapan eğitim asistanları, araştırma ve eğitim bölümleri başkanları ve öğretim üyelerinden oluşmaktadır. Nitel bölümde, verilerin toplanması için keşfedici görüşmeler ve yarı yapılan-dırılmış görüşmeler kullanılmıştır. Nicel bölümde, nitel verileri kodlamadan türetilerek belirlenen kategoriler, eşleş-tirilmiş karşılaştırma anketleri oluşturmak için kullanılmıştır. Bu kategoriler öğretimin kalitesini etkileyen faktörleri içermektedir. Expert Choice Software kullanarak, sonuçlar AHP yöntemi ile analiz edilmiştir. Bulgular öğretmen, eği-tim ortamı ve öğrencilerin katkısının sırasıyla yüzde 41, 33 ve yüzde 26 olduğunu göstermiştir. Öğretmen bileşenleri arasında, öğretmenlerin mesleki becerileri (ağırlığı: 1000 üzerinden 361) en önemli bileşen olarak belirlenmiştir; öğrenci bileşenleri arasında, akademik kayıtlar ve deneyimler (ağırlığı: 1000 üzerinden 385) en önemli bileşen ola-rak belirlenmiştir. Eğitim ortamı bileşenleri arasında, çevre kalitesi ve eğitim koşulları (ağırlığı: 1000 üzerinden 341) en önemli bileşen olarak belirlenmiştir.
Anahtar Kelimeler: Eğitim kalitesi, teknik ve mesleki üniversite, analitik hiyerarşi süreci, karışık araştırma yöntemi. 1. Curriculum, Kharazmi University; https://orcid.org/0000-0002-6454-4926
Başvuru Tarihi/Received: 20.06.2018
Kabul Tarihi/Accepted: 14.08.2018 DOI: 10.24106/kefdergi.3175
Extended Abstract
Explaining Factors Affecting Quality of Teaching at Technical and Vocational University
The main objective of this research is to explain the factors affecting the quality of teaching and determine the contribution and weight of each of the factors in the quality of teaching at the technical and vocational college. Among the factors, three factors of the teachers, students and educational environment were studied.
Method: In this research, a third methodological movement called the combined research approach and exploratory strategy of classification model was used with emphasis on qualitative emphasis. In the qualitative section, the grounded theory method was used and in the quantitative part a descriptive survey method was taken into account.
The statistical population in the qualitative section included experts, key people and top researchers from the university’s technical and vocational college and were selected through homogeneous and snowball sampling. The statistical population of this study was the students of technical faculties throughout Iran. In this section, a mul-ti-stage probable sampling method was used.
Considering the combination of the method of this research, data gathering tools in the qualitative section encompassed exploratory interviews with multiple answers questions about three important factors affecting the quality of education and the use of semi-structured interview tools.
In the quantitative part, using the identified factors and components derived from coding and analyzing qualita-tive data, a pairwise comparison questionnaire was developed. Validity was evaluated for content validity and was approved by the opinions of the experts and supervisor as well as advisor professors.
Cronbach Alpha method was used for reliability estimation and the reliability of each of the components was calculated and validated separately as follows Teacher component(87.0),Student component(82.0),and Education-al environment(78.0):. In the data anEducation-alysis section in the quEducation-alitative section, first, the primary and secondary cat-egories were determined by coding, and in the secondary coding, common concepts were placed in one category. In the axial coding step using the static comparison method, the obtained categories were compared and their dimensions were determined and then effective categories were identified at the selected coding stage. In the quantitative part, the method of hierarchical analysis process was used to rank factors and components.
Findings
Qualitative data analysis: At the initial stage of coding, each concept extracted was included in each of the three factors of teachers, students and the learning environment. For the teacher factor, 5 components and 69 concepts, for the student, 4 components and 43 concepts were obtained and for the operating environment of the educational environment, 4 components and 36 concepts were obtained.
Quantitative data analysis: In this section, the relative weight of each of the factors and factors affecting the teaching quality was determined using paired comparisons and using the hierarchical analysis process technique in which the three factors of the teachers, students and the educational environment had a relative weight of 410, 260 and 330 of 1,000, respectively. The rate of inconsistency of respondents is 0.08 and because it is less than 10%, this rate is scientifically acceptable.
Among the factors related to the teacher›s role, the following components are ranked based on relative weight: professional teaching skills with a relative weight of 361 out of 1000, job characteristics of teachers with a relative weight of 214 out of 1000, personality traits Teachers with a relative weight of 156 per thousand, teaching activities of teachers with a relative weight of 139 per thousand, and individual characteristics of teachers with a relative weight of 130 per thousand. The rate of inconsistency of respondents in this section is 0.05 and acceptable.
Among the components related to student factors, the following components were ranked based on their rel-ative weight. Component of Students’ Records and Educational Experiences with Relrel-ative Weights of 385, Student Expectations from Professor with Relative Weights of 217, Individual Features of Students with Relative Weights of 205, and Family Attributes of Students with Relative Weights of 193 were identified as components of this factor. The inconsistency rate is also 0.07, which is acceptable.
Among the components of the educational environment, the components of the environment and educational environment, physical environment, educational quality assessment strategies, and organizational and administrative environment are ranked relative to the relative weight of 341, 247, 211 and 201 respectively. The inconsistency rate in this factor is 0.04 and is acceptable.
Discussion and conclusion: The quality of teaching and teaching in higher education is influenced by the various factors that are expressed in different sources in different sources. In this research, which was carried out in combination with the technical and professional university of Iran, the most important factors and components were identified in terms of three factors of teachers, students and educational environment, and the relative weight of each component was calculated.
According to the findings of this research, and on the other hand, given the emergence of the technical and vocational universities and the policy of governments regarding the need to paying attention to technical and vocational training and the efficiency and effectiveness of graduates of the technical and vocational education and services sector Quality in the work environment ,there should be great emphasis on the training of this group so as to provide areas of creativity, innovation and entrepreneurship. On the other hand, given that the university is defined as a capable university in the field of training skilled human resources, and advanced and industrial in the global category; the quality of education in this university is a major challenge and one of the main goals of the university is to improve the quality of education and meet the needs of the industry in the field of skills and technology. Therefore, it is recommended that in the educational and research policies of this kind of university, the quality of teaching and teaching is considered as one of the most important issues of the relevant authorities and designing a desirable educational quality assessment and providing indicators and tools for quality evaluation Teaching and training will provide the necessary effort to promote educational activities.
1. Introduction
During past two decades, Iran’s higher education has faced numerous challenges including increased number of universities, large number of diverse educational institutions, increased number of students, and sometimes huge number of unemployed graduates; these have created many problems in Iran’s higher education system. Neglecting capacities and economic, social, and cultural conditions, the increased number of higher education systems may re-sult in reduced quality of higher education system. In fact, the increased number of students and graduates cannot be associated with desirable quality. These challenges have led to need for accountability in Iran’s higher education system; they have forced the academic system to revise its structure, mission, goals, functions, and processes. Since universities are among the most important institutions which are needed by communities to grow and develop, their transparency, responsiveness, and quality improvement are necessary (Bazargan, 2003, 142). As a new managerial attitude, the performance management plays an essential role in guiding and combining quality components in organi-zation in a desirable and effective manner (Jeffreys, Translated by Kakuyi, 2000, 87). It is obvious that the existence of a desirable performance management process in Iran’s higher education institutions will improve their quality. The per-formance management in higher education institutions pays special attention to perper-formance of students, graduates, and faculty members and factors affecting their quality; it evaluates the qualitative components of such organizations in a desirable manner and uses the results to improve the weaknesses and establish the strengths (Yamani & Arasteh, 2006, 69). As performance management plays an essential role in guiding and combining qualitative components in organization, the assessment of educational quality of universities may also provide useful guidelines for improving performance management process at universities (Altnbach & Rumbley 2009, translated by Saeed Abadi & Ahmad Khanlu, 2014, 138). The evaluation is one of the most important mechanisms for managing performance in production and development of quality in organizations. In fact, the quality improvement requires qualitative assessment; this is quite obvious in all industrial, commercial, and educational organizations. However, the qualitative assessment is one of the most important requirements of organizations and the higher education institutions are not an exception (Gour-chian, 2000, 126). For this reason, in recent two decades, most countries have made special efforts to improve quality of education and have used evaluation approaches in doing so (Bazargan, 2000). The research (Dumond, 2010; Tsin-idou, 2010; Ghedin & Aquario; 2008; Nishi machi & kodaria; 2012; Fatima; 2014; Melhaoui; 2004; Chier; 2003; Vieira; 2002; Yarmohammadian et al., 2010; Ghaedi, 2006; Rahmani and Fathi Vajargah, 2008; Mojtaba Zadeh, 2016; Maroufi et al., 2007; Mohammad Hashemi, 2014; Najafi & Ismaili Rad, 2009; Mirzamohammadi, 2010; Omidian & Safari, 2015; Hematinejad, 2014; Berimani et al., 2011; Samari etal., 2013; Hosseini et al., 2013; Tabarsa et al., 2012; Ghonchi et al., 2012; Sabetnejad, 2011) has shown that the evaluation plays significant role in improving quality of educational systems in Iran and all countries around the world. However, it is expected that the explanation of factors affecting quality of education at technical and vocational university and determining the weight of each of components may be effective in improving quality of colleges at this university. So, this research seeks to answer the following questions: What are the main factors affecting quality of education of teachers, students, and educational environment? What is the relative contribution of each of factors affecting quality of education at technical university?
2. Methodology
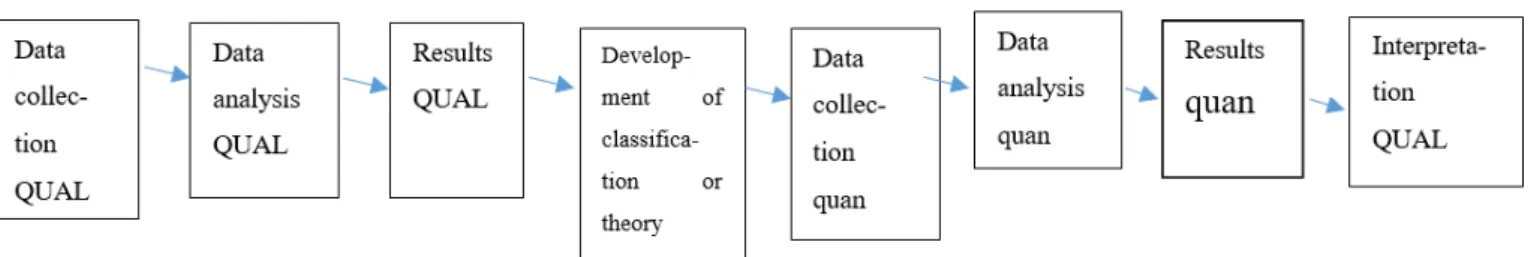
The mixed (qualitative and quantitative) research approach was used in this study (Cooper, translated by Hamid Rafiee, 2006). The main advantage of this approach is that it leads to better understanding of research issues (Tedlee & Tashakori, 2009, translated by Azar & Jahanian, 2016). From among various mixed approaches, the sequential explora-tory strategy of classification model (with emphasis on QUAL) was used for collecting the data (Creswell & Plano Clarck, 2007, translated by Kiamanesh & Saraei, 2011). The sequential exploratory strategy involves collecting and analysing qualitative data in first stage and subsequently, collecting and analysing quantitative data in second stage based on qualitative results of first stage (Creswell, 2009, translated by Kiamanesh & Dana Tousi, 2011). The classification model is used when the initial qualitative stage is conducted to identify main variables, develop classification or typology sys-tem, or develop a new theory; at secondary quantitative stage, these results are more accurately evaluated or studied (Morgan, 1998; Tashakorri & Tedley, 2009, quoted by Creswell & Plano Clark, 2007, translated by Kiamanesh & Saraei, 2011).
Figure 1. Exploratory Plan of Classification Model with an Emphasis on QUAL (Creswell & Plano Clarke, 2007, trans-lated by Kiamanesh & Sarai, 2011).
Methodology of qualitative research
In this research, the grounded theory was used as a qualitative approach. It is used to design a model-based theory (Charmaz, 2000, quoted by Bazargan, 2010). The implementation of grounded theory includes systematic (Strauss & Corbin, 1990), innovative (Glaser, 1992), and constructive (Charmaz, 2000) plans; however, the systematic method was used in this study. This method emphasizes the use of data analysis steps through open coding, axial coding, and sele-ctive coding (Marshal & Rasman, 1995; translated by Parsaian & Arabi, 2011; Zolfagarian & Latifi, 2011).
Methodology of quantitative research
This was descriptive-survey study. The descriptive research includes a set of methods aimed at describing, expla-ining, and extracting factors and variables. The descriptive research can merely be used to understand the existing conditions or assist the decision-making process (Sarmed et al., 2007). The survey research is also a quantitative study in which the same questions are systematically asked from individuals or contributors and the answers are recorded and analysed (Numan, 2004; quoted by Moghadam, 2008). In addition, the pair comparisons based on expert views were conducted in analytical hierarchy analysis process (AHP) to compare and rank each of factors affecting quality of education (Ghodsipour, 2016; Nick Mardan, 2012).
Population, sample, and sampling method
Due to mixed research method, the population and sampling methods were distinct in qualitative and quantitative studies. The population in qualitative study included staff in relevant fields at central organization of technical and vocational university and top technicians and researchers at technical and vocational university in 2011-2016. Using mixed (homogeneous and snowball) sampling method, the sample was selected. The population in quantitative study included educational assistants, heads of research and education department, and faculty members of all faculties in 2016. The multi-stage probability (random) sampling method was used for sampling in quantitative study. For this purpose, two colleges (one for girls and one for boys) were selected from each district; then, the sample was selected from each colleges. Thus, nine individuals from each colleges, eighteen individuals from each region, and one hundred and eighty individuals from all ten regions were selected as final sample and the necessary information was collected in the form of questionnaires and specific forms.
Tools and methods for collecting information
Due to mixed research method, the research tools were also different in both qualitative and quantitative studies. In qualitative study, the first stage used exploratory interviews with several open questions regarding the most important factors affecting quality of education and second stage used semi-structured interview. In quantitative part, the identified components and factors by coding and analysis of qualitative data were used to create questionnaires. Subsequently, the pair comparison questionnaires were distributed among selected samples; this questionnaire inclu-ded factors, components, and categories affecting quality of education which were identified in qualitative study. The samples were requested to answer according to specific instructions of questionnaire.
It should be noted that for assessing the validity and reliability of tools in both qualitative and quantitative studies, specific methods were used. The content validity was evaluated; also, the Cronbach Alpha method was used to assess the reliability (Uono & ghebousy and Johnson, 2006, quoted by Creswell, 2009, translated by Kiamanesh & Danae Tous, 2011).
Data analysis method
secon-dary categories and in seconsecon-dary or central coding, the common concepts were placed in one category. In axial coding, the constant comparison method was used to compare obtained categories and determine their dimensions. Then, the main categories were determined at selective coding stage. Finally, the categories affecting measured phenomenon, i.e. factors affecting educational quality, were determined based on grounded theory.
In quantitative study, the analytical hierarchy process (AHP) was used. The expert choice11 software was used to conduct the mentioned analyses.
3. Findings
Qualitative data analysis
At initial stage of open coding, each extracted concept was included in each of these three categories: teachers, students, and learning environment. In selection of categories, the categories which were mentioned in research qu-estions were considered. Examining data which were obtained at first stage of open coding, 5 and 69, 4 and 43, and 4 and 36 components and concepts were obtained for teachers, students, and educational environment, respectively. After first stage of open coding, the second stage included integration of common and similar concepts and categories through constant comparative analysis of data. Thus, relying on the most significant and abundant basic concepts, the data were screened and reduced. At this stage, referring to similar concepts and comparing them with each other, the overlapped concepts and categories were identifies and sorted and the common concepts were placed in related category (teachers, students, and educational environment). Accordingly, the extensive data were reduced to a limited number of general categories. At this stage, the data were categorized into major categories and concepts. After iden-tifying main categories, the next step was axial coding. At this stage, the above items were compared and merged to determine final categories and concepts. Therefore, the coded data were compared and placed in appropriate catego-ries. In this regard, the major categories were compared to ensure each class of categories is distinct from others. Then, the relationship between categories was examined and based on their nature, they were classified under heading of main category. In axial coding stage, 49, 33, and 29 main concepts were determined for each of three factors (teachers, students, and educational environment), respectively. In selective coding section, the provision of a convergent model was considered.
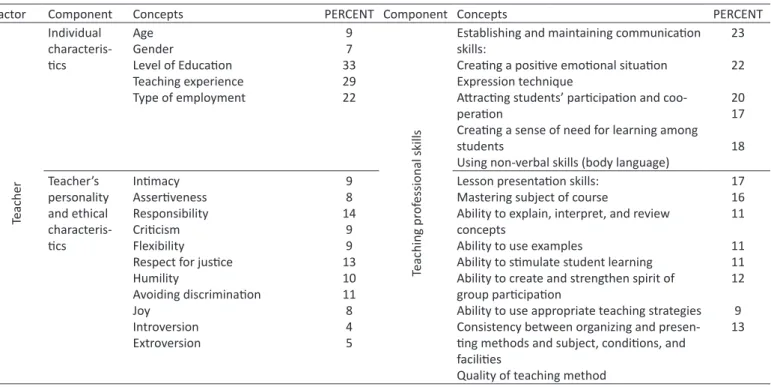
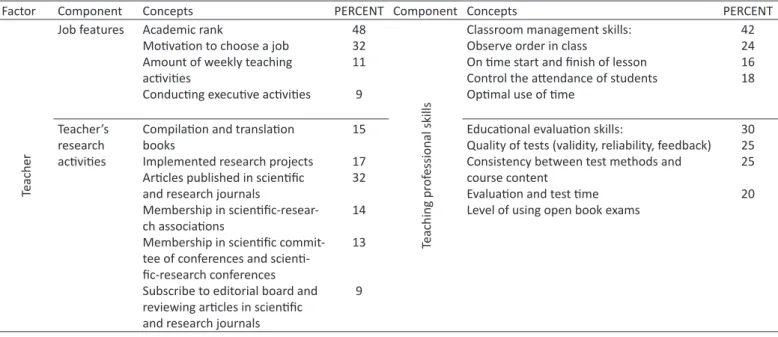
Based on qualitative analysis of interview data and coding of teacher factor, 5 components and 49 concepts were identified as table below.
Table 1. Identified components and concepts of teacher factor
Factor Component Concepts PERCENT Component Concepts PERCENT
Teacher Individual characteris-tics Age Gender Level of Education Teaching experience Type of employment 9 7 33 29 22 Teaching pr of essional skills
Establishing and maintaining communication skills:
Creating a positive emotional situation Expression technique
Attracting students’ participation and coo-peration
Creating a sense of need for learning among students
Using non-verbal skills (body language)
23 22 20 17 18 Teacher’s personality and ethical characteris-tics Intimacy Assertiveness Responsibility Criticism Flexibility Respect for justice Humility Avoiding discrimination Joy Introversion Extroversion 9 8 14 9 9 13 10 11 8 4 5
Lesson presentation skills: Mastering subject of course
Ability to explain, interpret, and review concepts
Ability to use examples
Ability to stimulate student learning Ability to create and strengthen spirit of group participation
Ability to use appropriate teaching strategies Consistency between organizing and presen-ting methods and subject, conditions, and facilities
Quality of teaching method
17 16 11 11 11 12 9 13
Factor Component Concepts PERCENT Component Concepts PERCENT
Teacher
Job features Academic rank
Motivation to choose a job Amount of weekly teaching activities
Conducting executive activities
48 32 11 9 Teaching pr of essional skills
Classroom management skills: Observe order in class
On time start and finish of lesson Control the attendance of students Optimal use of time
42 24 16 18 Teacher’s research activities
Compilation and translation books
Implemented research projects Articles published in scientific and research journals
Membership in scientific-resear-ch associations
Membership in scientific commit-tee of conferences and scienti-fic-research conferences Subscribe to editorial board and reviewing articles in scientific and research journals
15 17 32 14 13 9
Educational evaluation skills:
Quality of tests (validity, reliability, feedback) Consistency between test methods and course content
Evaluation and test time Level of using open book exams
30 25 25 20
In relation to student factor, 4 components and 33 concepts were extracted as table below.
Table 2. Extracted components and concepts of student factor
Factor Component Concepts PERCENT Component Concepts PERCENT
Studen ts Individual char act eris
tics ageIntelligence Self-confidence Locus of control Attitudes to study Self-efficacy 8 16 17 19 15 25 Ac ademic r ec or ds and e xperiences
Idividual interest in study field Motivation to choose a field Compete with counterparts Importance of field
Occupation future Diploma GPA
Rank at university entrance Total average of student Number of rejected semesters Number of rejected lessons Prioritization in field selection Motivation to choose (optional and compulsory) course
Scientific-research activities Time allocated by student to study Ratio of Quota student to total student 11 7 4 11 9 7 6 8 5 4 8 4 9 5 3 Family f ea tur
es Parent educationParent job
Family monthly income Number of children in family Child’s rank
Relationships between family members 15 16 20 11 10 19 Studen t e xpect ations fr om teacher
Observe the rules and regu-lations
Easy taking in training Give high scores
Access to teacher outside of class time
Considering specific problems of students
Rate of answering students’ non-academic questions 21 12 13 18 19 17
Table 3. Extracted components and concepts of educational environment factor
Factor Component Concepts PERCENT Component Concepts PERCENT
Educ ational en vir onmen t Educ ational en vir onmen t and c onditions
Course subject feature Time to present lessons Access to educational equip-ment and training assistance Access to information and communication services Access to library (reference sources, journals, etc.)
Access to internet and authen-tic scientific databases
Physical arrangement of class seats 15 12 17 13 12 19 12 Or ganiz
ational and adminis
tra tiv e en vir on -men t Employment regulations Organizational climate Work culture Consulting services Job satisfaction of faculty members
Retraining and in-service training
Support from quality of edu-cation
Observing hours of presence of teachers in college
Criteria for promotion of fa-culty members Welfare regulations Research regulations 7 6 6 8 13 10 9 9 11 12 8 Ph ysic al en vir onmen t Faculty area
Capacity of classes (student density)
Quality of educational spaces (class, workshop, laboratory) Quality of laboratory equip-ment and materials
Quality of health facilities Quality of cultural and sports facilities
Quality of welfare service (dor-mitory and self service)
6 11 25 22 10 9 17 Educ
ational quality assessmen
t
str
at
egies
Approved indicators of asses-sing quality of teaching
Process of evaluating quality of teaching (time and place) Sources of information to assess quality of teaching and learning
43 24 33
Quantitative data analysis
In this section, the relative weight of components and categories affecting teaching quality was determined using pairwise comparisons and using analytical hierarchy process technique.
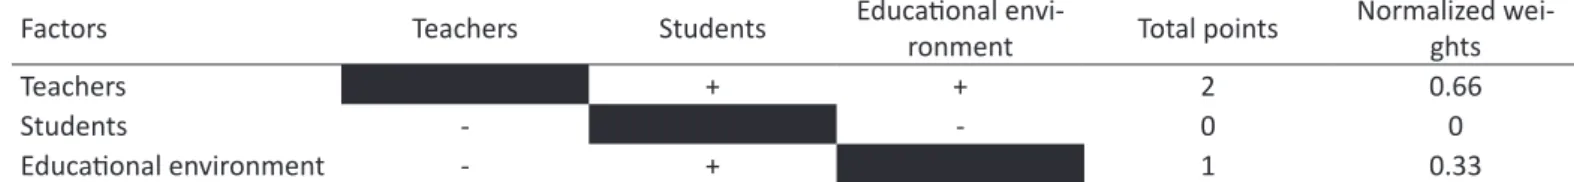
Table4. Paired comparison matrix table of factors affecting teaching quality based on AHP technique
Factors Teachers Students Educational envi-ronment Total points Normalized wei-ghts
Teachers + + 2 0.66
Students - - 0 0
Educational environment - + 1 0.33
Table 5. Relative weight of factors affecting teaching quality based on AHP technique
Factors Relative weight
Teachers 410
Students 260
Educational environment 330 Inconsistency rate: 0.08 Total: 1000
As is shown in table above, the teacher, student, and educational environment factors impact on teaching quality is 41, 26, and 33 percent, respectively. The inconsistency rate of respondents is 0.08; since this is less than 10% (accep-table value in AHP technique), it is scientifically accep(accep-table.
Table 6. Paired Comparison Matrix Table teacher factor components based on AHP technique
Components fessional skillsTeaching pro- Teachers’ job-features characteristics Ethical-moral of teachers Research activi-ties ofteachers Individual characteristics of teachers totalpoints Normalized weights Teaching pro-fessional skills + + + + 4 0.4 Teachers’ job features - + + + 3 0.3 Ethical-moral characteristics of teachers - - + + 2 0.2 Research activi-ties of teachers - - - + 1 0.1 Individual cha-racteristics of teachers - - - - 0 0
Table 7. Relative weight of teacher factor components based on AHP technique
Components Relative weight Teaching professional skills 361 Teachers’ job features 214 Ethical-moral characteristics of teachers 156 Research activities of teachers 139 Individual characteristics of teachers 130 Inconsistency rate: 0.05 Total: 1000
The table above shows that among teacher factor components, the professional teaching skills (36.1%) and indivi-dual characteristics of teachers (13%) have the highest and least impact. The job characteristics of teachers (21.4%), personality-ethical characteristics of teachers (15.6%), and research features of teachers (13.9%) are other compo-nents affecting teaching quality. The inconsistency rate of respondents is equal to 0.05 and is acceptable.
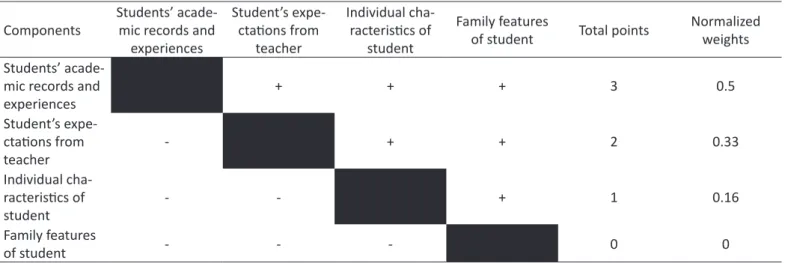
Table 8. Paired Comparison Matrix Table student factor components based on AHP technique
Components Students’ acade-mic records and experiences Student’s expe-ctations from teacher Individual cha-racteristics of student Family features
of student Total points Normalized weights Students’
acade-mic records and
experiences + + + 3 0.5 Student’s expe-ctations from teacher - + + 2 0.33 Individual cha-racteristics of student - - + 1 0.16 Family features of student - - - 0 0
Table 9. Relative weight of student factor components based on AHP technique
Components Relative weight Students’ academic records and experiences 385 Student’s expectations from teacher 217 Individual characteristics of student 205 Family features of student 193 Inconsistency rate: 0.07 Total: 1000
The above table shows that students’ academic experiences, students’ expectations of teacher, individual chara-cteristics of students, and family charachara-cteristics of students impacted 38.5%, 21.7%, 20.5% and 19.3% on quality of teaching, respectively. The responders’ inconsistency rate was 0.07 and this is acceptable.
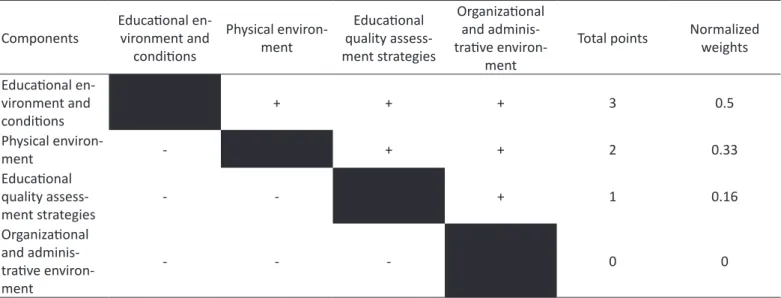
Table 10. Paired Comparison Matrix Table educational environment factor components based on AHP technique
Components Educational en-vironment and conditions Physical environ-ment Educational quality assess-ment strategies Organizational and adminis-trative environ-ment
Total points Normalized weights Educational en-vironment and conditions + + + 3 0.5 Physical environ-ment - + + 2 0.33 Educational quality assess-ment strategies - - + 1 0.16 Organizational and adminis-trative environ-ment - - - 0 0
Table 11. Relative weight of educational environment factors based on AHP technique
Components Relative weight Educational environment and conditions 341
Physical environment 247
Educational quality assessment strategies 211 Organizational and administrative environment 201 Inconsistency rate: 0.04 Total: 1000
The above table shows that among educational environment factor, the educational and environment condition (34.1%) and organizational and administrative environment (20.1%) had the highest and least effect among compo-nents. The physical environment components (24.7%) and educational quality assessment strategies (21.1%) were components affecting teaching quality. The inconsistency rate of respondents was equal to 0.04 and this is acceptable.
4. Discussion And Conclusion
The teaching quality in higher education is influenced by various factors which have been expressed in different terms in various sources. Some of the most important factors that have been emphasized by scholars include teachers, students, and educational environment factors. However, this research used mixed method and was conducted in tech-nical and vocational university of Iran. It identified main components and concepts which were related to each of these three factors (teachers, students, and educational environment) and calculated the relative weight of each component. From among components of teacher factor, the professional teaching skill was identified as the most important compo-nent of teaching quality; this compocompo-nent is divided into concepts such as establishing and maintaining communication skills (5 indicators), lesion presentation skill (8 indicators), classroom management skill (4 indicators), and educational evaluation skill (7 indicators). Other components of teacher factor include personality-ethical characteristics of teacher (11 indicators), job characteristics of teacher (4 indicators), research activities of teacher (6 indicators), and individual characteristics of teacher (5 indicators); these were identified through qualitative data analysis. The effect of teacher’s five components (teaching skills, occupational characteristics, personality-ethical characteristics, research activities, and individual characteristics) on teaching quality was 36.1%, 21.4%, 15.6%, 13.9%, and 13%, respectively. Different researchers (Damond (2010), Wiera (2002), Maroofi et al., (2007), Hematinejad (2014), and Mojtaba Zadeh (2016)) pointed and confirmed the impact of these components on teachers’ quality of teaching.
expectations from teacher (21.7%), individual characteristics of student (20.5%), and family characteristics of student (19.3%) were components affecting quality of teaching. This is consistent with findings of Gedin and Akariu (2008), Nishi Machi and Kudariya (2012), Melhawi (2004), Fatima (2014), Rahmani and Fathi Vajargah (2008), Sameri et al., (2013), and Tabarsa et al., (2012).
The findings on environmental environment showed that this factor (with four components, 29 concepts, and re-lative weight of 330 out of thousand) impacted 33% on teaching quality. From among components, the environment and educational conditions (34.1%), physical environment (24.7%), educational quality assessment strategies (21.1%), and organizational and administrative environment (20.1%) impacted on teachers’ teaching quality. Tesindo (2010), Chir (2003), Sobhaninejad and Afshar (2008), and Barimani et al. (2011) referred to components of educational envi-ronment as factors affecting quality of teaching.
According to findings, however, it is recommended that in educational and research policy makings at technical and vocational university, the teaching and education quality to be considered as one of the most important issues, a desi-rable model to be designed for evaluation, and appropriate indicators and tools to be provided for evaluating teaching quality to promote educational activities.
5. References
Altnbach, Ph., Laserzinger, J., Rambley, L. E. (2009). Global Higher Education Trends: Forming an Academic Revolution. Translated by Mohammad Reza Saeed Abadi and Parvin Ahmad Khanloo, Tehran: Institute for Research and Planning for Higher Education, p. 138. Bazargan, A. (2010). Introduction to qualitative and mixed research methods. Tehran: Didar.
Bazargan, A. (2003). Capacity building for evaluation and promotion of quality of higher education system, international experiences and national necessities in creating proper structure. Scientific-research publication of Supreme Council of Iran, 41, 141-151. Bazargan, A. (2002). Educational evaluation (Concepts, patterns, and operational process). Tehran: Samt.
Bazargan, A.(2000). Measuring Access to Higher Education and Higher Education Quality: A Case Study from Iran. Prospects. Vol. (3): 365 – 371. Berimani, A., Salehi, M., Sadeghi, M.R. (2011). Investigating the factors affecting improvement of higher education quality in
postgradu-ate education from the perspective of students. Educational Management Research, Sixth Year, 26, 1-24.
Blackmar,D.(2004). “Issues in higher education quality assurance Australian Journal of public Administration, 63(2), 105-116.
Bulgarelli , avina andedal (2009). Accredi tadian and quality assurance in vocational education and training . luxampourg :publications office of the European union.
Charmaz, k.(2006). Constructing Grounded theory: a practical Guide through qualitative analysis. Sage publication, London. Creswell, J. W., Plano, C. (2007). Mixed research methods. Translated by Ali Reza Kiamanesh and Javid Sarai. Tehran: Ayizh.
Creswell, J.W. (2009). Research plan: qualitative, quantitative and mixed approaches. Translated by Ali Reza Kiamanesh and Maryam Danaei Tous. Tehran: Jahad Daneshghahi.
Dumond, A. (2010). The evaluation of the ensignments for the study of the impact of the ‘encadrement on the pedagogics of the pro-fessors: can be HEIG_VD’ in M.F.fave_Bonnet, op.cit, pp165_178.
Fathi Vahjargah, K., Shafiei, N. (2007). Evaluation of quality of academic curriculum (adult education curriculum). Quarterly of curriculum
Studies, First Year, 5, 1- 26.
Fatima, H. E. (2014). Research, higher education and the quality of teaching: Inquiry in a japanese academic context. Research in higher education journal. Vol. 24. Pp. 1-25.
Gaedi, Y. (2001). Designing a comprehensive system for evaluating educational performance (technical and vocational training courses). Unpublished research project.
Gakuen, nishimachi, kodaria.(2012). Quality Assurance For Higher education in japan available on :.www.niad.ac.jp
Ghedin.E & Aquario.D. (2008). “Moving towards multidimensional assessment of teaching in higher education”. Higher education .56 (5), 563_597. Ghodsi Pour, H. (2016). Analytical hierarchy process. Tehran: Jahad Daneshghahi, Amirkabir University of Technology.
Ghonchi, M., Hosseini, S.M., Hejazi, Y. (2012). Factor Analysis of Effective Management Components on the Quality of Higher Education from the Viewpoints of Professors. Agricultural Promotion and education research. Fifth Year, No. 2, pp. 1-18.
Ghorchian, N., Khorshidi, A. (2000). Studying quantitative and qualitative improvement of access to academic education in Iran. Tehran: Andisheh metacognition publication.
Harris, M., Cooper (2006). Combined Research. Translation by Mohammad Ali Hamid Rafiee. Tehran: Office of Cultural Research. Harris, M.C. (2006). Mixed research. Translated by Mohammad Ali Hamid Rafiee. Tehran: Office of Cultural Research.
Hematinejad, Z., Hematinejad, M.A. (2014). Evaluating quality of educational services at Gilan Physical Education and Sport Sciences College based on SERVQUAL model. Journal of Management Studies in Sport, 1, 3, 28_11.
Hosseini, M., Farahani, A., Ghareh, M.A. (2013). Quality evaluation in the system of distance education in physical education. Applied Research in Sport Management. Volume 2, Number 2, pp. 124-135
Welfare and Rehabilitation Sciences.
Maroofi, Y., Kiamanesh, A.R., Ali Asgari, M., Mehrehmmadi, M. (2007). Assessing quality of teaching in higher education: reviewing some perspectives. Journal of Curriculum Studies, First Year, 5, 81-112.
Marshall, C. and Rossman, G. (2016) Designing Qualitative Research. 6th Edition, SAGE, Thousand Oaks.
Melhaoui, M. (2004), L’echec a univertise marocain: Bilan des Princips causes et attents de la p’edagogic unive sitaire, acts du zle’mc con l’aipa, university cadi Ayyad, marrakech.
Mirzamohammadi, M.H. (2010). Designing a suitable model for assessing the academic achievement of the art group of Technical and vocational education based on comparative study. Iranian Studies Curriculum Quarterly. 2010, No. 17, pp. 153-173.
Mohammad Hashemi, Z. (2015). Designing in establishment of performance evaluation system using AHP model. Quarterly of Carafan.
Two Scientific and Promotion Journals of Technical and Vocational University. Second Year, 36, 69-70.
Mojtaba Zadeh, M. (2016). Designing and validating scale to measure quality of universities in Iran. Two Journal of Medical Education
Strategies, ninth year, 2, 62-62.
Morgan, D. L. (1998). Practical strategies for combining qualitative and quantitative methods: Applications for health research. Qualita-tive Health Research, 8, 362-376.
Najafi, H.R., Ismaili Rad, A. (2009). The Role of the Assessment System in the Promotion of the Quality of Technical- Engineering Training, Educational Conferences. Academy of Sciences, Volume 1, Issue 2, pp. 1-9.
Neard and camy. (1991). “From pacts to action, expanding the education role of the graduate division”, in communication of the council of Graduate schools, washing ton D.C.
Nick mardan, A. (2012). Introducing Software Expert choice 11. Tehran: Jahad Daneshghahi. Amirkabir University of Technology. Omidian, F., Omidian, M., Safari, M. (2013). Evaluation of the quality of the performance of the training groups, Master’s degree in
Dez-ful Islamic Azad University based on the European Fundamental Quality Management Model (EFQM). Scientific- Research Quarterly of Jundishapur Education Development. First Year, No. 2, pp. 147-157.
Philip G, A., Laserizberg, L.A. R. (2009). Awesome global education trends: evaluating an academic revolution. Translated by Moham-mad Reza Saeed Abadi and Parvin AhMoham-mad Khanloo. Tehran: Institute for Research and Planning for Higher Education.
Rahmani, R., Fathi Vahjargah, K. (2007). Assessment of quality of higher education. Quarterly of Studies of Curriculum, Second Year, 5, 1-26. Sabetnejad, H.R. (2011). Assessment, validation, and quality assurance in technical and vocational education system. Tehran: Ministry
of Cooperatives, Labor, and Social Services: Organization of Technical and Vocational Education of Iran.
Samari, I., Yamani Dozi Sorkhabi, M., Salehi Omran, E., Geraee Nejad, Gh.R. (2013). Investigating and identifying factors affecting univer-sity development process at universities in Iran. Educational Planning Studies, Second Year, 4, 67-100.
Sarmed, Z., Bazargan, A., Hejazi, E. (2007). Research Methods in Behavioral Sciences. Tehran: Aghah Publication.
Sobhani Nejad, M., Afshar, A. (2008). Explaining nature and components of higher education system to recognize challenges and deve-lop innovative approaches. Quarterly Journal of Islamic Azad University, 4, 12-40.
Strauss, A. and Corbin, L (1990). Basics of Grounded Theory Methods. Beverly Hills, CA. Sage.
Tabarsa, Gh.A., Hasanvand, M., Arefnejad, M. (2012). Analysis and ranking of factors affecting improvement of education quality (Case study: Isfahan University). Quarterly Journal of Interdisciplinary Studies in Humanities, 4, 51-74.
Tashakkori, A., & Teddlie, C. (1998). Mixed methodology: Combining qualitative and quantitativeapproaches. Thousand Oaks, CA: Sage Tedley, Ch., Tashakori, A. (2009). Basics of mixed research: Combining quantitative and qualitative approaches. Translated by Adel Azar
and Saeed Jahanian. Tehran: Jahad Daneshghahi.
Tsinidou, M., Gerogiannis, v. & Fitsilis,P. (2010). Evaluation of the factors that determine quality in higher education: an empirical study. Quality Assurance in education, 18(2), 227-244.http://dx.doi.org/10.1002/sce.3730740105.
Vieira, Flavia (2002). “Pedagogic quality at university: What teachers and students think”, Quality in higher education. VOL.8, www.ebs.co/pdf. Wood house, D. (2003). Quality Improvement through Quality Audit. Quality in Higher Education g (2): 133-140.
Yamani Doozi Sorkhabi, M. (2008). Introduction of performance of academic systems. Tehran: Shahid Beheshti University. Yamani Doozi Sorkhabi, M. (2012). Quality in higher education. Tehran: Samt.
Yamani Doozi Sorkhabi, M., Arasteh, H.R. (2006). Guidelines for university development planning. Tehran: Shahid Beheshti University. Yarmohammadian, M.H., Sadooghi, F., Ehtashami, A., Hossein Salarianzadeh, M., Kasai Isfahani, M. (2010). Proposed model for
evalua-ting pedagogical education. Iranian Journal of Medical Education (Special Education Development Letter), 10, 566-577. Zolfagarian, M.R., Latifi, M. (2011). Grounded theory. Tehran: Imam Sadiq University.