www.betam.bahcesehir.edu.tr
1
FOREIGN DEMAND LED GROWTH
Seyfettin Gürsel*, Zümrüt İmamoğlu†, ve Barış Soybilgen‡
Executive Summary
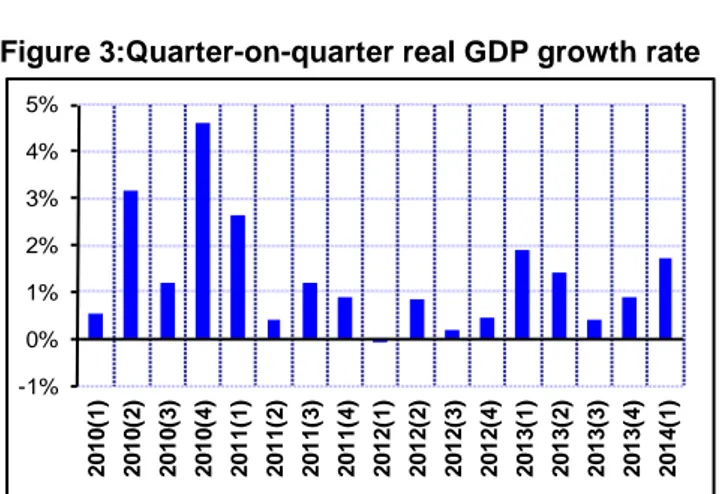
Turkey’s real GDP increased at a rate of 4.3 percent in the first quarter of 2014 from the same quarter of the previous year. Year-on-year growth in Turkish economy has been above 4.0 percent for the fourth consecutive quarter now and quarter-on-quarter growth accelerated. Seasonally adjusted GDP increased 1.7 percent in the first quarter from the previous quarter. This rate was 0.9 percent in the previous quarter.
Main sources of growth in the first quarter were exports and government spending (qoq). Government spending increased by 4,8 percent and continued its significant contribution to growth since 2012. Exports increased by 7 percent led by European
recovery, while imports fell 2.4 percent.
Consumption and investment expenditures, on the other hand, decreased from the previous quarter. Consumption declined 0.5 percent and investment decreased 2.8 percent.
The 12-month current account deficit (CAD) to GDP ratio, which was 7.9 percent at the end of 2013, fell to 7.5 percent at the end of the first quarter. Gold excluded current account deficit fell to 6.4 percent from 6.5 percent.
•
Prof. Dr. Seyfettin Gürsel, Betam, Director [email protected]
†
Zumrut Imamoglu, Betam, Research Associate [email protected]
‡
Baris Soybilgen, Betam, Research Assistant [email protected]
Figure 1. Change in GDP components from the previous quarter, 2014-Q1
Source: Turkstat.
Figure 2. Contributions of GDP components to 2014-Q1 GDP growth
Source: Turkstat.
New method for computing quarter-on-quarter growth
Since the beginning of our "Growth Review" series, Betam seasonally adjusts and calendar day corrects each component of GDP separately to analyze contributions of GDP components to growth on a
Imports Exports Government Spending Investment Consumption -8% -6% -4% -2% 0% 2% 4% 6% 8% 10%
Seasonally Adjusted Indicators
Imports Exports Inventory Investment Government Spending Investment Consumption -2.0% -1.0% 0.0% 1.0% 2.0% 3.0%
Seasonally Adjusted Indicators
Total Growth: 1.7%
Growth Review: 2014, 1
st
Quarter
www.betam.bahcesehir.edu.tr
2
quarterly basis. Starting this quarter Turkstat is releasing its own estimates regarding the components and the quarter-on-quarter growth rate is calculated
as the sum of component contributions.1 Therefore,
instead of presenting our own estimates, we will use Turkstat figures from this note onward.
Growth led by foreign demand
In the first quarter of 2014, Turkish economy grew by 1.7 percent from the previous quarter. Exports contributed to growth the most. Seasonally adjusted exports increased by 7 percent in the first quarter from the previous quarter and contributed 1.9 percentage points to growth. Imports decreased by 2.4 percent, adding 0,8 percentage points. Overall, net exports contributed 2.6 percentage points to growth.
Contribution of exports started to increase in the last quarter of 2013 due to revival in the European economy and exports to England, Spain and Germany accelerated. Exports had contributed 1.1 percent to growth in the last quarter (Figure 5). Europe's economic recovery is expected to continue through 2014, hence, positive contribution of exports will continue for the rest of the year, although, at a slower rate.
Consumption and investment expenditures fell Contrary to strong increase in foreign demand, private domestic demand contracted in the first quarter. Private consumption expenditures declined by 0.5 percent and subtracted 0.4 percentage points from growth. Inventory investment declined and subtracted 0.7 percentage points as well. Private investment fell by 2.8 percent and subtracted 0.5 percentage points from growth.
The first quarter of 2014 was hard on the economy. Following FED tapering in December, Turkish Lira depreciated and the Central Bank was forced to
increase interest rates significantly. Political
1
For details see:
http://www.tuik.gov.tr/HbGetir.do?id=16192&tb_id=17
uncertainties before local elections aggravated the effects, especially on private investment. However, weakness in investment has been continuing since 2012. Figure 4 shows contribution of investment expenditures to growth. Investment expenditures declined in 2012 and subtracted from growth. In 2013, although there was some revival in the first quarter, contributions slipped fast afterwards and ended up adding only 0.1 percentage points to growth overall. Although, the decline in the first quarter of 2014 is not a good sign for the rest of the year, politically calmer climate after the local elections and expected decreases in the interest rates will help investment expenditures increase from the second quarter onward. Consumption is also expected to increase.
Significant contribution from government spending to growth
For the last two years, government spending has been contributing significantly to growth. In 2012, the economy grew by 2.1 percent and government spending contribution was 1.0 percentage points. In 2013, it contributed 1.6 percentage points to a growth of about 4 percent.
In the first quarter of 2014, government spending increased by 4.8 percent, and contributed 0.8 percentage points to growth. 0.4 percentage points of overall contribution was from purchases of public goods and services, and 0.35 percentage points of overall contribution was from purchases of investment goods.
Growth outlook for the rest of the year Betam's QoQ forecast for the first quarter was 3.7 percent, lower than the realized 4.3 percent. Consumption and investment expenditures subtracted from growth as we expected, however, government spending and exports contributed more than predicted. For the rest of the year, we expect positive contribution of exports to continue but its pace will be somewhat lower and depend on the speed of European recovery. We expect the appreciation in the
www.betam.bahcesehir.edu.tr
3
Turkish Lira, and the fall in interest rates after the municipal elections to support private consumption
and investment expenditures. Hence, private
domestic demand will begin to contribute positively to growth. Finally, government spending will continue to support growth. Therefore, we expect growth to remain at a modest pace for the rest of the year.
At the end of the first quarter, the current account deficit declined from 7.9 percent to 7.5 percent, and gold-excluded current account deficit fell from 6.5 percent to 6.4 percent. We expect current account deficit to continue its decline mostly due to decrease in gold imports.
Figure 3:Quarter-on-quarter real GDP growth rate
Source: Turkstat.
Table 1.Changes in and contributions of GDP components for 2014Q1 and 2013Q4, compared to the previous quarter.
2014 – 1.Q Change (%) Contribution (pp) Consumption -0.5% -0.4% Investment -2.8% -0.5% Government exp. 4.8% 0.8% Inventory Inv. -- -0.7% Exports 7.0% 1.9% Imports -2.4% 0.7% 2013 – 4.Q Change (%) Contribution (pp) Consumption 0.3% 0.2% Investment -0.1% 0.0% Government exp. 4.2% 0.6% Inventory Inv. -- -0.6% Exports 4.2% 1.1% Imports 1.4% -0.4% Source: Turkstat.
Table 2.Changes in and contributions of GDP components for 2014Q1 and 2013Q4, compared to the same quarter of previous year.
2014 – 1. Q Change (%) Contribution (pp) Consumption 2.9% 2.1% Investment -1.3% -0.3% Government exp. 7.3% 1.0% Inventory Inv. -- -1.2% Exports 11.4% 2.9% Imports 0.8% -0.2% 2013 – 4. Q Change (%) Contribution (pp) Consumption 5.3% 3.5% Investment 4.9% 0.9% Government exp. 8.2% 1.5% Inventory Inv. -- 1.4% Exports -1.5% -0.4% Imports 9.3% -2.6% Source: Turkstat. -1% 0% 1% 2% 3% 4% 5% 2010 (1 ) 2010 (2 ) 2010 (3 ) 2010 (4 ) 2011 (1 ) 2011 (2 ) 2011 (3 ) 2011 (4 ) 2012 (1 ) 2012 (2 ) 2012 (3 ) 2012 (4 ) 2013 (1 ) 2013 (2 ) 2013 (3 ) 2013 (4 ) 2014 (1 )
www.betam.bahcesehir.edu.tr
4
Table 3. Contributions of GDP components compared to the previous quarterPrivate Consumption Private Investment Government Spending Inventory Investment Net
Exports Exports Imports Sum
2012(1) -1.1% 0.1% 0.2% 0.9% -0.3% 1.2% -1.5% -0.1% 2012(2) -0.4% -0.5% 0.8% -0.6% 1.6% 2.2% -0.5% 0.9% 2012(3) 1.5% -0.8% 0.6% -1.2% 0.2% 0.4% -0.2% 0.2% 2012(4) -0.2% -0.2% -0.1% 0.6% 0.3% -0.3% 0.6% 0.4% 2013(1) 1.3% 0.6% 1.1% 1.1% -2.4% -0.7% -1.7% 1.9% 2013(2) 0.8% 0.3% -0.1% 2.4% -1.9% 0.1% -2.0% 1.4% 2013(3) 1.0% 0.1% -0.2% -1.8% 1.2% -0.2% 1.5% 0.4% 2013(4) 0.2% 0.0% 0.6% -0.6% 0.7% 1.1% -0.4% 0.9% 2014(1) -0.4% -0.5% 0.8% -0.7% 2.5% 1.9% 0.7% 1.7% Source: Turkstat.
Figure 4. Private Investment, QoQ Contribution
Source: Turkstat.
Figure 5. Exports, QoQ Contribution
Source: Turkstat. -1% 0% 1% 2012 (1 ) 2012 (2 ) 2012 (3 ) 2012 (4 ) 2013 (1 ) 2013 (2 ) 2013 (3 ) 2013 (4 ) 2014 (1 ) -1% 0% 1% 2% 3% 2012 (1 ) 2012 (2 ) 2012 (3 ) 2012 (4 ) 2013 (1 ) 2013 (2 ) 2013 (3 ) 2013 (4 ) 2014 (1 )