T.C.
BAHÇEŞEHİR ÜNİVERSİTESİ
DRUG DOSAGE PLANNING OF DIABETES DISEASE:
AN APPLICATION OF THE ADAPTIVE NETWORK
BASED FUZZY INFERENCE SYSTEM (ANFIS) IN
ASSISTING DRUG THERAPY
Master Thesis
T.C.
BAHÇEŞEHİR ÜNİVERSİTESİ
THE GRADUATE SCHOOL OF NATURAL AND APPLIED SCIENCES COMPUTER ENGINEERING
DRUG DOSAGE PLANNING OF DIABETES DISEASE:
AN APPLICATION OF THE ADAPTIVE NETWORK
BASED FUZZY INFERENCE SYSTEM (ANFIS) IN
ASSISTING DRUG THERAPY
Master Thesis
Emirhan Gülçin YILDIRIM
T.C.
BAHÇEŞEHİR ÜNİVERSİTESİ
The Graduate School of Natural and Applied Sciences Computer Engineering
Title of Master Thesis : Drug Dosage Planning of Diabetes Disease: An Application of the Adaptive Network Based Fuzzy Inference System (ANFIS) in Assisting Drug Therapy
Name/Last Name of the Student : Emirhan Gülçin YILDIRIM
Date of Thesis Defense : 01 September 2009
The thesis has been approved by the Graduate School of Natural and Applied Sciences.
Signature
Prof. Dr. A. Bülent ÖZGÜLER Director
This is to certify that we have read this thesis and that we find it fully adequate in scope, quality and content, as a thesis for the degree of Master of Science.
Examining Committee Members Signature
Assoc. Prof. Dr. Adem KARAHOCA (Supervisor)
---ACKNOWLEDGEMENTS
I dedicate this thesis to my father who is my biggest idol in my life. Due to the
contributions and support to my thesis thanks to Dr. Kazım YILDIRIM who is one of the best doctor in the world and he is my father.
I would like to express my gratitude to my supervisor Assoc. Prof. Dr. Adem
KARAHOCA.Without his guidance and persistent help this thesis would not have been possible.
Also I thank to my mother because she always encouraged and love me. Finally I would like to thank to my spouse for his patience.
ABSTRACT
DRUG DOSAGE PLANNING OF DIABETES DISEASE: AN APPLICATION OF THE ADAPTIVE NETWORK BASED FUZZY INFERENCE SYSTEM (ANFIS)
IN ASSISTING DRUG THERAPY
Yıldırım, Emirhan Gülçin
M.S. Department of Computer Engineering Supervisor: Assoc. Prof. Dr. Adem Karahoca
September 2009, 63 pages
Diabetes Mellitus is one of the world’s most widespread diseases. During treatment diabetic patients should be patient and careful. For diabetics, continuous medical supervision and regularly use drugs are required to continue their lives as healthy people. Usually the patients’ age, body mass index, genetic condition, blood and urine test results are used to decide to the appropriate drug doses by doctors.
The aim of this study is, drug dosage planning for diabetic patients using data mining techniques. In this study, ANFIS and Rough Set (RSES) data mining methods are used. Input parameters consisted of gender, age, body mass index, genetics, insulin, fast blood glucose, urine, creatinine, cholesterol, triglyceride, HDL cholesterol, LDL cholesterol, uric acid, glucose in urine, acetone, diabetes type and dose of drugs. Dosage planning made drugs are Glifix, Diamicron, Glucophage, Humilin_M, Novorapid and Insulin Lantus.
As a result of this study, ANFIS give better results than RSES is observed. ANFIS is the most effective data mining technique for dosage planning.
ÖZET
ŞEKER HASTALIĞI İLAÇ DOZAJ PLANLAMA: İLAÇ TEDAVİSİNE YARDIMCI UYARLAMALI NÖRO BULANIK ÇIKARSAMA SİSTEMİ (ANFIS)
UYGULAMASI
Yıldırım, Emirhan Gülçin
Yüksek Lisans, Bilgisayar Mühendisliği Bölümü Tez Yöneticisi: Doç. Dr. Adem Karahoca
Eylül 2009, 63 sayfa
Şeker hastalığı dünyadaki en yaygın hastalıklardan birisidir. Şeker hastaları tedavileri süresince sabırlı ve dikkatli olmalılar. Bu hastaların hayatlarını sağlıklı insanlar gibi devam ettirebilmeleri için sürekli doktor kontrolünde düzenli ilaç kullanmaları gerekmektedir. Doktorlar genelde hastanın yaşına, boy kilo endeksine, genetik durumuna, kan ve idrar tahlili sonuçlarına bakarak uygun ilaç dozuna karar vermektedirler.
Bu çalışmanın amacı, veri madenciliği tekniklerini kullanarak diyabet hastaları için ilaç dozu planlamaktır. Bu çalışmada ANFIS ve Rough Set (RSES) veri madenciliği yöntemleri kullanılmıştır. Kullanılan giriş parametreleri cinsiyet, yaş, boy kilo endeksi, genetik, insulin, açlık kan şekeri, üre, kreatinin, kolesterol, trigliserit, HDL kolesterol, LDL kolesterol, ürik asit, idrarda bulunan glukoz, aseton, diyabet tipi ve ilaç dozudur. Dozaj planlaması yapılan ilaçlar Glifix, Diamicron, Glucophage, Humilin_M, Novorapid ve Insulin Lantus’tur.
TABLE OF CONTENTS
ABSTRACT... ii ÖZET... iii TABLE OF CONTENTS ... iv LIST OF TABLES ...v LIST OF FIGURES ... viLIST OF ABBREVIATIONS ... viii
1. ...I NTRODUCTION...1
1.1 ...P ROBLEM DEFİNİTİON ...1
1.1.1...D iagnosis of Diabetes Type ...2
1.1.2...P rediction of Medicine Each Diabetes Type ...2
1.1.3...M edicine Dosage Planning ...2
1.1.4...I nsulin Injection Dosage Planning ...3
1.2 ...B ACKGROUND ...3
1.2.1...L iterature Survey ...3
2. ...M ATERIAL & METHODS ...6
2.1 ...P REPARING DIABETES DATA SET ...6
2.2 ...A DAPTIVE NEURO FUZZY INFERENCE SYSTEM (ANFIS) ...18
3. ...F
INDINGS ...23
3.1 ...A NFIS RESULTS ...24
3.2 ...R OUGH SET RESULTS ...54
4. ...C ONCLUSION AND FUTURE PLANS ...62
5...R EFERENCES ...64
LIST OF TABLES
Table 2.1: Distribution of data use in the checking and training data sets by medicines ...6Table 2.2: Glifix dosage planning parameters used for fuzzy modelling ...7
Table 2.3: Diamicron dosage planning parameters used for fuzzy modelling ...8
Table 2.4: Glucophage dosage planning parameters used for fuzzy modelling ...9
Table 2.5: Humilin_M dosage planning parameters used for fuzzy modelling ...10
Table 2.6: Novorapid dosage planning parameters used for fuzzy modelling ...11
Table 2.7: Insulin Lantus dosage planning parameters used for fuzzy modelling ...12
Table 2.8: Parameter Values ...14
Table2.9: Glifix Dataset’s Ranked Attributes ...15
Table2.10: Diamicron Dataset’s Ranked Attributes ...16
Table2.11: Glucophage Dataset’s Ranked Attributes ...16
Table 3.2: The Comparison of ANFIS and RSES RMSE rates ...23
LIST OF FIGURES
Figure 2.1: Sugeno fuzzy inference system ...20Figure 2.2: ANFIS architecture ...20
Figure 3.1: ANFIS Training data Plot of Glifix dataset ...24
Figure 3.2: ANFIS checking data Plot of Glifix dataset ...24
Figure 3.3: Surface Plot of FBS and Age versus Output of Glifix dataset. ...26
Figure 3.4: Roc curve of Glifix dataset...28
Figure 3.5: ANFIS model structure of Glifix dataset ...28
Figure 3.6: ANFIS Training data Plot of Diamicron dataset ...29
Figure 3.7: ANFIS checking data Plot of Diamicron dataset ...29
Figure 3.8: Surface Plot of FBS and Age versus Output of Diamicron dataset ...31
Figure 3.9: Roc curve of Diamicron dataset ...33
Figure 3.10: Anfis model structure of Diamicron dataset ...33
Figure 3.14: Roc curve of Glucophage dataset ...38
Figure 3.15: ANFIS model structure of Glucophage dataset ...38
Figure 3.16: ANFIS Training data Plot of Humilin_M dataset ...39
Figure 3.17: ANFIS checking data Plot of Humilin_M dataset ...39
Figure 3.18: Surface Plot of FBS and Age versus Output ...41
Figure 3.19: Roc curve of Humilin_M dataset ...42
Figure 3.20: Anfis model structure of Humilin_M dataset ...43
Figure 3.21: ANFIS Training data Plot of Novorapid dataset ...43
Figure 3.22: ANFIS checking data Plot of Novorapid dataset ...44
Figure 3.23: Surface Plot of FBS and Age versus Output ...46
Figure 3.24: Roc curve of Novorapid dataset ...48
Figure 3.25: Anfis model structure of Novorapid dataset ...48
Figure 3.26: ANFIS Training data Plot of Insulin Lantus dataset ...49
Figure 3.27: ANFIS checking data Plot of Insulin Lantus dataset ...49
Figure 3.28: Surface Plot of FBS and Age versus Output ...51
Figure 3.29: Roc curve of Insulin Lantus dataset ...53
LIST OF ABBREVIATIONS
Adaptive Neuro Fuzzy Inference System : ANFIS
Rough Set Exploration System : RSES
Root Mean Square Error : RMSE
Body Mass Index : BMI
High Density Lipoprotein : HDL
Low Density Lipoprotein : LDL Fast Blood Sugar : FBS
Glucose in Urine : GU
Diabetes Mellitus : DM
1. INTRODUCTION
1.1 PROBLEM DEFINITION
Human body needs energy for activation. The carbohydrates are broken down to glucose. Glucose is the primarily importance energy source for the human body cells. Insulin is needed for glucose transport to body cells (Williams & Wilkins 2007 pg: 15). The human body needs steady stead blood glucose. These supply with insulin and glucagon hormones which produced by pancreas. Insulin hormones produced by the beta cells of the islets of langerhans and glucagon hormones are produced by the alpha cells of the islets of langerhans in the pancreas. When the blood glucose increases, beta cells are stimulated and insulin given to the blood. Insulin enables blood glucose to get in to the cells and this glucose used for energy. So blood glucose kept in a narrow range (Porte, Robert, Sherwin, & Baron 2003).
Diabetes Mellitus is a disorder caused by decreased production of insulin or by decreased ability to use insulin, for this reason glucose levels in the blood increases. Diabetes increases the risks of developing heart disease, kidney disease, blindness, nerve damage and blood vessel damage (An expert system approach based on principal component analysis and adaptive neuro-fuzzy inference system to diagnosis of diabetes disease (Polat & Gunes 2006). Diabetes Mellitus is a widespread disease in the world and researchers attach importance for the diagnosing and predicting of this disease. Diabetes Mellitus is divided into two types: Type1 diabetes and Type2 diabetes. Type1 diabetes (insulin dependent diabetes, IDDM) occurs when the pancreas no longer produces any or very little insulin as a result of autoimmune destruction of beta cells. It usually develops in childhood or adolescence and affects 10percent of people with diabetes. Different from Type1, Type2 diabetes (non insulin dependent diabetes, NIDDM) occurs when the pancreas does not produce enough insulin to meet the body’s
1.1.1 Diagnosis of Diabetes Type
This research analysis has two essential types. Nowadays, diabetes patients two kind of symptoms appear. These are Type1 and Type2 Diabetes Mellitus. For separation of Type1 and Type2 diabetes mellitus checked on fast blood sugar, insulin, c_peptide, triglyceride and acetone levels. At Type1 diabetes; fast blood sugar level is over 180 mg/dl , insulin level is under 2 mcg/dl, the blood has not include c_peptide and urine has include acetone. However, Type2 diabetes; fast blood sugar level is over 125 mg/dl, insulin level is over 20 mcg/dl, the blood includes c_peptide and urine has not include acetone. Type2 diabetes patients have high triglyceride level. This is not valid for Type1 diabetes patients because at Type1 diabetes patients usually have normal triglyceride level.
1.1.2 Prediction of Medicine Each Diabetes Type
Nowadays, insulin injection is the only treatment method for type1 diabetes. Daily insulin requirement varies depending on the patients’ body mass index, age, food consumption and activity level. A treatment is a factor that affects the Type2 diabetes mellitus is diet, activity, short acting insulin injection and medical such as metformin, sulphonylurea. Treatment method has various types which are changes with patients’ blood glucose level, age, body mass index, genetic, food consumption and activity level.
1.1.3 Medicine Dosage Planning
Oral medicine treatment applied for Type2 diabetes mellitus. Beside this treatment, some of different treatments are proved. These are gets on a diet and make some exercises. Drug treatment starts with metformin (Glucophage) or gliclazide (Diamicron) included medicines. If the patients are not overweight or obese, patients will begin to
1.1.4 Insulin Injection Dosage Planning
Insulin dosage adjustments based on blood glucose levels. Nowadays, doctors generally using two type of insulin injection; regular insulin and NPH (Neutral Protamine Hagedorn) insulin. Regular insulin is rapid or short acting insulin. Rapid acting insulin starts being absorbed in 30-60 minutes, and has their peak action within 2 to 3 hours of injection in most individuals. Regular insulin is often used before eating to control the large rise of blood glucose that often occurs after a meal.
NPH insulin is slow or long acting insulin. NPH insulin being absorbed 3-4 hours after injection and have their peak action after 7-9 hours. The best act is injection at bedtime to control the morning glucose of the next day
(http://www.diabetesnet.com/diabetes_treatments/ 2009).
1.2 BACKGROUND
Data mining techniques have been applying for existed comprehensive diabetic records for decades. Data mining, (knowledge discovery in databases (KDD)) is the process of analyzing data and summarizing the useful information which can be use to make predictions for future experiments. The aim of this study is diabetes patients’ drug dosage planning by using ANFIS (adaptive neuro fuzzy inference system). Besides, I will notice some researches like this study.
1.2.1 Literature Survey
There have been a lot of studies about using data mining techniques with diabetes mellitus data. One of them is Data mining for the Diagnosis of Type 2 Diabetes from three Dimensional Body Surface Anthropometrical Scanning Data. This study is about
Another study of these is an expert system approach based on principal component analysis and adaptive neuro-fuzzy inference system to diagnosis of diabetes disease. This study is about improving the diagnostic accuracy of diabetes disease combining PCA and ANFIS. There were two classes as healthy and patient. The obtained sensitivity, specificity and MSE values by PCA-ANFIS for diabetes are 85.71percent, 92.0 percent and 0.262 (Polat & Gunes 2006).
A different study is feature selection and classification model construction on Type 2 diabetic patient’s data. This study defines significant factors influencing diabetes control, by applying feature selection to a working patient management system to assist with ranking, classification and knowledge discovery. There is 2064 Type 2 diabetic patients’ information. To improve the computational efficiency, they used to rank the attributes. Age, diagnosis duration, insulin treatment, random blood glucose, diet treatment are the most important factors influencing blood glucose control. After that, they applied Naïve Bayes, IB1 and C4.5 classification techniques. The models provided a best predictive accuracy of 95 percent and sensitivity of 98 percent. In this study the obtained results are, IB1 is the best classification, Naïve Bayes process the data fastest and C4.5 is the most stable classifier with the highest precision and the best balance between sensitivity and specificity (Sigurdardottir, Jonsdottir & Benediktsson 2007). Another one is a comparative study on diabetes disease diagnosis using neural networks. In this study a comparative Pima Indian diabetes disease diagnosis was realized. Pima Indian diabetes dataset is used. There are 768 samples. Multilayer neural network structure and a probabilistic neural network structure were used. They obtained 82.37 percent classification accuracy for multilayer neural network and 66.78 percent for ANFIS (Temurtas, Yumusak & Temurtas 2008).
A further study is outcomes of educational interventions in Type 2 diabetes: WEKA data mining analysis. The aim of this study is to enhance diabetes related self-care that contributes to good metabolic control which minimizes the occurrence of both acute and
An altered study is Data Mining Diabetic Databases: Are Rough Sets a Useful Addition? This study is about analyzing a diabetic dataset with rough sets. Rough set is applied to Pima Indian Diabetic Database. Rosetta software is used. 392 data is selected randomly. It divided into training (300) and testing (92). In this study discretization method is used best with Johnson algorithm. 82.6 percent accuracy rate is observed (Breault).
Besides all these, another study is developing an expert-system for diabetics by supporting with ANFIS. The aim of this study is arranging an expert system to help dosage planning. It used data mining with a knowledge based on diabetic patients. In this study classification and association rules data mining techniques and ANFIS applied. 390 patients’ records are used as 300 for training and 90 are used for checking (Kara 2008).
The last study is prediction of cyclosporine A blood levels: an application of the adaptive-network-based fuzzy inference system (ANFIS) in assisting drug therapy. In this study therapeutic drug monitoring is observed. The aim of the study is predicting the concentration of cyclosporine A level in blood. ANFIS is used for predicting cyclosporine A level in blood. 654 TDM assays are collected from 138 patients. 473 records are used for training and 181 records are used for checking (Goren, Karahoca, Onat, & Goren 2008).
2. MATERIAL & METHODS
In this study, diabetics’ data is collected from hospitals in Turkey. After the collecting data, information extracting is realized by using data segmentation process. The collected data are arranged for use in data mining techniques.
2.1 PREPARING DIABETES DATA SET
Diabetes Mellitus assays carried out in 2008 and 2009 on diabetes patients who made laboratory tests in State Hospitals were included in this study. In this research, collected blood and urine samples were analyzed in State Hospital Laboratories.
Data on the total of 318 diabetes assays were collected from 89 patients (44 Type1 DM, 45 Type 2 DM). The data collected for each assays were gender, age of patient (years), body mass index of patient, genetic (parents of patients were diabetic or not), blood insulin (mcg/dl), c_peptide, fast blood sugar (FBS)(mg/dl), urine in blood (mg/dl), creatinine (mg/dl), total cholesterol (mg/dl), triglyceride (mg/dl), high density lipoprotein (HDL)(mg/dl), low density lipoprotein (LDL)(mg/dl), uric acid (mg/dl), acetone in urine (mmol/l) and glucose in urine (mmol/l). Diabetic patients use drugs and injections to reduce blood insulin level in a narrow range.
In this research, drug dosage planning made. These drugs are Glifix, Diamicron, Glucophage, Humilin_M, Novorapid and Insulin Lantus. ANFIS algorithm is help to planning to degree of opponent medicine for both types of diabetes patients. Some basis population statistics for the training and checking sets of used medicines are shown in Table 2.1.
Table 2.1: Distribution of data use in the checking and training data sets by medicines
Drug Checking Data (n) Training Data (n)
The mean, ranges of the parameters and standard deviation of parameters are calculated with drugs basis. Calculation formula of standard deviation is below formula 2.1.
(2.1)
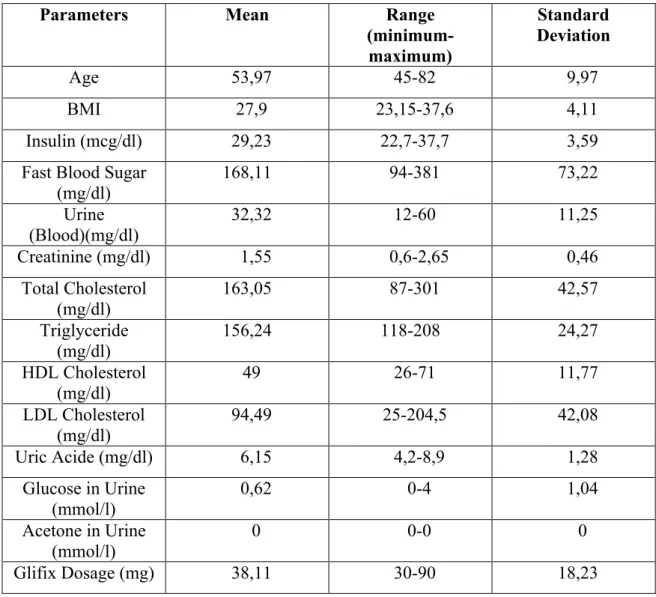
As the data in the table Glifix parameters, the maximum and minimum range and standard deviation and the average are given in Table 2.2.
Table 2.2: Glifix dosage planning parameters used for fuzzy modelling
Parameters Mean Range (minimum-maximum) Standard Deviation Age 53,97 45-82 9,97 BMI 27,9 23,15-37,6 4,11 Insulin (mcg/dl) 29,23 22,7-37,7 3,59
Fast Blood Sugar (mg/dl) 168,11 94-381 73,22 Urine (Blood)(mg/dl) 32,32 12-60 11,25 Creatinine (mg/dl) 1,55 0,6-2,65 0,46 Total Cholesterol (mg/dl) 163,05 87-301 42,57 Triglyceride (mg/dl) 156,24 118-208 24,27 HDL Cholesterol (mg/dl) 49 26-71 11,77 LDL Cholesterol (mg/dl) 94,49 25-204,5 42,08 Uric Acide (mg/dl) 6,15 4,2-8,9 1,28 Glucose in Urine (mmol/l) 0,62 0-4 1,04 Acetone in Urine (mmol/l) 0 0-0 0 Glifix Dosage (mg) 38,11 30-90 18,23
Table 2.3: Diamicron dosage planning parameters used for fuzzy modelling
Parameters Mean Range (minimum-maximum) Standard Deviation Age 56,7 40-82 10,78 BMI 27,65 21,6-40,5 3,14 Insulin (mcg/dl) 29,56 17,6-37,7 4,94
Fast Blood Sugar (mg/dl) 171,03 87-381 68,9
Urine (Blood)(mg/dl) 38,21 12-180 28,19 Creatinine (mg/dl) 1,66 0,6-4,2 0,67 Total Cholesterol (mg/dl) 194,16 117-480 63,61 Triglyceride (mg/dl) 170,28 107-320 39,55 HDL Cholesterol (mg/dl) 48,25 21,8-76 12,64 LDL Cholesterol (mg/dl) 118,38 32,8-399,4 61,48 Uric Acide (mg/dl) 5,98 3,7-9,9 1,48
Glucose in Urine (mmol/l) 0,58 0-4 0,93
Acetone in Urine (mmol/l) 0 0-0 0
Diamicron Dosage (mg) 95,23 60-120 16,71
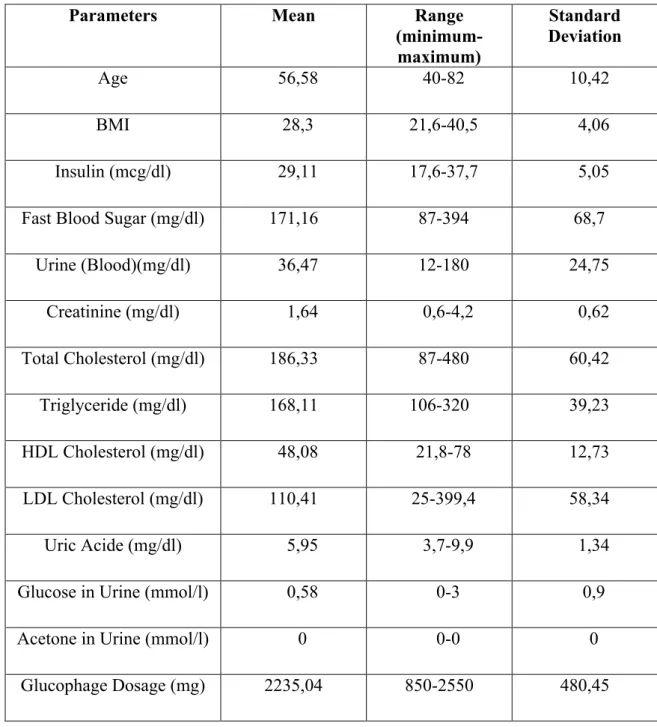
As the data in the table Glucophage parameters, the maximum and minimum range and standard deviation and the average is given in Table 2.4.
Table 2.4: Glucophage dosage planning parameters used for fuzzy modelling
Parameters Mean Range (minimum-maximum) Standard Deviation Age 56,58 40-82 10,42 BMI 28,3 21,6-40,5 4,06 Insulin (mcg/dl) 29,11 17,6-37,7 5,05
Fast Blood Sugar (mg/dl) 171,16 87-394 68,7
Urine (Blood)(mg/dl) 36,47 12-180 24,75 Creatinine (mg/dl) 1,64 0,6-4,2 0,62 Total Cholesterol (mg/dl) 186,33 87-480 60,42 Triglyceride (mg/dl) 168,11 106-320 39,23 HDL Cholesterol (mg/dl) 48,08 21,8-78 12,73 LDL Cholesterol (mg/dl) 110,41 25-399,4 58,34 Uric Acide (mg/dl) 5,95 3,7-9,9 1,34
Glucose in Urine (mmol/l) 0,58 0-3 0,9
Acetone in Urine (mmol/l) 0 0-0 0
Glucophage Dosage (mg) 2235,04 850-2550 480,45
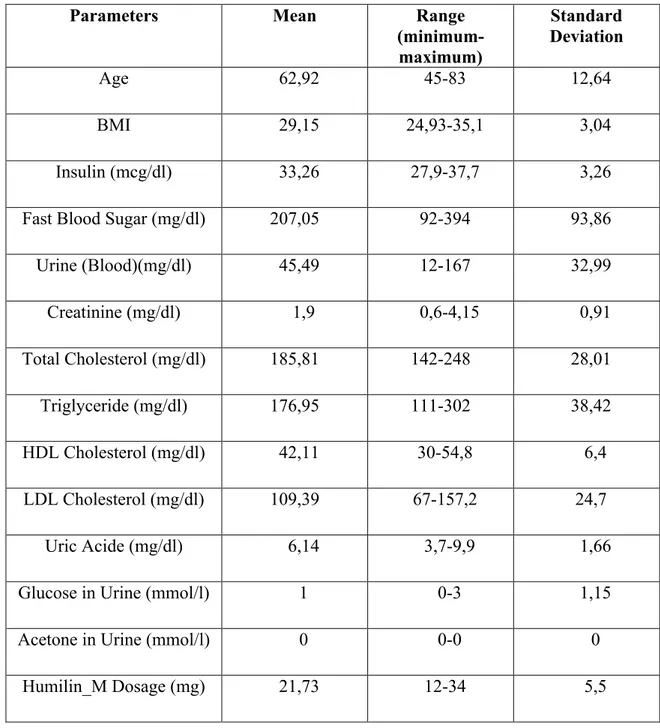
As the data in the table Humilin_M parameters, the maximum and minimum range and standard deviation and the average is given in Table 2.5.
Table 2.5: Humilin_M dosage planning parameters used for fuzzy modelling
Parameters Mean Range (minimum-maximum) Standard Deviation Age 62,92 45-83 12,64 BMI 29,15 24,93-35,1 3,04 Insulin (mcg/dl) 33,26 27,9-37,7 3,26
Fast Blood Sugar (mg/dl) 207,05 92-394 93,86
Urine (Blood)(mg/dl) 45,49 12-167 32,99 Creatinine (mg/dl) 1,9 0,6-4,15 0,91 Total Cholesterol (mg/dl) 185,81 142-248 28,01 Triglyceride (mg/dl) 176,95 111-302 38,42 HDL Cholesterol (mg/dl) 42,11 30-54,8 6,4 LDL Cholesterol (mg/dl) 109,39 67-157,2 24,7 Uric Acide (mg/dl) 6,14 3,7-9,9 1,66
Glucose in Urine (mmol/l) 1 0-3 1,15
Acetone in Urine (mmol/l) 0 0-0 0
Humilin_M Dosage (mg) 21,73 12-34 5,5
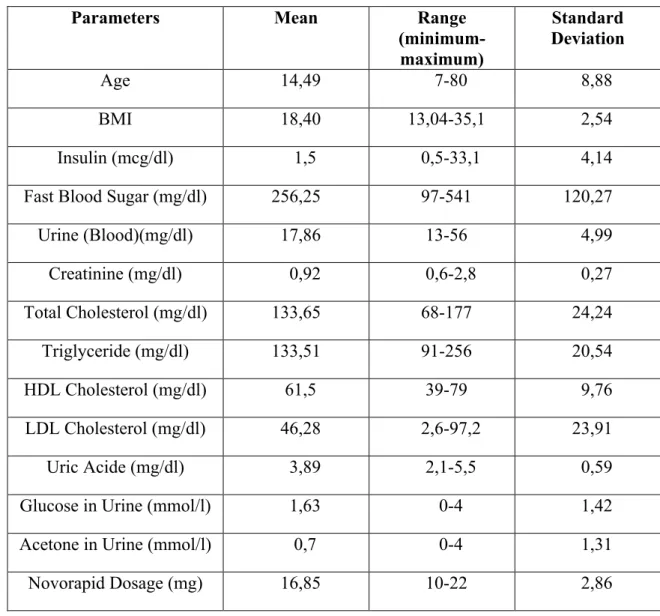
As the data in the table Novorapid parameters, the maximum and minimum range and standard deviation and the average is given in Table 2.6.
Table 2.6: Novorapid dosage planning parameters used for fuzzy modelling
Parameters Mean Range (minimum-maximum) Standard Deviation Age 14,49 7-80 8,88 BMI 18,40 13,04-35,1 2,54 Insulin (mcg/dl) 1,5 0,5-33,1 4,14
Fast Blood Sugar (mg/dl) 256,25 97-541 120,27
Urine (Blood)(mg/dl) 17,86 13-56 4,99 Creatinine (mg/dl) 0,92 0,6-2,8 0,27 Total Cholesterol (mg/dl) 133,65 68-177 24,24 Triglyceride (mg/dl) 133,51 91-256 20,54 HDL Cholesterol (mg/dl) 61,5 39-79 9,76 LDL Cholesterol (mg/dl) 46,28 2,6-97,2 23,91 Uric Acide (mg/dl) 3,89 2,1-5,5 0,59
Glucose in Urine (mmol/l) 1,63 0-4 1,42
Acetone in Urine (mmol/l) 0,7 0-4 1,31
Novorapid Dosage (mg) 16,85 10-22 2,86
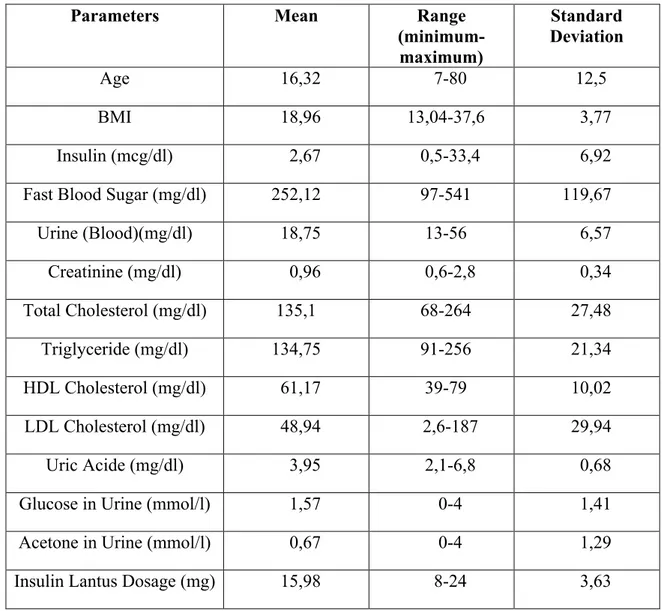
As the data in the table Insulin Lantus parameters, the maximum and minimum range and standard deviation and the average is given in Table 2.7.
Table 2.7: Insulin Lantus dosage planning parameters used for fuzzy modelling
Parameters Mean Range (minimum-maximum) Standard Deviation Age 16,32 7-80 12,5 BMI 18,96 13,04-37,6 3,77 Insulin (mcg/dl) 2,67 0,5-33,4 6,92
Fast Blood Sugar (mg/dl) 252,12 97-541 119,67
Urine (Blood)(mg/dl) 18,75 13-56 6,57 Creatinine (mg/dl) 0,96 0,6-2,8 0,34 Total Cholesterol (mg/dl) 135,1 68-264 27,48 Triglyceride (mg/dl) 134,75 91-256 21,34 HDL Cholesterol (mg/dl) 61,17 39-79 10,02 LDL Cholesterol (mg/dl) 48,94 2,6-187 29,94 Uric Acide (mg/dl) 3,95 2,1-6,8 0,68
Glucose in Urine (mmol/l) 1,57 0-4 1,41
Acetone in Urine (mmol/l) 0,67 0-4 1,29
Insulin Lantus Dosage (mg) 15,98 8-24 3,63
To obtain the data, some algorithms can be used. ANFIS algorithm is one of them. To get the results Anfis model inputs must be entered. You can use the following table for generating ANFIS model is designed according to the data (Table 2.8). Gender can take two values male or female. For male patients gender takes 0 value, for female patients it takes 1 value. Age is segmented in 8 partition, the value ranges is shown in the table. Body mass index (BMI) is divided 5 parts. The formula of BMI is shown in formula
BMI divided in to five parts, between 10-18.5 under weight, 18.51-25 normal, 25.01-30 over weight, 30.01-40 obese and 40.01-70 over obese. Type 1 diabetic patients’ body mass indexes are usually normal and underweight but type 2 patients’ are overweight and obese in general. In general, Type 2 diabetes disease is inherited. Nowadays, according to the research, Type 1 diabetes disease has no relevance with heredity. If the patient’s parents has diabetes mellitus genetic is 1, otherwise genetic is 0. Type 1, diabetes patients’ blood insulin level is under 2 and type 2 diabetes mellitus patients’ blood insulin level is over 20 mcg/dl. Between 2-20 mcg/dl insulin level is normal. Healthy persons and type 2 diabetic patients’ blood has C_peptide in their blood. Only type 1 patients cannot have C_peptide in their blood. C_peptide is a hormone secreted with insulin in the blood. At type 1 diabetes insulin produced any or very little therefore Type 1 diabetes patients’ blood have not got C_peptide in their blood. Fast blood sugar (FBS) is divided into 9 parts. Under 100 mg/dl is normal values. Between 100-125 mg/dl can be a prediabetes, more than 125 mg/dl is diabetic patient. At type1 diabetes, value of FBS is more than 180 mg/dl. The urine level is normal among 10-50 mg/dl. For overage people the acceptable range is 51-75 mg/dl, over 75 mg/dl is an attention for kidney disease. Also high level creatinine causes kidney disease. Over 2 mg/dl for creatinine is acceptable risk of kidney disease. Diabetes triggers high cholesterol and heart disease consequently cholesterol level have to be kept in a narrow range. Over 240 mg/dl is high cholesterol and a risk of heart disease. Until 200 mg/dl is normal level for cholesterol. The patient must be careful for cholesterol level between 200-240 mg/dl because this level is near high level. If the cells could not use glucose to produce energy, so burn fat cells. Then fat cells mobilise and passing through the blood. In this case, triglyceride level increases. As burning fat cells, the body needs just bit insulin. Therefore, Type2 diabetes patients have high triglyceride level. This condition is not valid for Type1 diabetes patients because at Type1 diabetes pancreas cannot produce insulin. Normal degree of Triglyceride level is under 150 mg/dl normal, between 150-199 mg/dl is near high level and over 200 mg/dl is considered high level. Over 60 mg/dl
mg/dl is high LDL level and over 190 mg/dl is very high LDL level. High Uric acid level is associated with type 2 diabetes. Over 8 mg/dl is accepted high level for uric acid. If the insulin level is approximate to zero, acetone will appears in urine. At type 1, in the urine of patients has included acetone. High level fast blood sugar (FSB) is caused glucose in urine.
Table 2.8: Parameter Values
Parameters Values
Gender Male=1, Female=0
Age 0-7=1, 8-14=2, 15-25=3, 26-35=4, 36-45=5, 46-60=6, 61-70=7, >70=8
BMI 10-18.5=1, 18.51-25=2, 25.01-30=3, 30.01-40=4, 40.01-70=5
Genetic Yes=1, No=0
Insulin (mcg/dl) <2=1, 2-20=2, >20=3
C_peptide Yes=1, No=0
FBS (mg/dl) 0-99=1, 100-125=2, 126-180=3, 181-220=4, 221-300=5, 301-400=6, 401-500=7, 501-600=8, >600=9 Urine (mg/dl) 10-50=1, 51-75=2, >75=3 Creatinine (mg/dl) 0,6-1,2=1, 1,21_2=2, 2,01-3=3, >3=4 Total Cholesterol (mg/dl) 0-200=1, 201-240=2, >240=3 Triglyceride (mg/dl) 0-149=1, 150-199=2, 200-500=3, >500=4 HDL Cholesterol (mg/dl) 0-40=1, 41-60=2, >60=3 LDL Cholesterol (mg/dl) 0-100=1, 101-129=2, 130-159=3, 160-190=4, >190=5 Uric Acid (mg/dl) 2-5=1, 5.01-8=2, >8=3
Attribute Ranking applied to all datasets at WEKA. Ranked values equal to zero, the columns have been eliminated. These eliminated data sets are used with ANFIS.
The ranking results for Glifix dataset is shown in Table 2.9. For these results DM, C_peptide, As and Insulin columns are discarded.
Table 2.9: Glifix Dataset’s Ranked Attributes
Ranked Value Parameter
0.34699 LDL 0.2993 BMI 0.27814 HDL 0.26717 Age 0.24116 Creatinine 0.23466 FBS 0.21232 Gender 0.08972 Total Cholesterol 0.08298 Uric Acid 0.06462 Genetic 0.02571 Urine 0.0156 Triglyceride 0.0023 GU 0 DM 0 C_peptide 0 As 0 Insulin
Table2.10: Diamicron Dataset’s Ranked Attributes
Ranked Value Parameter
0.32363 Age 0.22956 Uric Acid 0.16727 FBS 0.13014 HDL 0.09346 GU 0.09167 Creatinine 0.08285 LDL 0.06835 BMI 0.04813 Cholesterol 0.04245 Urine 0.03274 Gender 0.02539 Triglyceride 0.01361 Insulin 0.00681 Genetic 0 DM 0 As 0 C_peptide
The ranking results for Glucophage dataset is shown in Table 2.11. For these results DM, C_peptide and As columns are discarded.
Table2.11: Glucophage Dataset’s Ranked Attributes
Ranked Value Parameter
0.12581 Age 0.09017 Uric Acid 0.089 BMI 0.06656 Creatinine 0.06335 HDL 0.05926 LDL 0.04228 Insulin 0.03856 FBS 0.02684 Cholesterol 0.02522 Urine 0.0249 Triglyceride 0.02245 GU
The ranking results for Humilin_M dataset is shown in Table 2.12. For these results As, DM, Insulin and C_peptide columns are discarded.
Table2.12: Humilin_M Dataset’s Ranked Attributes
Ranked Value Parameter
0.78 Creatinine 0.737 FBS 0.691 LDL 0.653 GU 0.589 Age 0.539 Cholesterol 0.53 Urine 0.434 Uric Acid 0.386 BMI 0.352 Gender 0.34 Triglyceride 0.248 HDL 0.104 Genetic 0 As 0 DM 0 Insulin 0 C_peptide
The ranking results for Novorapid dataset is shown in Table 2.13. For these results Cholesterol and LDL columns are discarded.
Table2.13: Novorapid Dataset’s Ranked Attributes
Ranked Value Parameter
0.4018 FBS 0.3174 GU 0.3064 As 0.1193 Creatinine 0.0774 Triglyceride 0.058 Age 0.0498 HDL 0.0426 Genetic 0.0425 BMI 0.0231 Uric Acid
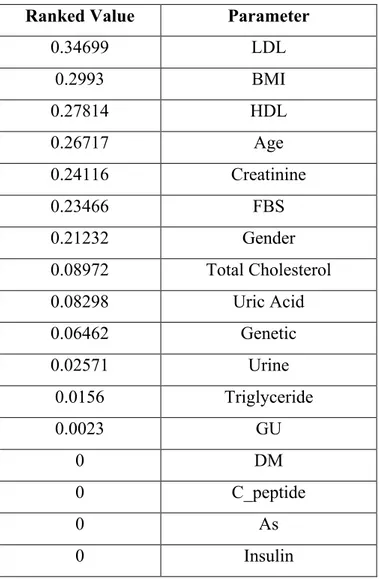
The ranking results for Insulin Lantus dataset is shown in Table 2.14. For these results Urine column is discarded.
Table2.14: Insulin Lantus Dataset’s Ranked Attributes
Ranked Value Parameter
0.3205 FBS 0.2425 GU 0.242 BMI 0.236 Age 0.2019 Creatinine 0.1455 As 0.1453 C_peptide 0.1453 DM 0.1453 Insulin 0.143 Triglyceride 0.0888 LDL 0.0805 HDL 0.0701 Genetic 0.0659 Uric Acid 0.0551 Cholesterol 0.0445 Gender 0 Urine
2.2 ADAPTIVE NEURO FUZZY INFERENCE SYSTEM (ANFIS)
In this study, Fuzzy Inference System is used to evaluate the diabetes data set for planning the dosages of the medicines.
Fuzzy inference system is mapping a given input to an output using fuzzy logic. The fuzzy inference systems are used in fields such as automatic control, data classification, decision analysis, expert systems and computer vision (Guopeng & Levin 2006). The Fuzzy logic which is based on the linguistic expression is an artificial intelligence technique. The fuzzy logic approach is published by Zadeh to define the complicated systems. Adaptive Neuro Fuzzy Inference System (ANFIS) is the combination of ANN and the fuzzy logic. ANFIS is a multilayer feed forward network which uses ANN
fuzzy modelling. The fuzzy inference system’s process consists of several components which are membership functions, fuzzy logic operators, and if-then rules (Zadeh 1965). A fuzzy set is similar with the classical set. X is the universe and its elements are signed by x and so a fuzzy set A in X is defined as below;
µA(x) is called the membership function of x in A.
The fuzzy operators are the fuzzy intersection or conjunction (AND), fuzzy union or disjunction (OR) and fuzzy complement (NOT). Fuzzy sets and fuzzy operators are the subjects and verbs of fuzzy logic.
Fuzzy inference system uses if-then statements and the connectors present in the rule statement are ‘OR’ or ‘AND’ to make the necessary decision rules. Simple form of
if-then rule statement is:
if x is A and y is B then z=f(x,y)
A and B are linguistic values defined by fuzzy sets, z=f(x,y) is a zero or first order polynomial function (Jang JSR 1993).
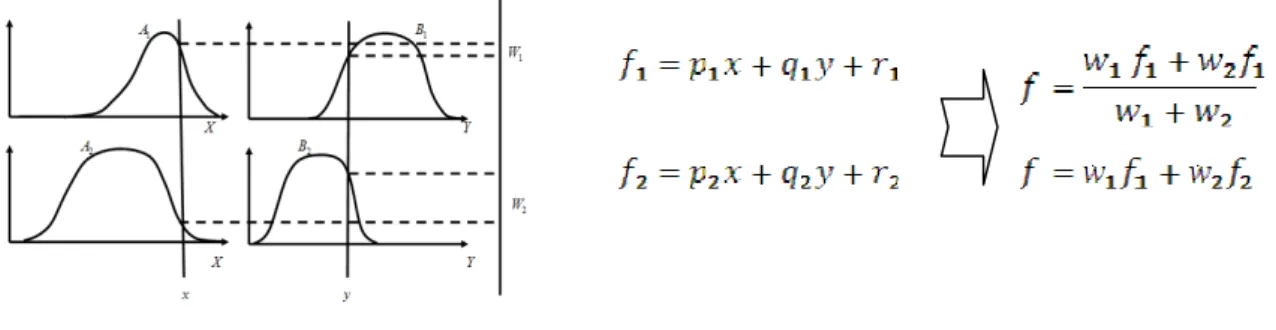
In this research, Takagi and Sugeno type fuzzy if-then rules are used such that the output of each rule is a linear combination of input variables plus a constant term. The final output is the weighted average of each rule’s output. ANFIS is a fuzzy rule based classifier in which the rules are learnt from examples that use a standard back propagation algorithm. Anfis uses Sugeno type fuzzy system which is a linear equation (first order Sugeno inference system) or constant coefficients (zero-order Sugeno
Rule1: IF x is A1 and y is B1THEN f1 = p1x + q1y + r1.
Rule2: IF x is A2 and y is B2 THEN f2 = p2x + q2y + r2
The inputs are x and y to the node i , Ai and Bi are characterized by convenient membership functions and pi, qiand ri are the consequence parameters (i = 1,2,...). The structure of first order Sugeno fuzzy inference system is shown in Figure 2.1.
Figure 2.1: Sugeno fuzzy inference system
The ANFIS architecture is shown in Figure 2.2. The nodes of the same layer have the same functions.
Figure 2.2: ANFIS architecture
Layer 1: In this layer every node is adaptive. x (or y) is the input to node i, (or ) is linguistic label, is the membership function of . { , , } is the parameter set which called premise parameters, values effects the membership function as you can see at the equations below (2.2.1):
(2.3)
(2.4)
Layer 2: Every node in this layer is a fixed node labelled Π which calculates the
incoming signals and sends the product out.
(2.5)
Layer 3: Every node in this layer is a fixed node and labelled N. The node calculates the ratio of the rules firing strength to the sum of all rules’ firing strengths. The outputs are called normalized firing strengths.
(2.6)
Layer 4: Every node in this layer is adaptive node with a node function:
(2.7) The consequent parameter set is {p, q, r}. is a normalized firing strength from the result of layer 3.
Layer 5: The single node in this layer labelled ∑ which computes the overall output as the summation of all incoming signals.
2.3 ROUGH SET THEORY
The rough set theory is developed by Pawlak. It is interested in classificatory analysis of data sets. Rough Set analysis aim is to synthesize approach of concepts from the acquired data. Its principle is every object of the universe is associated some information. Because, the same information with some elements interdependent by the result (Jaafar, Jais, Hamid, Rahman, & Benaouda 2006).
From this origin, two different elements can be indiscernible in view of the available information. Information related with objects of the universe generates a relation on its elements.
Any subset of the universe is characterized by two ordinary sets. These are lower and upper approximations. The lower approximation of the target set consists of only those objects. That can positively identified as members of the set. The upper approximation includes all objects but some objects of upper approximation may not be the members of the target set. The lower approximation’s objects has the probability=1 while the upper approximation’s objects has the non-zero probability. (Polkowski & Skowron 1998)
The rough set occur combining of the lower and upper approximations. The Rough Set methods are applied as a component of hybrid solutions in data mining. The Rough Set data information model is collected in a table. The main purposes of analyzing data with Rough Set are data reduction, missing value handling, feature selection and feature extraction. (Magnani 2003)
3. FINDINGS
The results of this study are mentioned in this part. I applied ANFIS and Rough Set methods to the data sets. The results of ANFIS and Rough set methods are compared. There are six data sets which are Glifix, Diamicron, Glucophage, Humilin_M, Novorapid and Insulin Lantus datasets. Matlab 7.5.0 Fuzzy Toolbox is used for ANFIS method. ROSETTA software is used for Rough set algorithm. The sensitivity results of ANFIS and RSES are shown in table 3.1. The comparison of ANFIS and RSES RMSE rates are shown in table 3.2.
Table 3.1: The sensitivity results of ANFIS and RSES.
Dataset ANFIS RSES
Glifix 82% 80% Diamicron 78% 70% Glucophage 75% 67% Humilin_M 72% 65% Novorapid 73% 47% Insulin Lantus 74% 60%
Table 3.2: The Comparison of ANFIS and RSES RMSE rates.
Dataset ANFIS RMSE RSES RMSE
Glifix 18% 50% Diamicron 11% 10% Glucophage 21% 61% Humilin_M 19% 25% Novorapid 18% 32% Insulin Lantus 18% 50%
3.1 ANFIS RESULTS
First I will start to introduce with Glifix dataset’s ANFIS results. 25 data used for training and 12 data used for checking from Glifix dataset. Training and checking data distribution are shown in figure 3.1 and 3.2. The performance of ANFIS for Glifix dataset has seen in figure 3.2. Points show actual output values and predicted output values.
Figure 3.1: ANFIS Training data Plot
Figure 3.2: ANFIS checking data Plot
Rule 1 : [0 5 3 0 3 1 2 2 2 2 3 2 0][1]
If Gender =0 and Age=5 and Body Mass Index=3 and Genetic=0 and Fast Blood Sugar=3 and Urine=1 and Creatinine=2 and Cholesterol=2 and Triglyceride=2 and HDL=2 and LDL=3 and Uric Acide=2 and Glucose in Urine=0 then Output is 1.
Rule 2 : [0 6 3 0 3 1 2 2 2 2 3 2 0][1]
If Gender =0 and Age=6 and Body Mass Index=3 and Genetic=0 and Fast Blood Sugar=3 and Urine=1 and Creatinine=2 and Cholesterol=2 and Triglyceride=2 and HDL=2 and LDL=3 and Uric Acide=2 and Glucose in Urine=0 then Output is 1.
Rule 3 : [0 6 3 1 3 1 2 2 2 2 3 2 0][2]
If Gender =0 and Age=6 and Body Mass Index=3 and Genetic=1 and Fast Blood Sugar=3 and Urine=1 and Creatinine=2 and Cholesterol=2 and Triglyceride=2 and HDL=2 and LDL=3 and Uric Acide=2 and Glucose in Urine=0 then Output is 2.
Rule 4 : [1 6 3 1 3 2 2 2 2 2 3 2 0][1]
If Gender =1 and Age=6 and Body Mass Index=3 and Genetic=1 and Fast Blood Sugar=3 and Urine=2 and Creatinine=2 and Cholesterol=2 and Triglyceride=2 and HDL=2 and LDL=3 and Uric Acide=2 and Glucose in Urine=0 then Output is 1.
Rule 5 : [0 7 3 0 4 2 2 2 2 2 3 3 1][2]
If Gender =0 and Age=7 and Body Mass Index=3 and Genetic=0 and Fast Blood Sugar=4 and Urine=2 and Creatinine=2 and Cholesterol=2 and Triglyceride=2 and HDL=2 and LDL=3 and Uric Acide=3 and
Fast Blood Sugar=6 and Urine=2 and Creatinine=1 and Cholesterol=3 and Triglyceride=3 and HDL=2 and LDL=5 and Uric Acide=3 and Glucose in Urine=1 then Output is 3.
Rule 7 : [0 7 3 1 5 1 2 2 2 2 3 1 1][2]
If Gender =0 and Age=7 and Body Mass Index=3 and Genetic=1 and Fast Blood Sugar=5 and Urine=1 and Creatinine=2 and Cholesterol=2 and Triglyceride=2 and HDL=2 and LDL=3 and Uric Acide=1 and Glucose in Urine=1 then Output is 2.
The above rules are in different situations for trained ANFIS model. Each rule is represented by a vector. It consists of input values for the system. For Glifix dataset LDL parameter’s ranking ratio is 34 percent, BMI parameter’s ranking ratio is 29 percent, HDL parameter’s ranking ratio is 27 percent, age parameter’s ranking ratio is 26 percent, creatinine parameter’s ranking ratio is 24 percent, FBS parameter’s ranking ratio is 23 percent, gender parameter’s ranking ratio is 21 percent, cholesterol parameter’s ranking ratio is 8 percent, uric acid parameter’s ranking ratio is 8 percent and genetic parameter’s ranking ratio is 6 percent. These parameters are more effective than the others. Also for ANFIS these parameters are used more effective than others. Descriptions of the rules which are generated by ANFIS for Glifix dataset are below.
In rule 1, the patient is overweight, fast blood glucose level is between 126 and 180. It has boarder line high LDL level. HDL has a critical level and triglyceride is near high level. According to these values, this patient is observed a Type 2 diabetes patient. FBS is the most decisive parameter for determining diabetes. According to the range of FBS values, the patient is Type 2 diabetes patient. Type 2 patients has high ratio of triglyceride. For this parameters patient has Type 2 diabetes. The output is 1 which means that Glifix dosage level is 30 mg. Age, genetic, gender, urine and uric acid are strongly affects the output parameter. The other parameters creatinine and cholesterol are also affects the output.
Rule 2 is similar to rule 1. Difference from first rule, this patient is over middle age. Age is one of the parameter which strongly affects the output. The other parameters are in the same class with rule 1. Only the age parameter’s class changed to 6. This variation is not change the output. Output is 1 so Glifix dosage is 30 mg.
Rule 3 is similar with rule 2. The only difference is genetic changes. This patient’s parents have diabetes disease. The farther parameters are in the same classes with rule 2. Genetic is one of the parameters that affect the output. In this rule genetic is positive and output is 2 so Glifix dosage is 60 mg/dl.
In Rule 4, this patient is over middle age, overweight, urine is near high level, FBS level is between 126 and 180, LDL level is borderline high level, HDL and creatinine levels are acceptable normal and triglyceride level is near high level. Genetic is positive. The patient’s FBS level is not very high so drug treatment can be started at low doses according to these parameter levels. Patient has Type 2 diabetes. ANFIS generated the output 1 which means Glifix dosage is 30 mg.
In rule 5, FBS level takes place between 181- 220 mg/dl and patient’s urine has glucose. Age level is over aged, genetic is negative and gender is female. According to these values patient has Type 2 diabetes. The other parameters are similar with rule 4.
patient is over aged and FBS level is very high. This patient has Type 2 diabetes. Therefore, high dose drug treatment should be started. Our system generates the output 3 that means 90 mg Glifix should be started.
In rule 7, urine, creatinine, cholesterol, triglyceride, HDL, LDL and uric acid levels can be accepted normal. Age level and BMI levels are over normal level. Genetic is positive. FBS level is high, so generated output is 2. According to output patient have to use 60 mg Glifix.
Roc curve of Glifix dataset is shown in figure 3.4:
Figure 3.4: Roc curve of Glifix dataset.
ANFIS model structure of Glifix dataset is shown in figure 3.5. There are 13 inputs and one output.
The other dataset is Diamicron which results I will introduce. 58 data used for training and 28 data used for checking from Diamicron dataset. Training and checking data distribution are shown in figure 3.6 and 3.7. The performance of ANFIS for Diamicron dataset has seen in figure 3.7. Points show actual output values and predicted output values.
Figure 3.6: ANFIS Training data Plot
Figure 3.7: ANFIS checking data Plot
Rule 1 : [0 6 3 0 2 3 2 2 2 2 2 3 2 2 ][3]
If Gender=0 and Age=6 and Body Mass Index=3 and Genetic=0 and Insulin=2 and Fast Blood Sugar=3 and Urine=2 and Creatinine=2 and Cholesterol=2 and Triglyceride=2 and HDL=2 and LDL=3 and Uric Acid=2 and Glucose in Urine=2 then Output is 3.
Rule 2 : [0 7 4 0 3 4 2 2 2 2 2 3 2 2][4] If Gender=0 and Age=7 and Body Mass Index=4 and Genetic=0 and Insulin=3 and Fast Blood Sugar=4 and Urine=2 and Creatinine=2 and Cholesterol=2 and Triglyceride=2 and HDL=2 and LDL=3 and Uric Acid=2 and Glucose in Urine=2 then Output is 4.
Rule 3 : [1 5 2 0 2 3 1 1 1 2 2 3 2 0][2] If Gender=1 and Age=5 and Body Mass Index=2 and Genetic=0 and Insulin=2 and Fast Blood Sugar=3 and Urine=1 and Creatinine=1 and Cholesterol=1 and Triglyceride=2 and HDL=2 and LDL=3 and Uric Acid=2 and Glucose in Urine=0 then Output is 2.
Rule 4 : [0 5 4 1 3 4 2 3 2 2 2 4 2 1][3] If Gender=0 and Age=5 and Body Mass Index=4 and Genetic=1 and Insulin=3 and Fast Blood Sugar=4 and Urine=2 and Creatinine=3 and Cholesterol=2 and Triglyceride=2 and HDL=2 and LDL=4 and Uric Acid=2 and Glucose in Urine=1 then Output is 3.
Rule 5 : [1 7 3 1 3 4 2 4 2 1 2 3 2 1][3] If Gender=1 and Age=7 and Body Mass Index=3 and Genetic=1 and Insulin=3 and Fast Blood Sugar=4 and Urine=2 and Creatinine=4 and Cholesterol=2 and Triglyceride=1 and HDL=2 and LDL=3 and Uric Acid=2 and Glucose in Urine=1 then Output is 3.
Insulin=3 and Fast Blood Sugar=6 and Urine=3 and Creatinine=2 and Cholesterol=3 and Triglyceride=3 and HDL=3 and LDL=5 and Uric Acid=3 and Glucose in Urine=4 then Output is 4.
Rule 7 : [0 6 3 1 3 5 2 2 3 3 1 4 3 2][3] If Gender=0 and Age=6 and Body Mass Index=3 and Genetic=1 and
Insulin=3 and Fast Blood Sugar=5 and Urine=2 and Creatinine=2 and Cholesterol=3 and Triglyceride=3 and HDL=1 and LDL=4 and Uric Acid=3 and Glucose in Urine=2 then Output is 3.
Like Glifix dataset above rules are in different situations for trained ANFIS model. Each rule represented by a vector. It consists of input values for the system. For Diamicron dataset age parameter’s ranking ratio is 32 percent, uric acid parameter’s ranking ratio is 22 percent, FBS parameter’s ranking ratio is 16 percent, HDL parameter’s ranking ratio is 13 percent and glucose in urine parameter has 9 percent ranking ratio. These parameters are more effective than the others. Descriptions of the rules which are generated by ANFIS for Diamicron dataset are below.
between 126 and 180. The patient has glucose in her urine. For these values patient has Type 2 diabetes. According to these parameters, the generated output is 3. For the generated output the patient should start to use 60 mg Diamicron.
Rule 2 is similar with rule 1. The discrete parameters are Age, BMI and FBS. The patients age level states in over aged and BMI level states in obese. FBS level takes place between 181 and 220. With these parameters system generated the output 4 which means 120 mg Diamicron dosage.
Rule 3, the patient’s all parameters accepted in normal ranges. Patient is middle aged and his genetic is negative. Only FBS level is high. Patient has Type 2 diabetes. ANFIS generates the output 2 according to these parameters. So Patient starts to use 60 mg Diamicron.
Rule 4, patient obese and middle aged. Her genetic is positive and her urine has glucose. Creatinine and LDL levels are high. Insulin level is more than 20 and FSB level takes place between 181 and 220. Patient has Type 2 diabetes. System generates the output 3 which is equal to 90 mg Diamicron.
Rule 5, patient is over aged and overweight. Creatinine level is high. Genetic parameter is positive. Insulin level is more than 20 mcg/dl. Fast blood glucose level is high and patient’s urine has glucose. For these values patient has Type 2 diabetes. The generated output is 3 that correspond to 90 mg Diamicron.
Rule 6, urine, LDL, cholesterol, triglyceride and uric acid parameters have very high levels. The patient is over aged and his genetic parameter is positive. The patient is obese and has glucose in his urine. Insulin level is above the normal level, fast blood glucose level is very high and patient has Type 2 diabetes so generated output is 4 which corresponds 120 mg Diamicron.
Rule 7, the patient’s age is later middle age and overweight. LDL, cholesterol, triglyceride and uric acid parameters have high levels. HDL level is low, genetic is
Roc Curve of Diamicron dataset is shown in figure 3.9:
Figure 3.9: Roc curve of Diamicron dataset.
ANFIS model structure of Diamicron dataset is shown in figure 3.10. There are 14 inputs and one output.
Glucophage dataset has seen in figure 3.12. Points show actual output values and predicted output values.
Figure 3.11: ANFIS Training data Plot
Figure 3.12: ANFIS checking data Plot
For Glucophage dataset ANFIS generates 7 rules. The checking data error of Glucophage is 0.2163 and the RMSE of Glucophage dataset is 21 percent. The sensitivity rate of Glucophage is 75 percent. The correctness of these rules is 72 percent. These rules are expressed below:
Insulin=3 and Fast Blood Sugar=3 and Urine=1 and Creatinine=2 and Cholesterol=2 and Triglyceride=2 and HDL=2 and LDL=3 and Uric Acid=2 and Glucose in Urine=1 then Output is 4.
Rule 2 : [1 6 3 0 3 3 2 3 2 2 2 3 2 1][2] If Gender=1 and Age=6 and Body Mass Index=3 and Genetic=0 and Insulin=3 and Fast Blood Sugar=3 and Urine=2 and Creatinine=3 and Cholesterol=2 and Triglyceride=2 and HDL=2 and LDL=3 and Uric Acid=2 and Glucose in Urine=1 then Output is 2.
Rule 3 : [1 6 3 1 3 4 2 3 2 2 2 3 2 2][3] If Gender=1 and Age=6 and Body Mass Index=3 and Genetic=1 and Insulin=3 and Fast Blood Sugar=4 and Urine=2 and Creatinine=3 and Cholesterol=2 and Triglyceride=2 and HDL=2 and LDL=3 and Uric Acid=2 and Glucose in Urine=2 then Output is 3.
Rule 4 : [0 7 4 1 3 4 2 3 2 2 3 3 2 2][4]
If Gender=0 and Age=7 and Body Mass Index=4 and Genetic=1 and Insulin=3 and Fast Blood Sugar=4 and Urine=2 and Creatinine=3 and Cholesterol=2 and Triglyceride=2 and HDL=3 and LDL=3 and Uric Acid=2 and Glucose in Urine=2 then Output is 4.
Rule 5 : [0 6 4 1 3 4 2 3 3 2 3 3 2 2][3] If Gender=0 and Age=6 and Body Mass Index=4 and Genetic=1 and Insulin=3 and Fast Blood Sugar=4 and Urine=2 and Creatinine=3 and Cholesterol=3 and Triglyceride=2 and HDL=3 and LDL=3 and Uric Acid=2 and Glucose in Urine=2 then Output is 3.
Acid=2 and Glucose in Urine=3 then Output is 3.
Rule 7 : [1 5 3 0 3 3 2 3 3 2 3 3 2 2][1]
If Gender=1 and Age=5 and Body Mass Index=3 and Genetic=0 and Insulin=3 and Fast Blood Sugar=3 and Urine=2 and Creatinine=3 and Cholesterol=3 and Triglyceride=2 and HDL=3 and LDL=3 and Uric Acid=2 and Glucose in Urine=2 then Output is 1.
The above rules are in different situations for trained ANFIS model. Each rule is represented by a vector. It consists of input values for the system. For Glucophage dataset age parameter’s ranking ratio is 12 percent, uric acid parameter’s ranking ratio is 9 percent, BMI parameter’s ranking ratio is 8 percent, creatinine parameter’s ranking ratio is 6 percent, HDL parameter’s ranking ratio is 6 percent, LDL parameter’s ranking ratio is 6 percent and insulin parameter’s ranking ratio is 4 percent. These parameters are more effective than the others. For ANFIS gender, age, BMI, genetic, insulin, FBS, creatinine parameters are used more effective than others. Descriptions of the rules which are generated by ANFIS for Glucophage dataset are below.
to this parameter levels patient is Type 2 diabetes and output is 4 which corresponds 3400 mg Glucophage dosage.
Rule 2 is similar with rule 1. As distinct from rule 1 patient is later middle age, over weight and creatinine level is high. The generated output is 2 which equal to 1700 mg Glucophage dosage.
Rule 3 is similar with rule 2. Differences from rule 2 are the increase in FBS level and glucose in urine and genetic is positive. ANFIS generates the output 3 which equal to 2550 mg Glucophage dosage.
Rule 4, patient is over aged and obese. Genetic is positive and insulin level is more than normal range. FBS level is high. Creatinine level is high and other parameters are acceptable normal ranges. These parameters levels denote that patient has Type 2 diabetes. Generated output is 4 which corresponds 3400 mg Glucophage dosage.
Rule 5 is similar with rule 4. As distinct from rule 4 is the increase in cholesterol level. Patient is later middle age. Other parameters’ ranges are like rule 4. The generated output is 3 which equal to 2550 mg Glucophage dosage.
Rule 6, patient is middle age and overweight. Genetic is positive and insulin level is more than normal range. Creatinine and cholesterol levels are high. Patient has high level glucose in his urine and FBS level is high. According to these parameter levels, patient has Type 2 diabetes. Generated output is 3 which correspond to 2550 mg Glucophage dosage.
Rule 7, patient is middle age and overweight. Genetic is negative and insulin level is more than normal range. FBS level takes place between 126 and 180. Creatinine, LDL and cholesterol levels are high. Patient has glucose in his urine. Generated output is 1 which correspond 850 mg Glucophage dosage.
Figure 3.14: Roc curve of Glucophage dataset.
ANFIS model structure of Glucophage dataset is shown in figure 3.15. There are 14 inputs and one output.
Humilin_M dataset has seen in figure 3.17. Points show actual output values and predicted output values.
Figure 3.16: ANFIS Training data Plot
Figure 3.17: ANFIS checking data Plot
For Humilin_M dataset ANFIS generates 6 rules. The checking data error of Humilin_M is 0.1991 and the RMSE of Humilin_M dataset is 19 percent. The sensitivity rate of Humilin_M is 72 percent. The correctness of these rules is 60 percent. These rules are expressed below:
Triglyceride=2 and HDL=1 and LDL=2 and Uric Acid=2 and Glucose in Urine=1 then Output is 20.
Rule 2 : [0 5 4 1 5 2 3 2 3 1 3 3 2][14]
If Gender=0 and Age=5 and Body Mass Index=4 and Genetic=1 and Fast Blood Glucose=5 and Urine=2 and Creatinine=3 and Cholesterol=2 and Triglyceride=3 and HDL=1 and LDL=3 and Uric Acid=3 and Glucose in Urine=2 then Output is 14.
Rule 3 : [1 7 3 1 6 3 4 3 3 2 3 2 1][18]
If Gender=1 and Age=7 and Body Mass Index=3 and Genetic=1 and Fast Blood Glucose=6 and Urine=3 and Creatinine=4 and Cholesterol=3 and Triglyceride=3 and HDL=2 and LDL=3 and Uric Acid=2 and Glucose in Urine=1 then Output is 18.
Rule 4 : [0 6 3 1 5 3 4 3 3 2 3 2 2][16]
If Gender=0 and Age=7 and Body Mass Index=3 and Genetic=1 and Fast Blood Glucose=5 and Urine=3 and Creatinine=4 and Cholesterol=3 and Triglyceride=3 and HDL=2 and LDL=3 and Uric Acid=2 and Glucose in Urine=2 then Output is 16.
Rule 5 : [0 5 3 1 4 2 3 2 3 2 2 1 2][12]
If Gender=0 and Age=5 and Body Mass Index=3 and Genetic=1 and Fast Blood Glucose=4 and Urine=2 and Creatinine=3 and Cholesterol=2 and Triglyceride=3 and HDL=2 and LDL=2 and Uric Acid=1 and Glucose in Urine=2 then Output is 12.
Urine=2 then Output is 26.
The above rules are in different situations for trained ANFIS model. Each rule is represented by a vector. It consists of input values for the system. For Humilin_M dataset creatinine parameter’s ranking ratio is 78 percent, FBS parameter’s ranking ratio is 73 percent, LDL parameter’s ranking ratio is 69 percent, glucose in urine parameter’s ranking ratio is 65 percent, Age parameter’s ranking ratio is 58 percent, cholesterol parameter’s ranking ratio is 53 percent and urine parameter’s ranking ratio is 53 percent. These parameters are more effective than the others. For ANFIS gender, age, BMI, genetic, FBS, creatinine, HDL and glucose in urine parameters are used more effective than others. Descriptions of the rules which are generated by ANFIS for Humilin_M dataset are below.
Figure 3.18: Surface Plot of FBS and Age versus Output.
Rule 1, patient is overweight and later middle age. Genetic is negative, FBS level is high, HDL level is low and has glucose in her urine. Other parameters are acceptable normal ranges. For these parameters, patient has Type 2 diabetes and generated output is 20 IU Humilin_M dosage.
Rule 3, patient is over aged, overweight and has glucose in his urine. Genetic is positive and FBS level is very high. Urine, creatinine, cholesterol, triglyceride, and LDL levels are high. Patient is Type 2 diabetic and generated output is 18 IU Humilin_M dosage. Rule 4 is similar with rule 3. Differences from rule 3 are FBS level is high but not very high like rule 3, patient has further glucose in her urine and slightly younger than rule 3. Patient is Type 2 diabetic and generated output is 16 IU Humilin_M dosage.
Rule 5, patient is middle age and overweight. Genetic is positive. Creatinine, triglyceride and FBS levels are high. Other parameters’ levels are acceptable normal ranges. Patient has glucose in her urine and type 2 diabetics. The generated output is 12 IU Humilin_M dosage.
Rule 6, patient is very old and obese. Genetic is positive and FBS level is very high. Patient has glucose in his urine. Creatinine, urine and triglyceride levels are high. Other parameters’ levels are acceptable in normal ranges. Patient is Type 2 diabetic and generated output is 26 IU Humilin_M dosage.
Roc curve of Humilin_M dataset is shown in figure 3.19.
Figure 3.20: Anfis model structure of Humilin_M dataset.
Another dataset is Novorapid which results I will introduce. 120 data used for training and 59 data used for checking from Novorapid dataset. Training and checking data distribution are shown in figure 3.21 and 3.22. The performance of ANFIS for Novorapid dataset has seen in figure 3.22. Points show actual output values and predicted output values.
Figure 3.22: ANFIS checking data Plot.
For Novorapid dataset ANFIS generates 8 rules. The checking data error of Novorapid is 0.1812 and the RMSE of Novorapid dataset is 18 percent. The sensitivity rate of Novorapid is 73 percent. The correctness of these rules is 84 percent. These rules are expressed below:
Rule 1 : [0 2 1 0 1 0 7 1 2 2 2 1 2 1 0][8]
If Gender=0 and Age=2 and Body Mass Index=1 and Genetic=0 and Insulin=1 and C_peptide=0 and Fast Blood Sugar=7 and Urine=1 and Creatinine=2 and Triglyceride=2 and HDL=2 and Uric Acid=1 and Glucose in Urine=2 and Acetone=1 and DM=0 then Output=8.
Rule 2 : [0 1 1 0 1 0 7 1 1 1 2 1 4 1 0][18]
If Gender=0 and Age=1 and Body Mass Index=1 and Genetic=0 and Insulin=1 and C_peptide=0 and Fast Blood Sugar=7 and Urine=1 and Creatinine=1 and Triglyceride=1 and HDL=2 and Uric Acid=1 and Glucose in Urine=4 and Acetone=1 and DM=0 then Output=18.
Glucose in Urine=2 and Acetone=1 and DM=0 then Output=16. Rule 4 : [1 2 1 0 1 0 6 1 1 1 1 1 2 1 0][12]
If Gender=1 and Age=2 and Body Mass Index=1 and Genetic=0 and Insulin=1 and C_peptide=0 and Fast Blood Sugar=6 and Urine=1 and Creatinine=1 and Triglyceride=1 and HDL=1 and Uric Acid=1 and Glucose in Urine=2 and Acetone=1 and DM=0 then Output=12.
Rule 5 : [1 2 1 0 1 0 7 1 2 1 2 1 4 1 0][14]
If Gender=1 and Age=2 and Body Mass Index=1 and Genetic=0 and Insulin=1 and C_peptide=0 and Fast Blood Sugar=7 and Urine=1 and Creatinine=2 and Triglyceride=1 and HDL=2 and Uric Acid=1 and Glucose in Urine=4 and Acetone=1 and DM=0 then Output=14.
Rule 6 : [1 4 3 0 3 1 6 1 2 2 2 1 4 0 1][10]
If Gender=1 and Age=4 and Body Mass Index=3 and Genetic=0 and Insulin=3 and C_peptide=1 and Fast Blood Sugar=6 and Urine=1 and Creatinine=2 and Triglyceride=2 and HDL=2 and Uric Acid=1 and Glucose in Urine=4 and Acetone=0 and DM=1 then Output=10.
Rule 7 : [0 2 2 0 1 0 8 1 1 1 2 2 4 1 0][16]
If Gender=0 and Age=2 and Body Mass Index=2 and Genetic=0 and Insulin=1 and C_peptide=0 and Fast Blood Sugar=8 and Urine=1 and Creatinine=1 and Triglyceride=1 and HDL=2 and Uric Acid=2 and Glucose in Urine=4 and Acetone=1 and DM=0 then Output=16.
Rule 8 : [0 1 1 0 1 0 8 1 1 2 2 2 4 1 0][18]
The above rules are in different situations for trained ANFIS model. Each rule is represented by a vector. It consists of input values for the system. For Novorapid dataset gender parameter’s ranking ratio is 40 percent, glucose in urine parameter’s ranking ratio is 31 percent, Acetone parameter’s ranking ratio is 30 percent, creatinine parameter’s ranking ratio is 11 percent, triglyceride parameter’s ranking ratio is 7 percent, age parameter’s ranking ratio is 5 percent and HDL, genetic and BMI parameters’ ranking ratio is 4 percent. These parameters are more effective than the others. For ANFIS gender, age, BMI, genetic, c_peptide, FBS, urine, uric acid, acetone and diabetes type are used more effective than others. Descriptions of the rules which are generated by ANFIS for Novorapid dataset are below.
Figure 3.23: Surface Plot of FBS and Age versus Output.
Rule 1, patient is underweight whose age is between 8-14 years old. Genetic and C_peptide are negative and insulin level is under normal range. Patient has acetone and glucose in her urine. FBS level is very high and other parameters’ levels are acceptable normal ranges. Patient is a Type 1 diabetic. According to these parameter levels ANFIS generates the output 8 IU Novorapid dosages.
Rule 3, patient is underweight whose age is between 0-7 years old. Genetic and C_peptide are negative. Patient has glucose and acetone in his urine. Triglyceride level is low. FBS level is between 401 and 500 mg/dl and other parameters’ levels are acceptable in normal ranges. Patient is Type 1 diabetic and generated output is 16 IU Novorapid dosage.
Rule 4, patient is underweight whose age is between 8-14 years old. Genetic and C_peptide are negative and insulin level is under normal range. Patient has acetone and glucose in her urine. Triglyceride level is low. FBS level takes place between 301-400 mg/dl. Patient is Type 1 diabetic and generated output is 12 IU Novorapid dosage. Rule 5 is similar with rule 4. Differences with rule 4 are FBS, creatinine, HDL glucose in urine parameters’ levels higher than rule 4. Triglyceride level is low. The other parameters’ levels are in the same ranges with rule 4. The generated output is 14 IU Novorapid dosage.
Rule 6, patient is overweight whose age is between 26-35 years old. Genetic is negative and c_peptide is positive. Insulin level is more than normal range. The patient’s urine has glucose but do not have acetone. FBS level is between 301 and 400. Other parameters’ levels are acceptable normal ranges. Patient is Type 2 diabetic and the generated output is 10 IU Novorapid dosage.
Rule 7, patient is normal weight whose age is between 8-14 years old. Genetic and c_peptide are negative. Insulin level is under normal range. Patient’s urine have glucose and acetone. Triglyceride level is low and FBS level is between 501 and 600. The patient is Type 1 diabetic and generated output is 16 IU Novorapid dosage.
Rule 8 is similar with rule 7. Differences with rule 7 are patient’s age is younger and underweight. Other parameters’ levels are the same ranges with rule 7. The generated output is 18 IU Novorapid dosage.
Figure 3.24: Roc curve of Novorapid dataset.
ANFIS model structure of Novorapid dataset is shown in figure 3.25. There are 15 inputs and 1 output.
Figure 3.25: Anfis model structure of Novorapid dataset.
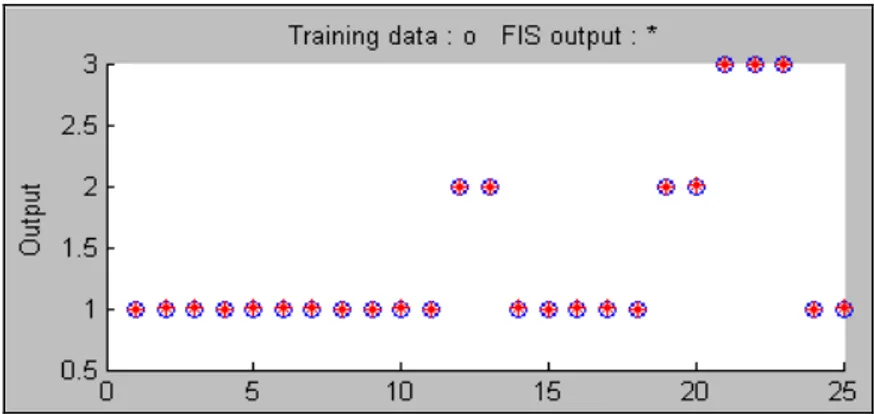
The other dataset is Insulin Lantus which results I will introduce. 125 data used for training and 62 data used for checking from Glifix dataset. Training and checking data
Figure 3.26: ANFIS Training data Plot.
Figure 3.27: ANFIS checking data Plot.
For Insulin Lantus dataset ANFIS generates 7 rules. The checking data error of Insulin Lantus is 0.1859 and the RMSE of Novorapid dataset is 18 percent. The sensitivity rate of Insulin Lantus is 74 percent. The correctness of these rules is 80 percent. These rules are expressed below:
Rule 1 : [0 4 3 1 3 1 6 2 2 3 2 1 1 2 0 1][24]
Rule 2 : [1 1 1 0 1 0 7 1 2 1 2 1 1 2 1 0][18]
If Gender=1 and Age=1 and Body Mass Index=1 and Genetic=0 and Insulin=1 and C_peptide=0 and Fast Blood Sugar=7 and Creatinine=1 and Cholesterol=2 and Triglyceride=1 and HDL=2 and LDL=1 and Uric Acid=1 and Glucose in Urine=2 and Acetone=1 and DM=0 then Output=18.
Rule 3 : [0 1 1 0 1 0 6 1 2 1 1 1 1 4 1 0][22]
If Gender=0 and Age=1 and Body Mass Index=1 and Genetic=0 and Insulin=1 and C_peptide=0 and Fast Blood Sugar=6 and Creatinine=1 and Cholesterol=2 and Triglyceride=1 and HDL=1 and LDL=1 and Uric Acid=1 and Glucose in Urine=4 and Acetone=1 and DM=0 then Output=22.
Rule 4 : [0 1 1 0 1 0 7 1 1 1 2 1 1 4 1 0][16]
If Gender=0 and Age=1 and Body Mass Index=1 and Genetic=0 and Insulin=1 and C_peptide=0 and Fast Blood Sugar=7 and Creatinine=1 and Cholesterol=1 and Triglyceride=1 and HDL=2 and LDL=1 and Uric Acid=1 and Glucose in Urine=4 and Acetone=1 and DM=0 then Output=16.
Rule 5 : [1 2 1 0 1 0 8 1 1 1 2 1 1 4 1 0][10]
If Gender=1 and Age=2 and Body Mass Index=1 and Genetic=0 and Insulin=1 and C_peptide=0 and Fast Blood Sugar=8 and Creatinine=1 and Cholesterol=1 and Triglyceride=1 and HDL=2 and LDL=1 and Uric Acid=1 and Glucose in Urine=4 and Acetone=1 and DM=0 then Output=10.
and Cholesterol=1 and Triglyceride=1 and HDL=2 and LDL=1 and Uric Acid=1 and Glucose in Urine=4 and Acetone=1 and DM=0 then Output=20.
Rule 7 : [0 3 2 0 1 0 7 1 1 1 2 1 1 2 1 0][12]
If Gender=0 and Age=3 and Body Mass Index=2 and Genetic=0 and Insulin=1 and C_peptide=0 and Fast Blood Sugar=7 and Creatinine=1 and Cholesterol=1 and Triglyceride=1 and HDL=2 and LDL=1 and Uric Acid=1 and Glucose in Urine=2 and Acetone=1 and DM=0 then Output=12.
The above rules are in different situations for trained ANFIS model. Each rule is represented by a vector. It consists of input values for the system. For Insulin Lantus dataset FBS parameter’s ranking ratio is 32 percent, glucose in urine and BMI parameters’ ranking ratio are 24 percent, age parameter’s ranking ratio is 23 percent, creatinine parameter’s ranking ratio is 20 percent, acetone, c_peptide, diabetes type, insulin and triglyceride parameters’ ranking ratio are 14 percent. These parameters are more effective than the others. For ANFIS gender, age, BMI, genetic, c_peptide, FBS, LDL, uric acid, acetone and diabetes type are used more effective than others. Descriptions of the rules which are generated by ANFIS for Insulin Lantus dataset are below.