THE REPUBLIC OF TURKEY
BAHÇEŞEHİR UNIVERSITY
EFFECTS OF CORPORATE SOCIAL
RESPONSIBILITY ON CONSUMER LOYALTY
IN THE TELECOMMUNICATION SECTOR
Master’s Thesis
NURİYE YILMAZ
THE REPUBLIC OF TURKEY BAHÇEŞEHİR UNIVERSITY
GRADUATE SCHOOL OF SOCIAL SCIENCES
MARKETING GRADUATE PROGRAM
EFFECTS OF CORPORATE SOCIAL
RESPONSIBILITY ON CONSUMER LOYALTY IN
THE TELECOMMUNICATION SECTOR
Master’s Thesis
NURİYE YILMAZ
Thesis Supervisor: PROF. DR. SELİME SEZGİN
Co-Supervisor: ASSOC. PROF. DR. ELİF KARAOSMANOĞLU
ACKNOWLEDGEMENT
It is with immense gratitude that I acknowledge the support and help of my Prof. Dr. Selime Sezgin, a gracious mentor who demonstrates that academicians have a responsibility to help create a better world; this thesis would not be possible without her constructive criticism, true leadership and ever enlightening guidance.
I also want to thank to my co-supervisor Assoc. Prof. Dr. Elif Karaosmanoğlu for her wisdom, who has encouraged and inspired me with her professional idealism while being the living example for true hope, thank you for supporting my my further graduate studies whole heartedly.
It is a pleasure to pay tribute to my manager, Şebnem Mengen Turgal for her insisting support since the beginning of this program, making it possible to endure by helping me all along the way and leading me in my career journey but most important of all, for her true friendship.
I owe the deepest gratitude to my mother and father for their endless efforts to raise me as an independent individual with decent values who has made me a responsible and reputable person and to my dear younger brother for being there whenever I need.
This study is dedicated to my loving, supportive, encouraging, and patient husband who has helped me with all the decisions I made in my life spreading a flame all over the world with his love and enthusiasm.
Thank you all so much.
iv
ABSTRACT
EFFECTS OF CORPORATE SOCIAL RESPONSIBILITY ON CONSUMER LOYALTY IN THE TELECOMMUNICATION SECTOR
Nuriye Yılmaz
Marketing Management Graduate Program Thesis Supervisor: Prof. Dr. Selime Sezgin Co- Supervisor: Assoc. Prof. Dr. Elif Karaosmanoğlu
May 2012, 53 Pages
The perceived importance of corporate environmental, social, and governance programs has been increased in the last 30 years. Before, the corporations’ main responsibility was to make maximum financial gain to its stakeholders. Today, after globalization and technological developments, it has become an important responsibility for the corporations to consider social responsibility projects. Many researches have been conducted to understand the effects of CSR activities on company’s key performance indicators and some have shown that customers are giving importance to corporations’ social and moral ethics.
The aim of this thesis is to examine the relationship between customer loyalty and corporate social responsibility in telecommunication sector in Turkey. In this study, CSR and customer loyalty relationship have been analysed in detail. A research has also been conducted in order to determine the relationship. The study has been designed quantitative in nature using the responses of 300 telecom customers who answered an online survey questionnaire. It is seen that CSR play an influential role in customer loyalty as a result of the survey.
Key Words: Corporate Social Responsibility, Customer Loyalty, Perceived Service
v
ÖZET
TELEKOMMÜNİKASYON SEKTÖRÜNDE SOSYAL SORUMLULUK PROJELERİNİN MÜŞTERİ BAĞLILIĞINA ETKİSİ
Nuriye Yılmaz
Pazarlama Yönetimi Yüksek Lisans Programı Tez Danışmanı: Prof. Dr. Selime Sezgin
Yardımcı Danışman: Assoc. Prof. Dr. Elif Karaosmanoğlu Mayıs 2012, 53 Sayfa
Kurumların çevre, sosyal ve yönetim programlarına verdikleri önem son otuz yılda artış göstermiştir. Öncesinde, kurumların ana sorumluluğu iş ortaklarına en üst düzeyde finansal kar sağlamaktı. Bugün, globalleşme ve teknolojik gelişmeler sonrasında, sosyal sorumluluk projelerine önem verilmesi kurumlar için önemli bir rol haline geldi. Sosyal Sorumluluk projelerinin kurumların temel performans göstergeleri üzerindeki etkilerini anlamak adına birçok araştırma yapılmış ve bu araştırmaların bir kısmı müşterilerin kurumların sosyal ve ahlaki değerlerine önem verdiklerini göstermiştir.
Bu tezin amacı Türkiye’de telekommünikasyon sektöründe yapılan sosyal sorumluluk projelerinin müşteri bağlılığı üzerindeki ilişkisini anlamaktır. Bu çalışmada kurumsal sosyal sorumluluk ve müşteri bağlılığı ilişkisi detaylı incelenmiştir. Bu ilişkiyi anlamak için araştırma yapılmıştır. Çalışma doğası gereği kantitatif olarak planlanmış ve 300 telekom müşterisi üzerinde online anket çalışması yapılmıştır. Çalışma sonucu sosyal sorumluluk projelerinin müşteri bağlılığı üzerinde etkili olduğu gözlemlenmiştir.
Anahtar Kelimeler: Sosyal Sorumluluk Projesi, Müşteri Bağlılığı, Algılanan Servis
vi
TABLE OF CONTENTS
LIST OF TABLES ... viii
LIST OF FIGURES ... ix
ABBREVIATIONS ... x
1. INTRODUCTION ... 1
2. CORPORATE SOCIAL RESPONSIBILITY (CSR) ... 4
2.1 DEFINITIONOFCSR ... 4
2.1.1 Economic Responsibilities ... 6
2.1.2 Legal Responsibilities ... 7
2.1.3 Ethical Responsibilities ... 7
2.1.4 Philanthropic Responsibilities ... 8
2.2 THEMEANINGOFCSRFORMARKETINGMANAGEMENT ... 9
3. IMPLICATIONS OF CSR FOR CUSTOMER LOYALTY AND PERCEIVED SERVICE QUALITY ... 14
3.1 DEFINITIONOFCUSTOMERLOYALTY ... 14
3.1 ATTITUDINALLOYALTY ... 15
3.2 BEHAVIORALLOYALTY ... 16
3.3 PERCEIVEDSERVICEQUALITY(PSQ) ... 18
3.4 CONCLUSIONOFTHELITERATURESURVEY ... 21
4. RESEARCH DESIGN AND METHODOLOGY ... 24
4.1 AIMANDSCOPEOFTHESTUDY ... 24
4.2 SURVEYSAMPLINGANDSURVEYDESIGN ... 26
4.2.1 Perceived Service Quality ... 27
4.2.2 Corporate social responsibility (CSR) ... 27
4.2.3 Attitudinal Loyalty ... 28
4.2.4 Repeat Patronage Intention ... 29
4.3 ANALYSISANDDISCUSSION ... 30
5. CONCLUSION, LIMITATIONS & FUTURE RESEARCH ... 40
vii
5.2 LIMITATIONSANDRECOMMENDATIONFORFUTURE
RESEARCH..……….45
REFERENCES ... 47
APPENDICES ... 51
Appendix 1: The original questionnaire (part 1) ... 52
viii
LIST OF TABLES
Table 4.1: Perceived service quality questions ... 27
Table 4.2: Corporate social responsibility (CSR) questions ... 28
Table 4.3: Attitudinal loyalty questions ... 29
Table 4.4: Repeat patronage intention question ... 29
Table 4.5: Factor loadings ... 32
Table 4.6: Correlation results ... 34
Table 4.7: Regression analysis results of loyalty ... 35
Table 4.8: Regression analysis results of CR and responsiveness ... 36
Table 4.9: Regression analysis results of CSR and assurance ... 36
Table 4.10: Regression analysis results of CSR and tangible ... 36
Table 4.11: Regression analysis results of CSR and reliability ... 37
Table 4.12: Results of CSR project vs GSM operator match ... 38
Table 4.13: Summary of revised model’s hypothesis testing ... 38
Table 5.1: Regression analysis results of responsiveness and assurance, tangible and reliability ... 41
Table 5.2: Regression analysis results of tangible and assurance, responsiveness and reliability ... 42
ix
LIST OF FIGURES
Figure 2.1: The pyramid of corporate social responsibility ... 6
Figure 3.1: Conceptualizations advanced in the literature ... 20
Figure 3.2: Proposed conceptual model ... 23
Figure 4.1: Total subscriber numbers in terms of operators (million) ... 24
Figure 4.2: The market shares of the mobile operators based on subscriber numbers (per cent) ... 25
Figure 4.3: The market shares of the mobile operators based on revenue ... 25
Figure 4.4: Proposed conceptual model ... 26
x
ABBREVIATIONS
AMA: American Marketing Association (AMA) CPSC: Consumer Product Safety Commission CSR: Corporate Social Responsibility
EEOC: Equal Employment Opportunity Commission EPA: Environmental Protection Agency
GSM: Global System for Mobile Communication
ICTA: Information and Communication Technologies Association OSHA: Occupational Safety and Health Administration
PSQ: Perceived Service Quality TSI: Turkish Staistical Institute
1. INTRODUCTION
In the last 30 years, corporate executives started to discuss about the firm’s responsibility to the society. At the beginning it was argued that corporations’ main responsibility is to provide a maximum financial gain to its stakeholders. However, in a short time, this financial return needed to be taken under the control of laws and regulations of the land that the company operates. Besides, some international laws and regulations are also settled especially for the companies operating overseas.
Corporate responsibility awareness did not achieve the required attention until early 1970’s even though various social activists groups and others tried hard to be heard throughout 1960’s. Only after the establishment of Environmental Protection Agency (EPA), the Equal Employment Opportunity Commission (EEOC), the Occupational Safety and Health Administration (OSHA), and the Consumer Product Safety Commission (CPSC), it became possible to publish the official public policy which clearly recognized the environment, employees and consumers to be significant and legitimate stakeholders who possesses and should uphold this policy. Since then, it became part of the corporate executives’ standard responsibility to work out maintaining the balance of; commitments to corporation’s owners and to a huge group of stakeholders who claim both legal and ethical rights.
The perceived importance of corporate environmental, social, and governance programs has increased in recent years. As a result of this awareness, corporate social responsibility (CSR) has become a crucial element of today’s company. Executives, investors, and regulators have grown increasingly aware that such programs can mitigate corporate crises and build reputations. The discussion has become a main part of business strategies to cope with growing environmental challenges. With the emergence of financial crises, the discussion on the corporate social responsibility has increased. Many of these debates refer to the role that CSR plays in the society and
2
reasons for a company to involve in supporting social causes in times of crisis (Grigore 2011).
Customer loyalty has been recognized over several decades for its role in the creation of many successful businesses (e.g. Chaudhuri and Holbrook 2001, Day 1969, Dick and Basu 1994, Jacoby and Kyner 1973, Kotler and Armstrong 2008, Lewis and Soureli 2006, Oliver 1999, Reichheld 1996, del Mar Garcia de los Salmones et al. 2005) (Mandhachirata and Poolthong 2011). Although customer loyalty is a commonly acknowledged concept, its operationalization varies. Three main approaches are broadly accepted as measures of customer loyalty, i.e. attitudinal, behavioral and combinational loyalty measures (Mandhachirata and Poolthong 2011).
The construct named service quality, which reflects the core performance of a business, is often cited as a key determinant of loyalty, either directly or indirectly, via other constructs, or together (Cronin and Taylor 1992, Jones and Sasser 1995, Parasuraman et al. 1991, Reichheld and Sasser 1990) (Mandhachirata and Poolthong 2011). Fairly recently the construct corporate social responsibility (CSR), has been used in studies incorporating the customer loyalty model (Mandhachirata and Poolthong 2011).
Is there something inherent in CSR that might lead to benefits such as increase in perceived service quality, higher reputation, and improved customer loyalty? The literature suggests that there is. Customers develop either positive or negative perceptions of firms through their evaluation of the fairness they demonstrate through product use and service interactions, for example, Fornell et al. (1996) (Galbreath 2010). CSR is expected to demonstrate equity or fairness towards customers, leading to higher satisfaction.
This thesis will explore the relationship between corporate social responsibility projects and customer loyalty in the telecommunication sector in Turkey. The intention is to understand whether there is a positive relationship between them. Telecom companies are spending huge amounts of money to the projects like the other firms in the other sectors. Although the reason seems to be acting in a socially responsible manner in
3
moral context, the underlying reasons are the long term sustainability and profit by establishing a strong relationship between the company and the customers. As long as they make their customers loyal, long term commitments will be achieved.
4
2. CORPORATE SOCIAL RESPONSIBILITY (CSR)
2.1 DEFINITION OF CSR
In 2004, the American Marketing Association revised the official definition of marketing which had been stable since 1985:
Marketing is an organizational function and a set of processes for creating, communicating, and delivering value to customers and for managing customer relationships in ways that benefit the organization and its stakeholders (Grigore 2011).
It was the first time when a marketing definition included stakeholders, and it appeared to position the concept of stakeholder marketing as central to the field’s thinking (Grigore 2011).
Three years later a new definition of marketing is proposed by American Marketing Association (AMA) (2007):
Marketing is the activity, set of institutions, and processes for creating, communicating, delivering, and exchanging offerings that have value for customers, clients, partners, and society at large (Grigore 2011).
Most important point in this new definition was that marketing is no longer regarded as a function, but rather is seen as an activity of a company. What is also captivating about this new definition is that stakeholders of a company are regarded as partners, meaning that company and stakeholders are engaged in a win–win situation that will benefit both parties. This strongly contrasts the narrowly profit-oriented perspective and aims to balance the power of participants in a business (Grigore 2011).
It is possible to describe CSR in a holistic manner as “good citizenship,” or being a “good” company that is supportive of its shareholders as well as society as a whole. CSR covers a broad spectrum of a company’s activities, including human resource
5
management, company policies and shortly every single behavior of a firm reflected to the society. Because the CSR concept is a very abstract concept, it is sometimes very difficult to be understood by the society. Focusing on specific social issues is often desirable for effective communication, and enhances the public’s receptiveness to a firm’s public relations efforts. A company might need to explain what they stand for, how corporate responsibility is carried out, and how people benefit from such actions. Thus, a common vehicle to communicate the CSR effort of a firm is the financial or nonfinancial support of a specific cause (Sheikh and Beise-Zee 2011).
While there is no universally accepted definition (Silberhorn and Warren 2007, Weber 2008), CSR generally refers to a firm’s activities, organizational processes, and status in relation to its perceived societal or stakeholder obligations (Davis, 1973; Wartick and Cochran 1985, Wood 1991, Sen and Bhattacharya 2001) (Galbreath 2010). Much has been written on what constitutes CSR and although many viewpoints exist, Carroll’s (1979) conceptualization of the responsibilities of firms has remained a consistently accepted approach, particularly with respect to empirical study.
Carroll (1979, 1991) delineated the CSR construct by stating “the social responsibility of business encompasses the economic, legal, ethical, and discretionary (philanthropic) expectations that society has of organizations.” This definition has become fairly widely accepted (Mohr et al. 2001; del Mar Garcia de los Salmones et al. 2005) and emphasizes four principle types of responsibilities; economic, legal, ethical and philanthropic (Matten and Crane 2005) (Mandhachirata and Poolthong 2011). Carroll’s (1991) “The Pyramid of Corporate Social Responsibility” is shown in Figure 2.1 below.
6
Figure 2.1: The pyramid of corporate social responsibility
Source: Carroll, A.B, The Pyramid of Corporate Social Responsibility: Toward the Moral Management
of Organizational Stakeholders, July-August 1991
2.1.1 Economic Responsibilities
In the past, the aim of the business organizations was to provide goods and services to societal members. The major incentive for the entrepreneurs was to make profit. These organizations were the basic economic unit in the society. Because of this, the principal role of these organizations was to produce goods and services that consumers needed
7
and wanted and to make an acceptable profit in the process. However, in time, the idea of making profit transformed into making maximum profit from the operations and this became the major aim of the entrepreneurs. All other business responsibilities are predicated upon the economic responsibility of the firm, because without it the others become moot considerations (Carroll 1991).
According to Carroll (1991); some important statements characterizing economic responsibilities can be summarized as: performing consistently to maximize earning per share, being as profitable as possible, maintaining strong competitive position and a high level of operating efficiency and being consistently profitable.
2.1.2 Legal Responsibilities
Society’s expectation from the business organizations ıs not only to operate with the profit motive but also performing businesses appropriately as shown in regulations and laws settled by local and international bodies. As a partial fulfillment of the "social contract" between business and society, firms are expected to pursue their economic missions within the framework of the law (Carroll 1991). Legal responsibilities reflect a view of "codified ethics" in the sense that they embody basic notions of fair operations as established by the lawmakers (Carroll 1991).
As the second layer in the pyramid, legal responsibilities consist of five main components which are; performing in a manner consistent with expectations of government and law, complying with various federal, state and local regulations, being a law-abiding corporate citizen, providing goods and services that at least meet minimal legal requirements and fulfilling legal obligations to be defined as a successful firm.
2.1.3 Ethical Responsibilities
Economic and legal responsibilities mark out norms about fairness and justice which are codified by law. On the other hand, ethical responsibilities indicate the activities and
8
practices that are expected or prohibited by societal members. They are not shaped by the laws and regulations. Ethical responsibilities embody those standards, norms, or expectations that reflect a concern for what consumers, employees, shareholders, and the community regard as fair, just, or in keeping with the respect or protection of stakeholders' moral rights (Carroll 1991). The business ethics movement of the past decade has firmly established an ethical responsibility as a legitimate CSR component (Carroll 1991). Therefore, it has become the third layer in the pyramid.
The components of the third layer can be summarized as: performing in a manner consistent with expectations of societal mores and ethical norms, recognizing and respecting new or evolving ethical/moral norms adopted by society, preventing ethical norms from being compromised in order to achieve corporate goals, recognizing corporate integrity and ethical behavior go beyond mere compliance with laws and regulations and being good corporate citizenship as doing what is expected morally or ethically.
2.1.4 Philanthropic Responsibilities
In order to be a good corporate citizen, businesses should take some actions that society expects which are called philanthropy. This includes actively engaging in acts or programs to promote human welfare or goodwill (Carroll 1991). Examples of philanthropy include business contributions of financial resources or executive time, such as contributions to the arts, education, or the community (Carroll 1991). The distinguishing feature between philanthropic and ethical responsibilities is that the former are not expected in an ethical or moral sense (Carroll 1991). Communities desire firms to contribute their money, facilities, and employee time to humanitarian programs or purposes, but they do not regard the firms as unethical if they do not provide the desired level (Carroll 1991). Therefore, philanthropy is more discretionary or voluntary on the part of businesses even though there is always the societal expectation that businesses provide it (Carroll 1991).
9
The fourth layer in the pyramid mainly consists of; performing in a manner consistent with the philanthropic and charitable expectations of society, assisting the fine and performing arts, participation of managers and employees in voluntary and charitable activities within their local communities, providing assistance to private and public educational institutions and assisting voluntarily those projects that enhance a community's "quality of life" (Carroll 1991).
Mohr et al. (2001) divided CSR into two general classifications. The first category discusses CSR in relation to the various stakeholders of the organization (e.g. owners, customers, employees, and the community). The second classification is based on Kotler’s (2008) societal marketing concept. These two definitions emphasize that a socially responsible company should have concerns beyond short-term profitability. Taking stakeholder theory into account, Maignan et al. (1999) defined social responsibility as the degree to which firms assume economic, legal, ethical and discretionary responsibilities towards their stakeholders (Mandhachirata and Poolthong 2011).
2.2 THE MEANING OF CSR FOR MARKETING MANAGEMENT
The purpose of ‘‘corporate social responsibility practices’’ will be different for each ‘‘individual’’ in the organization (Gao et al. 2002). From an employee’s point of view, CSR can be conceived as an investment (the time and effort to learn) in the social activity, while ‘‘CSR’’ will be driven by institutional objectives (e.g. survival and growth) from the point of view of the management (Waldman 2007). Aguilera et al. (2007) suggest that CSR meets the justice needs of employees thereby leading to lower turnover rates.
According to many researches, today, the companies who give importance to ethics and CSR voluntarily and sincerely are the most desired ones by the employees. When there is employee satisfaction, it is irresistible that the company wins in the long run since the productivity and efficiency will increase. From the point of view of corporate culture, the implementation of CSR initiatives fosters important changes in an organization
10
(McAdam et al. 1996). The changes include structure and responsibility, training and awareness, communication, documentation and control and emergency preparedness (Chin et al. 1999). Corporate culture includes elements such as core values and beliefs, corporate ethics, and rules of behavior (Deal and Kennedy 1982). In other words, the integration of CSR issues is helping companies reassess their corporate cultures as a contribution to share responsibilities (McAdam et al. 1996) (Cegarra-Navarro and Martı´nez-Martı´nez, 2009).
On the other hand, in such a globalized world, a single person has many different roles i.e. employee, customer, parent, friend, student etc. As part of being a customer, he or she also cares about the ethics and the social responsibilities of the company. The quality of the product itself is not enough since customers are rating the companies as a whole, therefore the company’s attitude towards social issues or ethics has immense effects on their individual and social judgment. Any damage on company reputation may highly affect the shopping behavior since there is a huge market where finding a substitute for most of the products or services are possible. If different stakeholders understand the goals that shape their corporate social responsibility practices, it becomes possible to see what creates the events and crisis they observe. This awareness allows them to change the source of the problem rather than just dealing with symptoms (Ackoff 1974) (Cegarra-Navarro and Martı´nez-Martı´nez 2009).
Whether CSR activities are effective in influencing a company’s financial performance remains uncertain. Stanwick and Stanwick (1998) reviewed the studies that examine the effects of CSR on financial performance and concluded that there is a weak but positive relationship. Similarly, Pava and Krausz (1997) found that 12 of 21 studies showed positive associations between CSR activities and indices of financial performance. It seems that consumers exercise their voice through practices, such as a willingness to pay more for certain goods and services (Smith, 1990), or consumer boycotts (Kozinets and Handelman 2004) (Cegarra-Navarro and Martınez-Martınez 2009).
As stated in Gummenson’s article; “there are three behaviors related with the ethics and social responsibility”. First one can be summarized as do whatever you want and then
11
hire many lawyers if needed at court. The second one uses the image of “good” as an opportunity for public relations activity. And the remaining one is to treat it as an integral part of the corporate values (Gummesson 2006).
The effective development and implementation of CSR initiatives is inevitably associated with ethical and moral aspects (Harrison 2003). Donaldson and Dunfee (1999) discuss how stakeholders can demand ethical obligations on companies via voice, consent, and exit. As noted above, research on brand image shows that, given the choice, some consumers will pay more for a product from a ‘‘good’’ company than from a ‘‘bad’’ company (Sen et al. 2001). Therefore, the implementation of a CSR initiative should develop, establish and maintain procedures for improving the organizational ethical impacts that may be associated with the society’s collective good. For example, companies may implement CSR initiatives that use less hazardous materials, resulting in less hazardous waste needing to be buried, which in turn may result in less soil and ground water pollution (Kuhre 1995) (Cegarra-Navarro and Martı´nez-Martı´nez 2009).
Similarly, customers develop either positive or negative perceptions of firms through their evaluation of the fairness they demonstrate through product use and service interactions, for example, Fornell et al. (1996). CSR is expected to demonstrate equity or fairness towards customers, leading to higher satisfaction. Lastly, reputation is a general attribute of firms and reflects the extent to which a firm is perceived as good or bad (Roberts and Dowling 2002). CSR is expected to signal to stakeholders a positive ideal of corporate behavior, thereby increasing reputation (Galbreath 2010).
International actions such as the United Nations Global Compact (substantive human rights standards) or the Global Reporting Initiative (social, economic, and environmental disclosure format) are important factors; influencing companies to implement CSR initiatives and so become agents of social change (Aguilera et al., 2007). Under this framework, a CSR program may become the primary requirement for doing business globally ‘‘BG’’. As Kagan et al. (2003) argue, multinational companies, particularly the high-profile ones, are expected to be pioneers in adopting CSR
12
initiatives to reach social expectations, which in turn reinforce other factors, such as consumers, and institutional investors (Cegarra-Navarro and Martı´nez-Martı´nez 2009).
It is crucial for today’s organizations to be able to manufacture and deliver quality products and services cost-effectively. In this regard, managers may have some instrumental motives to push for CSR when social initiatives are directly related to the greater competitiveness of the firm, such as by protecting a company’s reputation (Bansal and Clelland 2004). For example, managers might have instrumental motives for persuading the company to engage in CSR efforts when those efforts are compatible with long-term employee welfare or investing in research and development of high-quality products (Hall and Soskice 2001). Given that this inversion in research and development could lead to a number of business advantages such as better quality (McWilliams and Siegel 2000) (Cegarra-Navarro and Martı´nez-Martı´nez 2009). Innovativeness represents a firm’s ability to ‘‘differentiate itself from competitors’’ in terms of developing new products and services (Xueming and Bhattacharya 2006). CSR activities often create tremendous value when they cater to very basic humanitarian needs; for example, starting from the consideration that ‘‘green’’ issues may represent a significant driver of product differentiation, the introduction and/or greater attention towards the implementation of design for recycling, design for dismantling and design for disassembling techniques, allow the product manager to identify the best trade-off between a product’s eco-compatibility and its contribution to profitability. Consequently, executives encourage innovation by considering CSR initiatives as environmentally friendly design techniques in the development of new products and services (e.g. Azzone and Noci, 1998) (Cegarra-Navarro and Martı´nez-Martı´nez 2009).
Several marketing studies have reported that CSR behaviors can positively affect consumer attitudes towards the firm and its offerings (Bhattacharya and Sen 2003, Folks and Kamins 1999, Lichtenstein et al. 2004, Luo and Bhattacharya 2006, McWilliams and Siegel 2001, Mohr et al. 2001). CSR is reported to affect, either directly or
13
indirectly, consumer responses (Berens et al. 2005, 2007). Del Mar Garcia de los Salmones et al. (2005) reported a positive relationship between CSR and overall evaluation of service quality (Mandhachirata and Poolthong 2011).
14
3. IMPLICATIONS OF CSR FOR CUSTOMER LOYALTY AND PERCEIVED SERVICE QUALITY
3.1 DEFINITION OF CUSTOMER LOYALTY
As customer loyalty is considered a vital objective for a firm’s survival and growth, building a loyal customer base has not only become a major marketing goal (Kotler and Armstrong 2008), but it is also an important basis for developing a sustainable competitive advantage (Dick and Basu 1994) (Mandhachirata and Poolthong 2011). Customer loyalty is defined as the relationship of relative attitudes on object (brand, service, and dealer) and repeat patronage (Onlaor and Rotchanakitumnuai 2010). The concept of customer loyalty is understood as the combination of favorable attitudes that leads to repurchase intentions and recommend good or service to others, including willingness to pay more. It is widely accepted that customer satisfaction is an antecedent of customer loyalty which in turn have influence on profitability (Onlaor and Rotchanakitumnuai 2010).
Jacoby and Chestnut (1978, p. 1) posited that “the success of a brand in the long term is not based on the number of consumers that buy it once, but on the number of consumers who become regular buyers of the brand” (Mandhachirata and Poolthong 2011).
Customer retention strategy is designed to make it in the best interest of customers to stay with a company rather than switch to another one. Almost for every business, it is more expensive to secure new customers than to keep the existing customers. Studies have shown that small reductions in customer defections produce significant increases in profits because (1) loyal customers buy more products; (2) loyal customers are less price sensitive and pay less attention to competitors’ advertising; (3) servicing existing customers, who are familiar with the company’s offerings and processes, is cheaper; and (4) loyal customers spread positive word of mouth and refer to other customers (Schiffman and Kanuk 2010). Furthermore, marketing efforts aimed at attracting new
15
customers are expensive; indeed, in saturated markets, it may be impossible to find new customers (Schiffman and Kanuk 2010).
The marketing literature provides a wide range of loyalty measures (Odin, Odin, & Valette-Florence 2001), and their usefulness depends on the specific market and study objective (Leenheer, Heerde, Bijmolt and Smidts, 2007). The main distinction in loyalty measures is between attitudinal loyalty and behavioral loyalty (Dick and Basu 1994) (Leenheer, Heerde, Bijmolt and Smidts, 2007). Gremler (1995) suggested that both the attitudinal and behavioral dimensions need to be incorporated in any measurement of loyalty (Srinivasan, Anderson, and Ponnavolu 2002).
3.1 ATTITUDINAL LOYALTY
Attitudinal measures are concerned with consumer’s overall feelings about the product and the brand (i.e. evaluation), and their purchase intentions (Schiffman and Kanuk 2010). Cognitive researchers emphasize the role of mental processes in building brand loyalty. They believe that consumers engage in extensive problem-solving behavior involving brand and attribute comparisons, leading to a strong brand preference and repeat purchase behavior (Schiffman and Kanuk 2010).
Some researchers (e.g., Day 1969; Jacoby and Chestnut 1978) have suggested that a behavioral definition is insufficient because it does not distinguish between true loyalty and spurious loyalty that may result, for example, from a lack of available alternatives for the consumer (Srinivasan, Anderson, and Ponnavolu 2002). In response to these criticisms, researchers have proposed measuring loyalty by means of an attitudinal dimension in addition to a behavioral dimension (Srinivasan, Anderson, and Ponnavolu 2002). Engel and Blackwell (1982) defined brand loyalty as “the preferential, attitudinal and behavioral response toward one or more brands in a product category expressed over a period of time by a consumer” (Srinivasan, Anderson, and Ponnavolu 2002). Jacoby (1971) expressed the view that loyalty is a biased behavioral purchase process that results from a psychological process (Srinivasan, Anderson, and Ponnavolu 2002). According to Assael (1992, p. 87), brand loyalty is “a favorable attitude toward a
16
brand resulting in consistent purchase of the brand over time” (Srinivasan, Anderson and Ponnavolu 2002). This rationale was also supported by Keller (1993), who suggested that loyalty is present when favorable attitudes for a brand are manifested in repeat buying behavior (Srinivasan, Anderson, and Ponnavolu 2002).
3.2 BEHAVIORAL LOYALTY
Behavioral measures are based on observable, factual behaviors regarding the brand, such as quantity purchased, purchase frequency and repeated buying (Schiffman and Kanuk 2010). Behavioral scientists who favor the theory of instrumental conditioning believe that brand loyalty results from an initial product trial that is reinforced through satisfaction, leading to repeat purchase (Schiffman and Kanuk 2010). Many researchers (e.g. Ehrenberg et al. 1990, Blattberg and Sen 1974, Kahn et al. 1986) have defined brand loyalty strictly from a behavioral perspective (Bandyopadhyay and Martell 2007). Behavioral definitions (such as frequency of purchase or proportion of total purchases) lack precision, because they do not distinguish between the real brand-loyal buyer who is intentionally faithful and the spurious brand-loyal buyer who repeats a brand purchase out of mere habit or because it is the only one available in the store (Schiffman and Kanuk 2010). General customer behavior is to buy from a mix of brands within their acceptable range. The customers seem to be less brand loyal when there are more acceptable brands. On the other hand, the products having few competitiors are purchased with great frequency and therefore are seen as having great brand loyalty. Thus, a more favorable attitude toward a brand, service, or store, compared to potential alternatives, together with repeat patronage, are seen as the requisite components of customer loyalty (Schiffman and Kanuk 2010).
Many researchers (e.g., Ehrenberg et al. 1990, Kahn et al. 1986, Ehrenberg 2000) believe that repeat purchasing can capture the loyalty of a consumer towards the brand of interest. Lipstein (1959) and Kuehn (1962) measured loyalty by the probability of product repurchase (Srinivasan, Anderson, and Ponnavolu 2002). Similarly, Sharp et al. (2002) suggest that attitude is not relevant to determining brand loyalty. Their research
17
is purely based on the notion that there is no ‘‘true’’ definition to brand loyalty, and that debating this topic is a ‘‘waste of time’’ (Bandyopadhyay and Martell 2007).
A common theme across this stream of work has been the attempt to look for a surrogate behavioral measure to operationalize brand loyalty. The major assumption here is that this (repeat) purchasing could capture the loyalty of a consumer towards the brand of interest. Thus, while some researchers have observed purchasing patterns and made conclusions based on the proportion of purchases devoted to a particular brand (Cunningham 1956, Blattberg and Sen 1974), others have focused on the purchase sequence (Kahn et al. 1986, McConell, 1968) (Bandyopadhyay and Martell 2007). In fact, many researchers have struggled over the years to distinguish between repeat purchase and brand loyalty,and to define brand loyalty—a complex multidimensional phenomenon—on a single behavioral dimension (Jacoby and Kyner 1973) (Bandyopadhyay and Martell 2007).
Dick and Basu (1994) were precise in suggesting that a favorable attitude and repeat purchase were required to define loyalty (Bandyopadhyay and Martell 2007). By viewing loyalty as an attitude–behavior relationship in their framework, they were thus able to investigate the concept from a causal perspective—thereby permitting the identification of the antecedents of loyalty (Bandyopadhyay and Martell 2007). Their research, however, offers only a theoretical framework, and did not provide any empirical validation of their theory (Bandyopadhyay and Martell 2007).
In a recent paper, East et al. (2005) empirically tested Dick and Basu’s (1994) theory that consumer loyalty is characterized by a favorable attitude and repeat purchase (Bandyopadhyay and Martell 2007).
Behavioral brand loyalty leads to a higher market share whereas the attitudinal loyalty enables the marketer to charge a higher price for the brand relative to the competition. The findings of Parasuraman’s et al. (1988, 1991a,b), Reichheld and Sasser (1990), and Boulding et al. (1993) indicated that when consumers’ perceptions of service quality are
18
high, consumers are willing to recommend the company to others (Athanassopoulos and Ilıakopoulos 2003). Other researchers (see Richins 1993, Singh 1988) have indicated that when consumers perceive to have experienced inferior service performance, they are likely to engage in a complaining behavior to third parties (i.e., exhibiting negative word-of-mouth communications) (Athanassopoulos and Ilıakopoulos 2003). Finally, Zeithaml et al. (1996), in their multi-company/ multi-industry study on the relationship between service quality and behavioral intentions, inferred that service quality is positively associated with communication behavioral intentions (e.g., intention to recommend the service provider and/or complaining behavior) (Athanassopoulos and Ilıakopoulos 2003).
Positive recommendation is, perhaps, the most useful loyalty indicator in the context of fixed line telecommunication services, since customer positive behavior cannot easily be expressed in terms of repurchase, increased consumption, and/or intensified usage of the products/services offered by the telecommunications operator.
3.3 PERCEIVED SERVICE QUALITY (PSQ)
Over the last ten years or so, a great deal of research has been dedicated to the analysis of service quality (Avkiran, 1994, Crosby and Stephens 1987, Johnston 1997, Lassar et al. 1987, Rust and Zahorik 1993, Brady and Robertson 2001, Robledo 2001, Silvestro et a. 1990, Yavas et al 1997) (Gournaris, Stathakopoulos, and Athanassopoulos 2003). Consumers’ perceived quality of a product (or service) is based on a variety of informational cues that they associate with the product. Some of these cues are intrinsic to the product or service; others are extrinsic. Either singly or together, such cues provide the basis for the perception of product and service quality (Schiffman and Kanuk 2010).
It is more difficult for consumers to evaluate the quality of service than the quality of products. This is because of the distinctive characteristics of services. The services are intangible, variable, perishable and simultaneously produced and consumed.
19
The most widely accepted framework for researching service quality stems from the premise that a consumer’s evaluation of a service quality is a function of the magnitude and direction of the gap between the customer’s expectations of service and the customer’s assessment (perception) of the service actually delivered (Schiffman and Kanuk 2010).
Perceived service quality is defined by Parasuraman et al. (1988) as "a global judgment, or attitude, relating to the superiority of the service," and many researchers in the service quality literature concur with this definition (Boulding et al. 1993, Bolton and Drew 1991; Cronin and Taylor 1992) (Spreng and Mackoy 1996).
The service quality literature has maintained that the distinction between perceived service quality and satisfaction is that they use different standards of comparison (Bitner 1990, Parasuraman et al. 1988, Zeithaml et al. 1993) (Spreng and Mackoy 1996). These authors have argued that the standard of comparison in forming satisfaction is predictive expectations, or what the consumer believes will happen, while perceived service quality is the result of a comparison of performance and what the consumer feels a firm should provide (Spreng and Mackoy 1996).
In the literature, there has been considerable progress as to how service quality perceptions should be measured (e.g., Babakus and Boller 1992, Brown, Churchill, and Peter 1993, Cronin and Taylor 1992, Parasuraman, Zeithaml, and Berry 1985, 1988, 1991, 1994; teas 1993) but little advance as to what should be measured (Brady and Cronin Jr. 2001). Researchers generally have adopted one of two conceptualizations. Conceptualizations Advanced in the Literature is shown in Figure 3.1 below.
20
Figure 3.1: Conceptualizations advanced in the literature
Source: Brady, M.K. and Cronin Jr, J.J., Some New Thoughts on Conceptualizing Perceived Service
Quality: A Hierarchical Approach, July 2001
The first is the “Nordic “ perspective (Grönroos 1982,1984) which defines the dimensions of service quality in global terms as consisting of functional and technical quality (Brady and Cronin 2001).
The second, the “American” perspective (Parasuraman, Zeithaml, and Berry 1998), uses terms that describe service encounter characteristics (i.e., reliability, responsiveness, empathy, assurances, and tangibles) (Brady and Cronin 2001).
The third perspective shown in Figure 3.1, Panel C is the three-component model offered by Rust and Oliver. The three components are the service product, the service delivery and the service environment. Rust and Oliver do not test their conceptualization, but support has been found for similar models in retail banking
21
(McDougall and Levesque 1994) and health care samples (McAlexander, Kaldenberg, and Koenig 1994) (Brady and Cronin 2001).
Dabholkar, Thorpe and Rentz (1996) identify and test a hierarchical conceptualization of retail service quality that proposes three levels: (1) customers’ overall perceptions of service quality, (2) primary dimensions, and (3) subdimensions (see Figure 3.1, Panel D). This multilevel model recognizes the many facets and dimensions of service quality perceptions (Brady and Cronin 2001).
The agenda on service quality was quickly enhanced by examining its consequences, such as customer retention, attraction of new customers through word of mouth advertising, increases in productivity, improvements in market share, reduction in staff turnover and operating costs, improvements in employee morale, financial performance and profitability (Julian and Ramaseshan 1994, Lewis 1989,1993, yavas et al. 2011) (Gournaris, Stathakopoulos, and Athanassopoulos 2003). Service quality is now considered a critical success factor that affects an organization’s competitiveness. Furthermore, service quality is considered an essential determinant that allows an organization to differentiate itself from the competition and therefore gain a sustainable competitive advantage.
3.4 CONCLUSION OF THE LITERATURE SURVEY
CSR programs are designed to accomplish a variety of responses within the consumer stakeholder group, ranging from improving attitudes via corporate (Simon 1995) and brand image (Fombrun 1996), and enhancing product evaluation (Brown and Dacin 1997), to increasing the customer’s willingness to purchase the company’s products (Brown and Dacin 1997, Sen and Bhattacharya 2001) (Pirsch, Gupta, and Grau 2007). It is recognized, too, that while specific elements of a company’s CSR program may be targeted primarily at non-consumer stakeholders such as investors or employees, consumers make evaluations of CSR programs more holistically.
22
Research shows that CSR initiatives in various forms become active channels for building customer loyalty. For example, supporting a cause (Miller 2002), community involvement (S 1997), supporting women’s rights, and philanthropy (Kroll 1996) all have been shown to assist in generating loyal customers (Pirsch, Gupta, and Grau 2007). Customer loyalty has a variety of definitions and motivations in literature and practice. A managerial view of loyalty stems from the benefit that the customer response has to offer to the firm. Businesses are motivated to generate customer loyalty primarily for economic reasons: an increase in customer retention has been shown to produce substantial increases in net present value of profits (Reichheld and Sasser 1990, Reichheld 1996) (Pirsch, Gupta, and Grau 2007). In addition, customer loyalty is instrumental in generating sustainable competitive advantage (Kotler 1984), and can lead to cost savings, referrals, unaided brand awareness, greater awareness of brand assets, and a reluctance to defect (or a tendency to complain rather than defect) (Duffy 2003) (Pirsch, Gupta, and Grau 2007).
In this thesis, it is aimed to explore the relationship between CSR and customer loyalty in the telecommuniciations sector in Turkey. There are three operator in the Turkish market serving as Global System for Mobile Communication (GSM) operator. The competition is very agressive. Differentiating the services is not enough. Although there is a high price discounted offers and higher incentives being offered, the companies are paying attention for being socially responsible. Huge amounts of money is being spend to the social responsibility projects and to their advertising campaigns. Here, in this thesis, it is aimed to understand if there is a positive relationship between CSR activities and customer loyalty in Turkish telecommunication sector.
23
24
4. RESEARCH DESIGN AND METHODOLOGY
4.1 AIM AND SCOPE OF THE STUDY
The aim of the study is to explore the relationship between CSR and customer loyalty in the Turkish telecommunication sector. The target segment of this research was the people who are using at least one GSM operator in their daily life. This study did not focus on customers who patronise any one particular GSM operator.
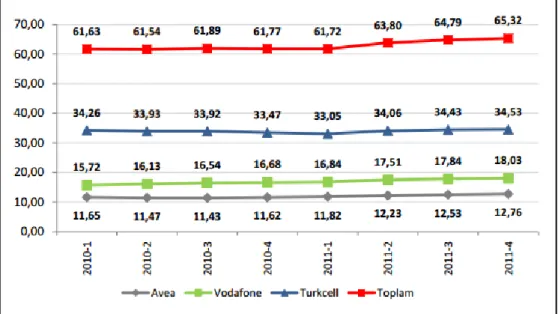
There are three GSM operators in Turkey which are called Turkcell, Vodafone and Avea. According to data announced by Turkish Staistical Institute, the population of Turkey is 74.724.269 as of December 31, 2011 (online, web site). Based on the announcements of Information and Communication Technologies Association (ICTA), as of December, 2011, the line penetration is approximately 88,6 per cent which corresponds to the existence of 65,3 million mobile operator subscriber (online, web site). According to the subscriber numbers announced by ICTA as of quarter 4, 2011, the market shares of each operator based on subscriber numbers is calculated as Turkcell 52,87 per cent, Vodafone 27,59 per cent and Avea 19,54 per cent.
Figure 4.1: Total subscriber numbers in terms of operators (million)
25
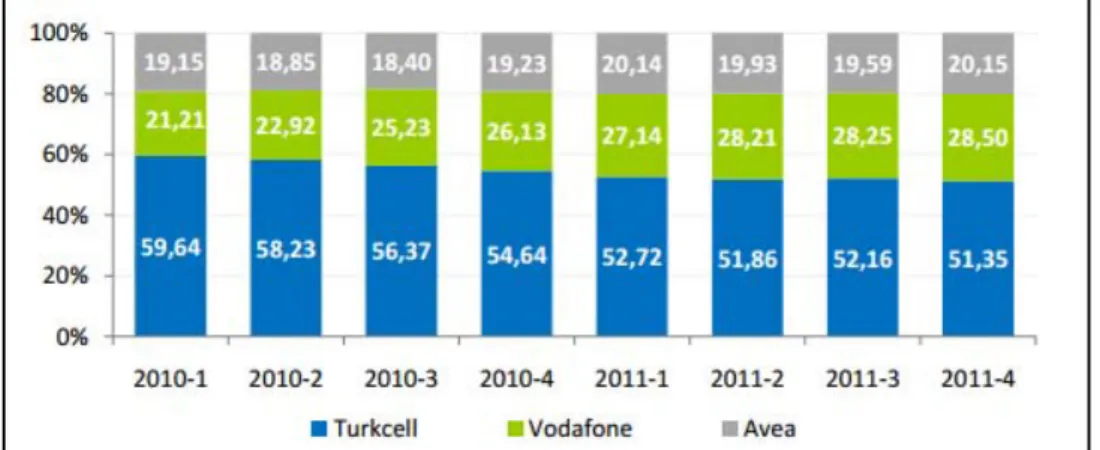
Figure 4.2: The market shares of the mobile operators based on subscriber numbers (per cent)
Source: 4th Quarter Operations Report, 2012, ICTA
As of quarter 4, 2011, the revenue market shares of each operator announced by ICTA is Turkcell 51,35 per cent, Vodafone 28,5 per cent and Avea 20,15 per cent as shown in Figure 4.3. Turkcell is the leading operator in terms of both subscriber number and revenue. Vodafone is the second player and Avea is the third player.
Figure 4.3: The market shares of the mobile operators based on revenue
26
4.2 SURVEY SAMPLING AND SURVEY DESIGN
A convenience sampling technique was employed. The final questionnaire was checked by the thesis supervisors. The questionnaire was originally adopted in English and then double translated. The survey was distributed from the social networks online.
The hypothesis developed for this thesis are designed as below.
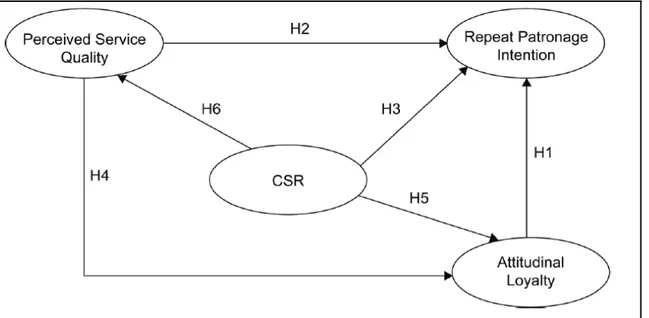
H1. Attitudinal loyalty is positively related to repeat patronage intentions (behavioral intentions).
H2. Perceived service quality is positively related to repeat patronage intentions (behavioral loyalty).
H3. CSR is positively related to repeat patronage intentions (behavioral intentions). H4. Perceived service quality is positively related to attitudinal loyalty.
H5. CSR is positively related to attitudinal loyalty.
H6. CSR is positively related to perceived service quality.
In figure 4.4, the interrelationships of the hypotheses are shown below.
27
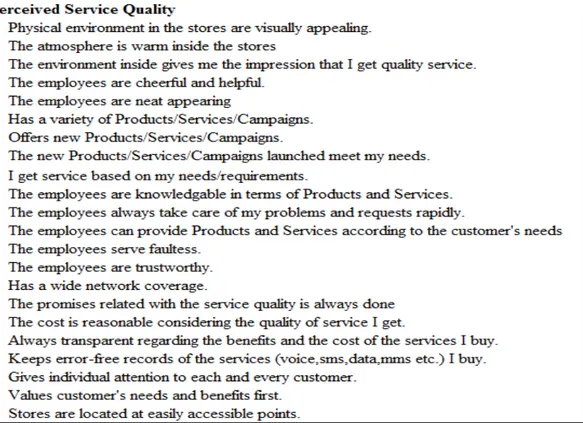
4.2.1 Perceived Service Quality
Perceived service quality is a multidimensional construct with a variety of operationalizations, depending on the type of service, industry, and the specific context of the study (Angur et al. 1999, Chiou and Droge 2006, Cronin and Taylor 1992). SERVQUAL (Parasuraman et al. 1988, Parasuraman et al. 1985) and SERVPERF (Cronin and Taylor 1992) are the two most commonly used measures of perceived service quality (Mandhachirata and Poolthong 2011). In order to measure service quality, this thesis adopted the SERVQUAL under the main topics of tangibles, reliability, responsiveness, assurance and empathy. All were measured on a five-point Likert scale. The original questions asked in the survey are listed in Table 4.1.
Table 4.1: Perceived service quality questions
4.2.2 Corporate social responsibility (CSR)
The domains of socially responsible behavior are diverse (Sen and Bhattacharya 2001). However, the five most important items of CSR activities suggested by Owen and
28
Scherer (1993) are: environmental pollution, corporate philanthropy, disclosure of social information, representation of women, and representation of minorities (Mandhachirata and Poolthong 2011). The managerial accounting firm Ernst & Ernst developed a set of “ social responsibility disclosures”, which includes six categories of CSR, namely environment, equal opportunity, personnel, community involvement, products, and others (Carroll, 1999) (Mandhachirata and Poolthong 2011).
Carroll (1979, 1991) advanced a well recognized CSR framework which posits that the social responsibility of the business sector encompasses economic, legal, ethical, and discretionary (philanthropic responsibility) expectations that society has of organizations. This paper adopts three elements of Carroll’s CSR framework which deal with economic, ethical, and philanthropic dimensions. All were measured on a five-point Likert scale. The original questions asked in the survey are listed in Table 4.2.
Table 4.2: Corporate social responsibility (CSR) questions
In the second part, sixteen CSR projects are listed and respondents are asked to match these with the GSM operators in order to measure their awareness and also the degree of perceived associations between the company and CSR activities.
4.2.3 Attitudinal Loyalty
The four-item scale of attitudinal loyalty was adapted from Zeithaml et al. (1996), Chaudhuri and Holbrook (2001), Chiou et al. (2002), and Fullerton (2005) (Mandhachirata and Poolthong 2011). Four items deal with the psychological attachment towards the service provider. They asked about different attitudinal
29
components of being loyal to the GSM operator, such as being willing to provide positive word of mouth recommendation and considering himself/herself as a loyal customer of the GSM operator. All items were measured on a five-point Likert scale. The original questions asked in the survey are listed in Table 4.3.
Table 4.3: Attitudinal loyalty questions
4.2.4 Repeat Patronage Intention
Repeat patronage intention refers to customer intention to further patronize the service provider, and the intention to increase both the scale and scope of the relationship. The operationalization of this construct follows Zeithaml et al. (1996); Chaudhuri and Holbrook (2001), and Sirdeshmukh et al. (2002) (Mandhachirata and Poolthong 2011) with a three-item scale which was measured on a five-point Likert scale. The original questions asked in the survey are listed in Table 4.4.
Table 4.4: Repeat patronage intention questions
Repeat Patronage Intention
I keep using my GSM operator under any circumstances.
I use the same GSM operator when I need a new Product / Service
I use all the telecommunication services (voice, internet, other services) from my own GSM operator.
30
4.3 ANALYSIS AND DISCUSSION
There were 300 respondants who filled out the online survey. In order to start the analysis, first missing value analysis has been performed to the questions from which the hypothesis developed. There were twenty two questions to test Perceived Service Quality, five questions for CSR, four questions for the Attitutional Loyalty and three questions for the Repeat Patronage Intention. Sixteen survey results are excluded after missing value analysis since they have more than 10 per cent missing value. These insignificant indicators were removed and some modifications were made to increase the clarity of the questionnaire in the final study.
The usable 284 respondents or approximately 95 per cent were included in the main study; 50,7 per cent were female and 49,3 per cent were male. The majority of respondents ( 44 per cent) were 31-40 years old. The following age group very similar to majority (43 per cent) were 20-30 years old. 13 per cent of the respondents were over 40 years old. 54 per cent of the respondents have graduated from the university. 28 per cent of the respondents have master or doctorate degree. These well educated respondents were targeted in the belief that CSR issues become more important earlier to the educated rather than other segments of society.
To test scale dimensionality and validation of the four constructs both exploratory and confirmatory factor analysis were performed. Kaiser-Meyer-Olkin Measure of Sampling Adequacy of the factor test was 0,953 and the Bartlett's Test of Sphericity significance was 0,000 that shows that sample size was satisfactory to perform factor analysis. There were no items with communalities below 0,50. After that Rotated Component Matrix has been analysed. Five items of the perceived service quality scale and one item of the CSR scale were eliminated during the process of data reduction. This is because five questions of the perceived service quality did not match with any factor. These questions were : the promises related with the service quality is always done, keeps error-free records of the services (voice,sms,data,mms etc.) I buy, stores are located at easily accessible points, has a wide network coverage, and I get service based on my needs/requirements.
31
The eliminated item from CSR scale was the question related with the focus on customer rights: “I believe that they uphold consumer rights”. The reason behind the elimination was that the item was grouped under the assurance factor not under the CSR factor.
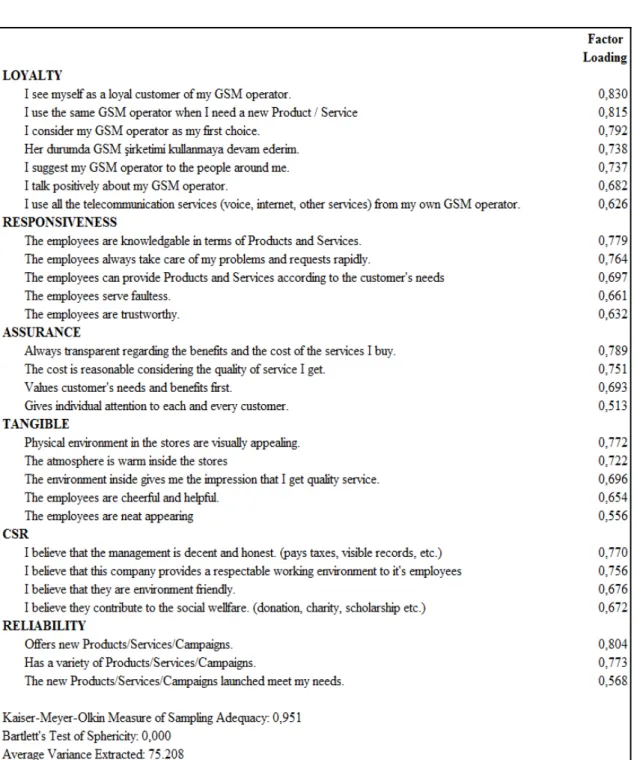
These six items have been removed from the analysis and factor analysis has been revised. After the elimination of those questions, finally six factors have been grouped. The factors that emerged from the Rotated Component Matrix did not equally match with the thesis model. Each factor has been regrouped under the subjects of loyalty, CSR, responsiveness, assurance, reliability and tangibilty. Both attitutional loyalty and repeat patronage intentions questions were merged under one factor which is lately named as loyalty. Four of the five CSR questions were under CSR Factor. In the design of the questionnaire PSQ was composed of five subtitles named as tangibles, reliability, responsiveness, assurance and empathy. After the factor analysis emphaty construct was excluded. Factor Loadings are shown in Table 4.5.
32
Table 4.5: Factor loadings
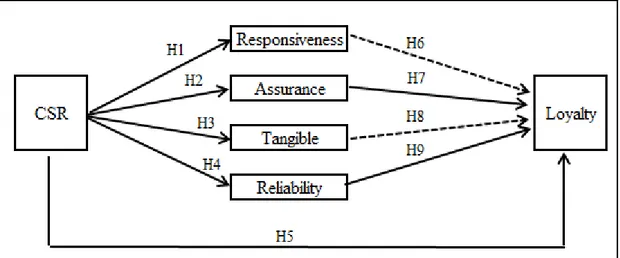
The revised model of the thesis was shaped as shown in Figure 4.5. The revised hypothesis have been composed as follows:
H1. CSR is positively related to responsiveness (perceived service quality) H2. CSR is positively related to assurance (perceived service quality)
33
H3. CSR is positively related to tangible (perceived service quality) H4. CSR is positively related to reliability (perceived service quality) H5. CSR is positively related to loyalty (attitudinal and behavioral loyalty).
H6. Responsiveness is positively related to loyalty (attitudinal and behavioral loyalty). H7. Assurance is positively related to loyalty (attitudinal and behavioral loyalty). H8. Tangible is positively related to loyalty (attitudinal and behavioral loyalty). H9. Reliability is positively related to loyalty.
Figure 4.5: The revised model
After finalizing the factor analysis, six factors were labeled by transforming the factors. Then reliability analysis was assessed by examining the loadings of each indicator. Reliability, correlation and regression analysis were performed based on the new model. The results of reliability analysis of each factor is shown in Table 4.6. All of the factors’ Cronbach's Alpha values were more than 0,7 which shows that all of the factors were reliable. All of the factors’ reliability results are between 0,839 and 0,941 which shows that the results were very satisfactory (over 0,8).
The total scales of the factors were composed. The correlation analysis was performed by using new constructs after reliability analysis. There were correlations between loyalty, CSR and perceived service quality variables. The minimum correlation was
34
between CSR and reliability at 0,558 level. The maximum correlation was between assurance and responsiveness at 0,752 level. There was strong relationship between assurance and responsiveness. The relationship betwen CSR and reliability is comperatively weaker. The correlation analysis results of each factor is shown in Table 4.6.
Table 4.6: Correlation results
Note: The items at the end of the triangle shows the reliability results.
Then, finally regression analysis has been performed. First, the regression analysis has been done by taking loyalty as a dependent variable. The results are shown in Table 4.7. As a result of this analysis, assurance (β=0,233,pR=0,000<0,05), realiablity
(β=0,226, pR=0,000<0,05) and CSR (β=0,357, pR=0,000<0,05) have a direct relationship
on loyalty. Hypothesis 5, 7, and 9 of the revised model are supported. Responsiveness (β=0,038, pR=0,567>0,05) and tangibility (β=0,046, pR=0,426>0,05) did not have direct
35
Table 4.7: Regression analysis results of loyalty
After analysing the relationship of the factors with loyalty, detailed regression analysis has been performed in order better understand the factors affecting CSR. There is a direct relationship between CSR and responsiveness (β=0,616, pR=0,000<0,05). CSR
also have direct impact on assurance (β=0,615, pR=0,000<0,05), tangiblity
(β=0,604, pR=0,000<0,05) and reliability (β=0,549, pR=0,000<0,05).
The results of regression analysis between CSR and responsiveness is shown in Table 4.8. In table 4.9, regression analysis results of CSR and assurance is shown. In table 4.10, CSR and tangibility regression analysis is shown. Finally, in table 4.11, regression analysis results of CSR and reliability is shown. According to the regression analysis results shown in Table 4.8, 4.9, 4.10 and 4.11, hypothesis 1, 2, 3 and 4 of the revised model are supported.
36
Table 4.8: Regression analysis results of CSR and responsiveness
Table 4.9: Regression analysis results of CSR and assurance
37
Table 4.11: Regression analysis results of CSR and reliability
In the survey questionnaire, the respondents were also asked to match sixteen CSR projects with the correct GSM operator. Since this part was not mandotary, there were more missing replies. The results of the matches is shown in Table 4.12. The dark per cents are showing the correct GSM operator matches. When Table 4.12 has been analysed, it is seen that Turkcell’s CSR projects’ matches are much more correct than the other operators. Seven projects of Turkcell has been correctly matched over 49 per cent of respondants.In the average, 71 per cent of the respondants have correctly matched Turkcell’s projects. The ratio is lower for the other two operator. The average is 38 per cent for Vodafone and 28 per cent for Avea as calculated from the correctly matched percentages.
Table 4.12 shows that, although all of the operators spend huge amounts of money for their CSR projects, customers could not correcly match the projects with the right GSM operator. It can be said that there is lack of communciation here, as shown by the results of this thesis. The target segment which is the consumers of the operators have not fully or correctly been informed by their operators’ direct or indirect advertisements related with CSR projects. On the other hand, Turkcell’s success can be explained by the sustainibility of the projects. Turkcell’s CSR projects are comperatively long term projects, and television communication of those projects have supported the awareness from time to time.
38
Table 4.12: Results of CSR project vs GSM operator match
As a summary, in this thesis the relationship between customer loyalty and CSR has been examined. The target segment was telecommunication customers in Turkey. As a result of the analysis, the relationship between CSR and loyalty has been proved. Beside that CSR has a direct impact on loyalty, CSR also has direct impacts of PSQ dimensions except empathy. Moreover, two dimensions of PSQ which are assurance and reliability have a direct impact on loyalty. The relationships of responsiveness and tangiblity on loyalty has not been supported. The results of the hypothesis are shown in Table 4.13.
39
Table 4.13 show that CSR projects play an important role in customer loyalty as well as in perceived service quality. Telecommunication companies’ attitudes and approaches on social responsibility projects creates customer loyalty both directly and indirectly. Indirect loyalty is suppported by two of the the perceived service quality constructs of assurance and reliability. New and variety of products and services that meet the customer’s needs creates loyalty. Besides transperancy, reasonable costs, individual attention and caring customer needs and benefits have also direct effect on loyalty.
40
5. CONCLUSION, LIMITATIONS & FUTURE RESEARCH
5.1 CONCLUSION
In this research, the relationship between CSR and customer loyalty has been examined. Although there are many researches supporting the CSR and customer loyalty relationship in the literature, a research in telecommunication sector in Turkey on this subject has not been found. The findings of this research were similar to the researches done before and once more certified the relationship between CSR and loyalty. This thesis contributes to the literature by making clear the relative effects of CSR and loyalty in the telecommunication sector. The conduct of the present research in Turkey is another contribution to the understanding of different cultures.
300 respondents have responded to the survey. The survey had been distributed online. There was no specific target segment based on any demographics or usage behavior. Anyone who uses at least one GSM operator was in the target. The respondents were mainly from the educated segment of the society.
The findings of the research were not similar with the proposed model. The respondents of the survey do not differentiate attitudinal loyalty and repeat patronage intention concepts. It has been seen that behavioral loyalty, attitudinal loyalty and repeat patronage intention concepts did not have separate effects and perceptions on telecom customers. There was not any differentiation point. All of the questions were grouped together during the analysis. Therefore, these two subjects are summarized as loyalty in the revised model.
Moreover, the research results showed that there is not overall perceived service quality for telecom customers. The dimensions have different impacts. The four dimensions of PSQ which are responsiveness, assurance, tangibility and reliability are associated with PSQ by the respondents. The fifth dimension, empathy, was excluded during the analysis since the respondents did not associate it with PSQ. According to the
41
SERVQUAL scale, individual attention, convenient hours, personal attention and best interest subjects can be summarized under the empathy dimension. The results showed that Turkish customers did not pay more attention on these subjects in order to become a loyal customer.
According to the results, the model of the thesis has been replaced with the revised model after analyzing the surveys as shown in Figure 4.4. The results have shown that there is a relationship between CSR and customer loyalty in the telecommunication sector in Turkey. 300 respondents have shown that CSR has a direct impact on loyalty beside that CSR also have direct impacts on responsiveness, assurance, tangibility and reliability dimensions of PSQ. On the other hand, two of PSQ dimensions which are assurance and reliability have also direct impact on customer loyalty. The results showed that responsiveness and tangibility did not have direct relationship but may have indirect relationship via other PSQ dimensions on loyalty.
In order to understand whether there is an indirect relationship between responsiveness, tangibility, reliability and assurance further regression analysis has been performed. In Table 5.1, regression analysis results of responsiveness and assurance, tangiblity and reliability have been shown. Responsiveness has direct impact on assurance (β=0,043, pR=0,000<0,05), reliability (β=0,048, pR=0,022<0,05) and tangibility
(β=0,054, pR=0,000<0,05).
Table 5.1: Regression analysis results of responsiveness and assurance, tangibility and reliability
42
In Table 5.2 regression analysis results of tangible and assurance, responsiveness and reliability have been shown. Tangibility has direct impact on responsiveness (β=0,057, pR=0,000<0,05) and reliability (β=0,047, pR=0,000<0,05). Tangibility did not
have a direct impact on assurance (β=0,052, pR=0,166>0,05).
Table 5.2: Regression analysis results of tangibility and assurance, responsiveness and reliability
Further analysis results showed that responsivenss and tangibility may have an indirect relationship on loyalty. This is because, responsiveness has direct relationship with assurance and reliability that they have a direct relation with loyalty as supported in H7 and H9. Also, tangibility has direct relationship with reliability that it has a direct relation with loyalty as supported in H9. When the questions has been analysed responsiveness can be combined with reliability in the consumer’s mind. Employee’s behaviors, knowledge and way of working may be effective on loyalty when new and variety of products that meet the customer’s expectations are offered. On the other hand, that may be effective on loyalty also when the transperancy, reasonable costs, individual attention and customer value have felt by the customers. Besides, the same relationship may be valid for tangibility. As long as the employee’s behaviors, knowledge and way of working have met the expectations of customers, they can respond to the tangible criterias which are related with the physical environment as a loyalty tool.
There were some questions excluded during the analysis of the research. The respondents did not match consumer rights under CSR subject. This was the only