GPS/TEC
Estimation with TONOLAB Method
H.Nayirl,
F. Arikan2, 0. Arikan3, C.B. Erol4'Aselsan
Inc.,hnayirgmst.aselsan.com.tr
M.Akif Ersoy Mah., 16. Str. No: 16,Yenimahalle, Ankara, 06370, TURKEY 2HacettepeUniversity
Departmentof Electrical andElectronicsEngineering,
arikanghacettepe.edu.tr
Beytepe,Ankara, Turkey
3Bilkent
UniversityDepartmentof Electrical and ElectronicsEngineering,
oarikangee.bilkent.edu.tr
Bilkent, Ankara, Turkey4TUBITAK, UEKAE
Kavaklidere, Ankara, Turkey,
cemil.erolgiltaren.tubitak.gov.tr
Abstract- Total Electron Content (TEC) is a key variable to
measure the ionospheric characteristics and disturbances. The I. INTRODUCTION
GlobalPositioning System (GPS)can be used for TEC estimation Ionosphere forms the most important atmospheric layer for
making use of the recorded signals at the GPS receiver. Reg-Est HF and satellite communication systems. Ionosphere varies method that is developed by F.Arikan, C.B. Erol and 0. Arikan with
time,
frequency, and location. Total Electron Contentcan be used to estimate high resolution, robust TEC values (TEC) provides a convenient measure for observing the
combining GPS measurements of 30 s resolution obtained from
variability
of theionosphere
and characterization of the the satellites which are above the 10° elevation limit. Using this distortion on radio signals. TEC is defined as the total number method,it ispossible toestimateTEC values for a whole day or adesired time period both for quiet and disturbed days of the offree electrons along a ray path of 1 m2 crosssection. TEC is
ionosphere. Reg-Est provides robust TEC estimates for high- closely related to solar and geomagnetic activities. TEC is
latitude, mid-latitude and equatorial stations. Inthisstudy, some measured in TECU units (1 TECU=1016 el/2). The Global
important parameters of Reg-Est such as ionospheric thin shell Positioning System (GPS), due to its availability for civilian height, weighting function and receiver-satellite biases are use in the last 10 years, provides a cost-effectivealternativefor investigated. By incorporating the results of the investigation, estimating TEC through recorded signals at the GPS receiver.
Reg-Est algorithm is developed into IONOLAB method. Thin Although the ionospheric group delay or phase advance on the shell model height is an important parameter for Single Layer recorded GPS
signals
is amajor
source ofpositioning
errors, Ionosphere Model (SLIM). In this study, it is shown thatIONOLAB provides reliable and robust TEC estimates these parameters can be used to compute TEC efficiently. independent of the choice of
indpenentof
he hoie the maximum ionization height Reg-Est method developed byF.Arikan,
C.B. Erol and0.
o th maimu
ioizaionheiht.Arikan
iS new alternative for estimation of robust TECby
Signals from the low elevation satellites are prone to multipathArinis
newalterti for stima
tion obtTEob
effects. In order to reduce the distortion due tomultipath signals, combiningGPSmeasurementsof 30 sresolution obtained from the optimum weighting function is implemented in IONOLAB, the satellites which are above the 10° elevation limit [1], [2],minimizing the non-ionospheric noise effects. GPS receivers "in press" [3]. The method is based on combining GPS record both pseudorange and phase data of signals. IONOLAB measurements in least squares sense. An optional weighting
can input absolute TEC computed from the pseudorange function and median filter is also applied. The method is measurements or phase-corrected low-noise TEC. The TEC capable of deriving TEC estimates for a whole day or for a
estimates for both of these inputs are in good accordance with limited period within a day. each other. Thus, taking either pseoudorange orphase-corrected T i t s
measurementdata asinput, high resolution, robustTECestimates use of web based
The ionosper 'thell height
satellite-receiver instrumental biases in
wightr
ng fion an
Reg-teg
can beobtained from IONOLAB. Another importantparameter Est are the parameters that are investigated in this study. The for TEC estimation is satellite-receiver instrumental biases. Thebiases are the frequency dependent delays due to satellite and choice ofionospheric thin shell height, appropriate weighting
receiver hardware. In order to compute TEC, satellite and function that minimizes the non-ionospheric irregularities and receiver biases should be removed from GPS measurements different methods for incorporation of instrumental biases are correctly. However, the proper procedure of how to include them studied in detail. The method for phase-corrected TEC is in the TEC computation is generally vaguely defined. IONOLAB developed and used as an alternative for absolute TEC in suggests a technique for inclusion of the hardware biases obtained Est. The proper choice of alternative are incorporated into Reg-from the web for TEC estimates that are consistent with the Etadtenwmto scle sJNLB
results from the IGS analysis centers.
II. REG-EST PARAMETERS Bias inclusion method 1: In previous studies, Reg-Est algorithm is tried for various 1 2
days andstations. It is shown that the method produces robust STECUm (n) = A
212
[p4 tm(n) +c(DCBm +DCBU)] (1) TECestimates for various stations for both quiet and disturbed f1-days in studies [1],[2] and "in press" [3]. Theresults are also VTEC-
(n)
STEC,-
(n)IM(,c7
(n))
(2)
comparedwith IRI-2001 and IGS analysis centers results. It is U (
shown thatReg-Est TEC estimates are in goodaccordance with where
various analysis centers. Using Reg-Est method, estimates are 21-1/2
obtained at higher time resolution compared to IRI-2001 and M(E (n)) I
(3)
IGS results. Therefore, Reg-Est provides an important L R + h J
alternative for tracking the sudden ionospheric irregularities
and disturbances. In the above equations, P4 is the geometry free linear
combination of pseudorangevalues (P4=P2-P1). A is constant
In
this
paper,Reg-Est
isapplied
to alarger
range ofGPS which is equal to40,3
m3/s2.
DCBm
andDCB,
are thestations from
mid-latitude,
high-latitude and equatorial regions.
'
. ~~~~frequency
. .
f dependent satellite and receiver instrumentalas
given
in TABLE i. Thedays
areselected
fromquiet
andbiases,
respectively.
m denotessatellite,
u denotes receiverdisturbed days of October 2003. The list of quiet anddisturbed
and
n isthe time
sample.
In Eq.(2),
STEC isconverted
todays areavailable at Ionospheric Dispatch Center (IDCE) [8]. VTEC
using
amapping
function
that isgiven
inEq.(3).
Mis As provided in [8], 10 October is quiet, 27-28-29 October are TEuasin
gfiun
eis thatei elevatIn angle. Inpositively
disturbed, 30-31 October arenegatively
disturbedthe mapping function
and£isthe satellite elevation
angle. Indays. In the last days of October 2003, a
major
geomagnetic Mand solar storm caused severe ionospheric disturbances. Kp Method 2 includes satellite and receiver biases in VTEC
indexrose up to 9 and Dst index fell as low as -400 nT. In this computation. The biases are added in TECU units [1],[2] as
section, the effect of ionospheric parameters such as shownbelow in Eq. (5).
ionospheric thin shell height, weighting function and satellite- Bias inclusion method 2:
receiver instrumental biasesarestudied. f 2 2
TABLE1 STECm(n) 12 2
[P4,u
(n)] (4)ListofGPS recevier stations A1 -f2
ReeiverStation Country Latitude Longitude VTEC m(n) STEC m(n)/M(em (n))+bm+b, 5)
Ankara Turkey 39,53N 32,45E C u
Braiksel
Belgium 50,47N4,21
EBias
inclusion Method
1and 2 are used
in the
computation
Graz Austria 47,04N 15,29E
of STEC and VTEC in
preprocessing of input data
for Reg-Est
Zelenchukskaya
Russia43,17
N 4 1,33 Emethod
for stationsgiven TABLE
i.
Theinstrumantal
biases are Arti Russia 56,25 N 58,33 E availablein
IONEX
files of IGSanalysis
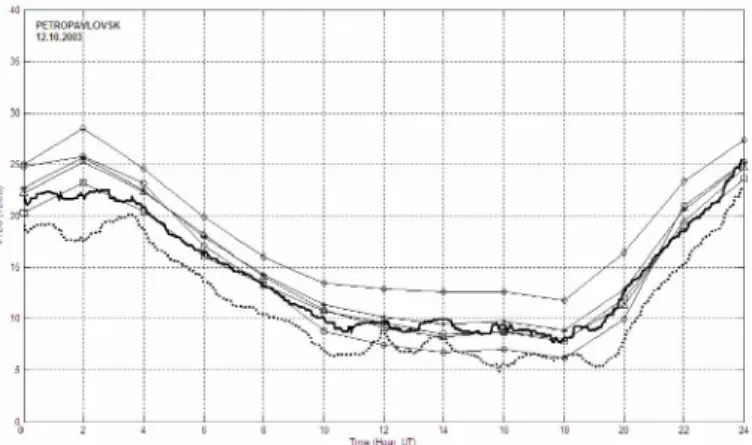
centers [12]. As anKiruna Sweden 67,51N 20,58 E example,results for Petropavlovsk 12.10.2003 is given in Fig.
Metsahovi Finland 60,13N 24,41 E 1. In Fig. 1, solid line and dashed line display theReg-Est TEC
Petropavlosk Russia 53,04N 158,36 E estimates with bias inclusion method 1 and method 2,
Petrop k PapuaNewR 04 N 1 E
respectively.
TECestimates
of variousIGS
analysis
centersareLae
|Guinea
06
5 146,59 E alsoprovided
inFig.
1. These TEC maps are obtained from Manila Philippines 14,38 N 121,04 E [12]. In Fig. 1, JPL, CODE, ESA/ESOC, UPC estimates are Nanyang Singapore 01,20 N 103,40 E displayed with diamond, square, circle and triangle symbols,respectively. As can be observed from Fig. 1 that the TEC
estimates from Method 1 isvery closetothe results ofCODE
andestimates from both methodsareinverygood accordance. Instrumental satellite and receiver biases are important
Reg-Est
estimatesusing
both bias inclusion methods areparameters for TEC estimation. GPS measurements include comparedwith results of otheranalysiscenters inby using D1,
both ionospheric delay and satellite-receiver instrumental D2, and D3 defined below. Xbl, andXb2 are TEC estimation
biases. In order to estimate ionospheric TEC, these results ofReg-Est using method 1 and method 2 respectively.
instrumental biases should be removed from measurements in XCODErepresentsthe results of CODE analysis center. N is the an appropriate way. In the literature, there is no standard total number of GPSrecordings for 24 hourperiod. InTABLE2
procedure for inclusion of satellite andreceiver bias parameters
computed
TEC differences are listed for various days and in TECestimation. Inthis study,twosatellite and receiver bias stations. Ingeneral, D2
results are smaller when comparedto inclusion methods are tried for Reg-Est. These methods are D3. Thus, including instrumental biases as in Method 1 gives given inthe following equations. In Method 1, the satellite and TEC estimation results closer to CODE analysis center. receiver instrumental biases are used in STEC computation asin Eq. (1) [6],[7],[14].
402
PTOALVKPseudorange
measurementsare morenoisy compared
tocarrier
computation
is difficult because of initialphase ambiguity
andcycle slips.
Third method istousebothpseudorange
andphase
2, ~---I--- I---
---measurements---to--overcomeI---phase
easambiguityveromeande
acycleyandslip
sproblems.
These methodsare discussed in various studies such%
~~~~~~~~~~~~~~as
[5],[7],[9],[IO],[I4].
Previously, only
the absolute TEC was1~~
used as aninput
toReg-Est.
ForIONOLAB,
themeasurement*.. .~~~~~~~~J
input
range isenlarged
to include thephase-corrected
*, .
~~~~~measurements.
Carrierphase
measurements are levelledusing
---I---I---pseudorange---measurements---
--to--eliminatenge
mesuphaseteambiguity.amigut
Thehlevelling
processis based oncomputing
abaseline(B)
for each2
~~~~~~~~~T,, H.1,U~connected
2 arc ofphase
measurements.Then,
thecomputed
Fig.1. Reg-EstTECestimates obtainedby applyingmethod1 and baseline is used inSTECcomputationasinEq.
(10).
method2 bias inclusion methods forPetropavlovsk12.10.2003(quiet
day). n 1 N n(n
L,,i(
Btm= N
ZP~~~~~~~~,4,u
mfme L,mfme)(9)
N
2
~~~~~~~~~~~~1f12f
2D ___n=1 _
(6)
STE f()=2 2[1L4m(nl)+Bm+c(DCBm+DCB)]
(10)1 2 NAjf
n=1
~~~~~~~~~~~Fig.
2provides
anexample
of thecomparison
ofReg-Est
N
2estimates
obtainedusing pseudorange
andcarrier
phase
data. In>
Xi-
XCODEFig.
2.a.,
solid line and dotted line denote estimates obtained___n=1 ___
(7)
using
carrierphase
data andpseudorange
data inReg-Est,
2
N~~~~~
Y,~b
respectively.
InFig.
2.b.,
Reg-Est
estimatesarecompared
withn=1
~~~~~~~~~~the
TEC estimates of IGSanalysis
centers.JPL,
CODE,
N
CD
2ESA/ESOC,
UPC estimates aredisplayed
withdiamond,
Z Xb2 - XCOEsquare, circle and
triangle symbols, respectively.
As can ben=1
(8)
observed fromFig.
2.b.that,
using
eitherpseudorange
orZ
~Xb2
~2carrier
phase
data asinput, Reg-Est produces
consistent TECn=1 estimation results with IGS
analysis
centersespecially
withJPL and CODE.
Therefore,
IONOLAB can use both absolute TECandphase-corrected
TEC asinput.
TABLE2
Reg-EstTECestimation differences obtainedusingdifferent bias inclusion 40AT
methods.
Receiver Station Day D___ D_ D3___ El
Zclcnchukskaya Oct 12, 2003
1.17x1~~~~~~~~~~~~~
2x0-314x0-2~~~~~0-2
Graz Oct 31, 2003 8.71x10 1.73xl0 -2.03xl0
---I---Arti Oct10,2003 6.72xl0 4.2
1x10⁴
a-LL9I 80xLI'
10212
2-2
Petropavlovsk Oct29,2003 1.81X10⁻² 5.98x10⁻³ -4.17x10⁻²
Nanyang Oct12,2003
11.27xl0
5.12xl0 -5.27xl0 ARTct 8,2 003
18
53l743
l2x---0---
---2---Although using
both bias inclusion methods inReg-Est
gives
reasonable TEC
estimates,
bias inclusion Method 1 results are 2 4 Gi i2 i4 0 22closer to IGS
analysis
centers' estimatescompared
to Method2.Sine usiginstumentl biass in TEC coputaton is Fig.2. ComparisonofReg-EstTECestimatesusing pseudorangeand more suitable for the model for GPS observation
equations,
carephsdt,Ati1.0203(utdy)Method 1 will be used in IONOLAB for inclusion of Detailed
comparison
ofpseudorange
andphase
derivedReg-instrumental biases. Est estimates with other
analysis
centers is doneby
computing
normalizedTEC differences as inequations
(11)
given
inTABLE3 for variousdays
and stations. measure for the difference between TECestimates,
theN 2
following
differencesaredefined.ZXpr -Xph 3 n=1 ART~~~~~~~~~~~~~~~~~~~~~~~~~~~~~~3001kF T 1 --T-- -- -I ---- 42 8,3k~ Z r2 ~~ ~~~~~~~~~~~~~~~~~~~~~~2 ---I---I--- ---2 wi 2 7 ~~~~~~~~~~~~~~~~~~~~~~~~~~~~~~~~~~X P h N~~~~~~~~--- N~~~~~~~~
---Ankara Oct 31, 2003 1.75x10⁴ 1,30x10³ 1.93x10³ Xh], Xh2, and Xh3 are the Reg-Est TEC estimation results for21~ 14 130020 2
Gra Oc 1,
00Xph010
3.2x10J3.1x1
Fin.3
e-s Estmtsfr30k,
428.8 kmepcieyand450kin
stettlnmbeKirna=p18 039.81434x0
4.3)112
cnlddta h hieo hionosphericshellri3.020,ngtvlheight, itre doesTABLE3
D8
xh2~~~~~~~~
TBLEITAL3,DissalfraldyansttosthtmnsReg-Est
TECestimation differences withinerespectsetoorionosphericerheight-usoing eiatheisoduag
asy
inutRe-Est
" adhaetee-sestimation resultsEReeierSttin0ay0
aevrclstoecote.CmaiowihJLrslsAnkaraOct 10,2002003l0.2441
0.038Xh1,
h2gienas
Dand3
D60xlare
ct0 relatvely malltherefrelRe-Es
288karan
An Oc31k,
2003ctve0.28
0.044tta umeZestmaenuskareai
gOodareet
with03268l
2h9Xour
TEC estmatsxO o Z rchokskayafoct10
2003ou0.207d
0.032frncs
roJPetoalovkOt31 03Ze7l04le7l0-
.8lO'
sonhokskariuyayOc
28,saton2003 T0.30 0.047TBE , lArti
Oct10,20032.2x
I0'4.53l
02459XI-2
EC ifArtice Octr 10,o 200 0.1620.025Tu,
tanbC.iEffec
ofI 03908I- .3l0- .honospheric
XO2
cncuehieohtteThihSellHigthrteOcg3,t00
014o002Mania Oc27 200 2.38X
054.05l
033.4xlO'
MntshveahosignOfcat
10,f200 0.16 E0.026etiatsusngeq(1.VriaTol
ElcrnCnet(TCaeNnagOct
0.9I-.2l0376xO'
10,2003 Tus nINLB hegto
2.53
0.083b
uedcmueasiEq(2anusnathnselapoiainNanyang
Oct 30,2003 0.3740 0.058O-3.6xO-Eq. (3),EM is the smappin
functionay
and stais thensoaatmellit D.WigtngGS esueent
elevation angle.~ ~~ ~ ~ ~ ~ ~ ~ e-EtTC simto dfeene it esettoinspei hih
uing
SLiMhe
msodel,rinoesphr
ispt
asued-Eto
bestiatolaerulof
Signalsi
frtomaeltso
lowlevtioanlsD
rmr infniesimal thcknsess.eacIonosheric
shellahightwisthe
heghL
osusceptibleato
multipath
effect comparetosinas3ro
maimuma
electroDdrensityanditelismalfunctio
ftm n aeltso1]herefore,RgEs
iheeainage 26itr is31
000.4geogrmaphic
loateion
[4].Vagriousmentwthod
intheu lTEraeturemaves
importnthutokappya ant appropriate20
weghin0roedret
difern
ioopeiJelcincoceLuha.1]4,[]
minimizekthe
mulipth
effctsIn0 some3stdis.masrmet
[11] [14].o Ionos[4],ichosing
diferlengt
ioopei egt a bAiefrom saeltecht are200 belowa0etanelvtinanlrSulatTECTta
dfErencatro2 CoteCU lSEvel Ian
Fig3,mpReg-s
lMitsare
vignrd
Int
[6],a000in1(68
isusdsa0eihtn
estmautesdfor
300Eq.428.k
and450gkmnshl apreximgive
orn
fNctiong
whrecti
the satelit elevtioanl.0I8hi3tuy
Exampleisctenro
InppFig.
3,ifiu
eenhtcEetmtionathreedifferentteliteD.weighting
esueetiosartiefothRg-s
opresultsarei verycltose to eahouoether.dT otinahquteantitatiave imeothod.t
Thespweghtng
apoptiosare wegiveng
below.et1.WeightingFunction: ANKARA F==71
0,
e,,,~~~L(n).1IO' Wlm(n)
{exp(-(90-
m(f))2n/2
IO') <£(n)60.(),(16)
<60
<nm(n)<90
i
-X
2 . W e i g h ti n g F u n c ti o n : 2D---'---'---/~~r~~~~~~~I---I--- --- ---I---2.WeightingFunction:p0,
e,,(n)
<I0° 1(
.O.
w2m(n)
=exp(-(60-£m(n))
/2j
2I)O <em (n)<60 (17)llX
~~~~~~60'
<£m,
(n)
<90'2 4 6 10 12 14 16 is 20 22 24
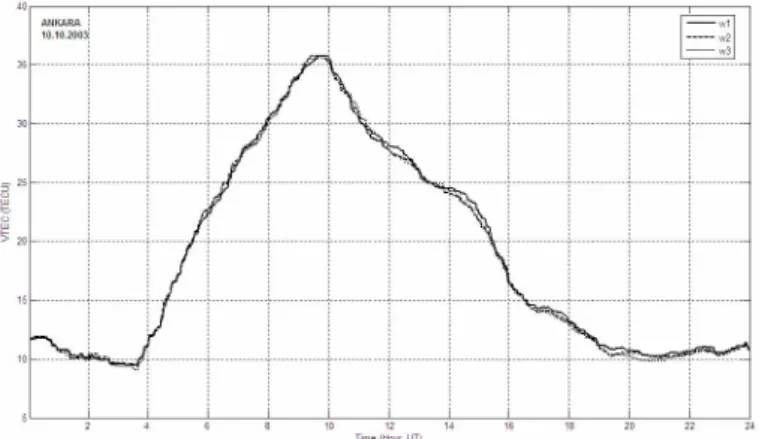
Fig.4. Reg-Est TEC estimates obtainedwl,w2and w3 weighting
3. Weighting Function: functionsfor Ankara
10.10.2003.
w3m(n)
=sin2(Em (n))
(18) TABLE 5Reg-EstTECestimation differences withrespect toweighting functionswl,
The first weighting function is the one that is used w2 andw3.
previously in Reg-Est. This function ignores the measurements Receiver Station Da 9
below 100 elevation angle. The measurements between 100 and Ankara Oct 10, 2003 9.51x10⁻⁵ 2.34x10⁻⁴ 3.06x10⁻⁴
600 areweighted usinga Gaussian function which hasa mean Ankara Oct
31,
20031.20xl
0-4 2.34x10⁻⁴ 3.3 Ix10-4 at 900. The measurements above 600 are directly used. The Zelenchukskaya Oct 10, 2003 8.69x10⁻⁵ 4.03x10⁻⁴ 4.34x10⁻⁴second weighting function is similar to first one except the Zelenchukskaya Oct28, 2003 5.14x10⁻⁵ 1.92x10⁻⁴ 1.68x10⁻⁴
gaussian function has a mean at 600. The third weighting Arti Oct 10, 2003 7.77x10⁵ 4.09x10⁴ 3.42x10⁴
function is theonethat is used in [6]. These weighting options Arti Oct 31,2003 2.67x10⁻⁴ 8.72x10⁻⁴ 8.36x10⁻⁴
are tried in Reg-Est method for various days and receiver Metsahovi Oct 10,2003 1.53x10⁻⁴ 5.06x10⁻⁴ 5.95x10⁻⁴ stations that arelisted in TABLE 1. An example is provided in Metsahovi Oct28,2003 1.62x10⁻⁴ 3.04x10⁻⁴ 5.20x10⁻⁴
Fig.4and TEC estimates for Ankara 10.10.2003 using wl, w2 Nanyang Oct10,2003 1.71x10⁻⁴ 7.39x10⁻⁴ 9.41x10⁻⁴ andw3 aregiven. InFig. 4, the estimates obtained by w2 and Nanyang Oct 30,2003 2.78x10⁻⁴ 6.98x10⁻⁴
1.40xIO-'
w3 weighting functions are close to each other. These two
functionsprovide smooth transitions in time compared to those III. CONCLUSION
ofwl. In order to examine the TEC estimates in detail, the
Reg-Est,
developed in[1], [2],
and[3],
is a highfollowing normalized difference functions are defined. The resolution, robust TEC estimation technique. In this paper, the
normalized differences obtained using these three difference use of satellite and receiver biases, the effects ofionospheric
functionsaregiven inTABLE5 forsomestations and days as an shell height and the choice of weighting functions are
example. investigated for further improvement of Reg-Est. Although
D_ N X
X2(
there is no standard way ofusing
satellite and receiverD9--E
2i(9)
instrumentalbiases
in theliterature,
two methods foradding
N n=1 |Xw2 these biases is appliedand theresults are comparedwith IGS
analysis centers. The results are consistent with IGS centers
2 especiallywith JPL and CODE. The method which estimates
w2-
20
TEC closest toIONEX estimatesfor the
usethe
instrumental
D -N < 2
(20)
biases is selected forIONOLAB.
Inprevious studies ofReg-n=1 lXw2 Est, only pseudo-rangemeasurement were used as input to the
N2 regularization algorithm. In this paper, phase measurements are
1 Xw3-Xwl used in Reg-Est method with an
appropriate
leveling
DI=-E
2(21)
technique.
The TEC estimation results are very close to theN n=1
|Xw2
results ofpseudorange measurements but TEC estimates fromphase-leveledmeasurements arelessnoisy.
In TABLE 5,
Dg
values are smaller thanD1o
andD1,
Ionospheric
shell heightis a parameter used in Reg-which shows thatTECestimation results of w2 andw3 are in Est. In thispaper, differentionospheric height
valuesareused relatively better accordance for all stations compared to results in Reg-Est method and the TEC estimates are compared. It is of wi. Since w2 provides smooth transitions and reduces observed that the Reg-Est method is nearly independent ofthe sudden irregularities in TEC estimates, w2 can be used in choice of ionospheric height. Weighting function helps toIONOLAB. reduce the multipath effect in the measurements of satellites
which are at low elevation angles. Three different weighting
options are tried and theweighting function which reduces the non-ionospheric effects best is selected for IONOLAB. It is also shown that the TEC estimation results ofIONOLAB is consistent with IGSanalysis centersespecially withCODEand
JPL.
-ACKNOWLEDGMENT
This study issupported byTUBITAK EEEAG grant no: 105E171.
REFERENCES
[1] Arikan, F., Erol, C.B., Arikan, O., "Regularized Estimation of Vertical
Total Electron Contentfrom Global Positioning System Data",Journal of GeophysicalResearch, (1 18) 1469-1480,2003.
[2] Arikan, F., Erol, C.B., Arikan, O., "Regularized Estimation of Vertical Total ElectronContentfromGPS DataforaDesired TimePeriod", Radio Science, 39:RS6012,2004
[3] Arikan,F.,Erol,C.B.,Arikan, O.,"Regularized Estimation ofTECfrom
GPS Data for Certain Midlatitude Stations and Comparisons with IRI Model", J. Adv. Space Res.,doi:10.1016/j.asr.2007.01.082,2007.
[4] A. Komjathy., R.B.Langley, "Anassessmentofpredicted and measured ionospheric total electron contentusing a regional GPSNetwork, ION
National TechnicalMeeting",SantaMonica, CA,22-24January 1996.
[5] E. Calais.,B.Minster, "GPS, earthquakes, the ionosphere and thespace
shuttle", Physics of the Earth and Planetary Interiors, ION National Technical Meeting,105, 167-171, 1998.
[6] G. Ma, T.Maruyama,"Derivation ofTECand estimation of instrumental biases fromGEONET inJapan", AnnalesGeophysicae, (21) 2083-2093,
2003.
[7] G. E. Lanyi, T. Roth, "A comparison of mapped and measured total ionospheric electroncontentusing Global PositioningSystemand beacon satelliteobservations", Radio Sci., 23, 483-492,1998.
[8] Ionospheric DispatchCenter.http:!!wwwcbkwawpl/rwc/ d daysctl [9] N. Jakowski., "Generation ofTEC maps over COST251 areabased on
GPSmeasurements",Proc.of the 2ndCOST 251Workshop, Side,30-31
March,51-57, 1998.
[10]R.Warnant, Reliability of theTECcomputed usingGPS measurements:
The problem of hardware biases, Acta Geod. Geoph. Hung., 32 (3-4),
451-459, 1997
[11]S. Schaer, "Mapping and Predicting the Earth's Ionosphere Using the GlobalPositioning System", Ph.D.thesis, University of Bern, Bern,1999.
[12]TEC mapsofIGSanalysiscentersin lonexformat. ftp://cddisa.gsf.nasa.gov/gps/products/ione
[13]X. Liao, "Carrier phase based ionosphererecovery over aregional area GPSnetwork", M.S.Thesis, University of Calgary, Calgary,2000.
[14]Y.Otsuka, T.Ogawa,A. Saito,T.Tsugawa, S.Fukao,S.Miyazaki,"A newtechnique formapping of total electroncontentusing GPSnetwork
inJapan", Earth PlanetsSpace,(54) 63-70,2002.
![TABLE 1 STECm (n) 12 2 [P4,u (n)] (4)](https://thumb-eu.123doks.com/thumbv2/9libnet/5768781.116909/2.892.459.798.114.276/table-stecm-n-p-u-n.webp)