ADSORPTIVE CATHODIC STRIPPING VOLTAMMETRIC
DETERMINATION OF ANTIMONY IN THE PRESENCE OF
COPPER AND BISMUTH BY USING HEMATOXYLIN
İbrahim Şahin1 and Nuri Nakiboglu2,*1 Chemistry Education Division, Necatibey Education Faculty, Balıkesir University, 10100 Balıkesir, Turkey 2 Chemistry Department, Sciences and Arts Faculty, Balıkesir University, 10145 Balıkesir, Turkey
ABSTRACT
This study describes a new adsorptive cathodic strip-ping voltammetric method using hematoxylin as complex-ing reagent for determination of antimony in the presence of Cu(II) and Bi(III). The method is based on the accumu-lation of Sb(III)-hematoxylin complex onto a hanging mer-cury drop electrode (HMDE), and reduction of the antimony in the adsorbed complex by using square wave cathodic stripping voltammetry. The effects of chemical (pH, sup-porting electrolyte, concentration of hematoxylin) and instrumental (accumulation potential, accumulation time, stripping mode and scan rate) parameters on the measured current as response are discussed. The linear relationship was obtained in the concentration range of 2.7-80 µg L-1
(r = 0.998, n = 10). The detection (3s) and the quantification (10s) limits were estimated to be 0.8 µg L-1 and 2.7 µg L-1,
respectively. The method was applied to determination of Sb(III) in water samples.
KEYWORDS: Antimony, hematoxylin, adsorptive cathodic
strip-ping voltammetry, water
1. INTRODUCTION
Antimony is a natural element and used in various in-dustrial fields. The Agency for Toxicological Substances and Diseases Registry (ATSDR) in the United States accepted that antimony and its compounds are pollutants (http://www.atsdr.cdc.gov/mrls.html). The antimony value in drinking water is recommended to be 0.02 mg/L by The World Health Organisation [1] Therefore, accurate determination of antimony is important in various sam-ples and matrices.
Antimony has been determined using many methods in various matrices. Among these, hydride generation atomic absorption spectrometry (HGAAS) [2] and inductively
* Corresponding author
coupled plasma optical emission spectrometry (ICP OES) have been favoured to minimize the problems associated with matrix interferences for the determination of anti-mony at trace and ultra-trace levels. Advantages and dis-advantages of these techniques have been discussed in the literature [3]. Additionally, review articles including ana-lytical methods for the speciation and determination of antimony are available [4-7]. On the other hand, a variety of electroanalytical methods, such as anodic stripping ammetry (ASV) [8-11], adsorptive cathodic stripping volt-ammetry (AdCSV) [12-14], and adsorptive anodic strip-ping voltammetry (AdASV) [15], have also been used for determination of Sb(III) in various samples. Sb(III) is pre-concentrated in acidic medium as Sb(0) at the electrode for a particular time period, and subsequently oxidized to Sb(III) in ASV methods. Morin [12], chloranilic acid [13], pyrogallol [14] and alizarin red s [15] have been used as complexing agents in AdSV determination of Sb(III). The detailed information about electroanalytical determination of antimony can be found in the review reported by Toghill et al. [16]. Generally, the main interfering ions in voltammetric determination of Sb(III) are Cu(II), Bi(III) and As(III). Therefore, alternative voltammetric procedures, free from these interferences, are needed.
Hematoxylin (HMT,) widely used in the field of his-tology and pathology as a staining agent, is a natural compound obtained by extraction from the logwood tree, Haematoxylon campechianum [17]. The interactions be-tween HMT and various metal ions, such as aluminum (III), chromium (III), iron (III), copper (II), lead (II), nickel (II), osmium (III) and tin (II), have been known. These com-plex compounds have a variety of colours, depending on the metal ions (http://stainsfile.info/ StainsFile/stain/ hema-toxylin /hxintro.htm). There are few reports for develop-ing new analytical methods usdevelop-ing HMT. One of these, reported by Niazi et al. [18], is a spectrophotometric method using HMT as complexing agent for simultaneous determi-nation of Al(III) and Fe(III). The other one is a voltam-metric method using a HMT modified carbon paste elec-trode for determination of nicotinamide adenine dinucleo-tide (NADH) [19]. However, there is no study using HMT
as complexing agent for the determination of Sb (III) and other metal ions by voltammetry.
The aim of the study is to develop an alternative method, free from interference of common ions, using a new complexing agent for the determination of Sb (III) by adsorptive stripping voltammetry.
2. MATERIALS AND METHODS
2.1 Equipments and chemicals
A Radiometer Pol 150 Polarographic Analyzer con-nected with a Radiometer MDE 150 polarographic stand were used in voltammetric measurements. A combination consisting of a hanging mercury drop electrode (HMDE), Ag/AgCl (satd. KCl) reference electrode (Radiometer, B18C003) and platinum wire auxiliary electrode (Radi-ometer) were used as a three-electrode system. Hexa-distilled mercury (Radiometer-Copenhagen) was employed for HMDE. Measurements of pH were carried out using a WTW pH-meter with combined glass electrode. Standard buffer solutions were used for adjusting the meter prior to meas-urements. Titrisol ampoules were purchased from Merck for antimony and the other metal ions (1000 mgL-1). HMT
(Fig. 1) was obtained from Merck and used without puri-fication. The other chemicals used throughout the study were of analytical grade. All of the solutions were pre-pared daily. Deionized water (18.2 MΩ) was obtained from an Sartorius Arium 611 ultrapure water purification system, and used for preparing all of the solutions
FIGURE 1 - Structure of HMT 2.2 Procedure
If not otherwise stated, the required aliquots of Sb(III) stock solution (or water sample), 1 × 10⁻⁴ mol L-1 HMT,
and 1 mol L-1 acetic acid-phosphoric acid mixture (pH 5)
were transferred into a 10-ml volumetric flask, and the volume was completed with deionized water. Then, the solution was decanted to a voltammetric cell and purged with nitrogen for 5 min. Accumulation at a new mercury drop was carried out with stirring the solution at a deposi-tion potential of - 600 mV for 120 s. After a waiting time for 10 s, the potential was scanned from -200 mV toward the cathodic direction by using square wave (SW) modu-lation. Step duration, step amplitude and pulse amplitude were 0.04 s, 2 mV, and -25 mV, respectively. Measure-ments were carried out at room temperature.
3. RESULTS AND DISCUSSION
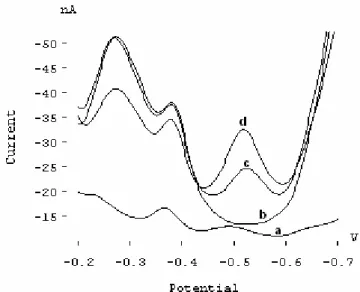
Figure 2 displays the SW voltammograms of 8.2 × 10⁻⁸ mol L-1 Sb(III) in the absence of HMT (curve a), 1 ×
10-6 mol L-1 HMT in the absence of Sb(III) (curve b), and
the mixture of 8.2 × 10⁻⁸ mol L-1 Sb(III) and 1 × 10⁻⁶ mol
L-1 HMT (curve c) in acetic acid-phosphoric acid mixture
(pH 5), after 120 s of accumulation time at -0.600 V. Comparison of the voltammograms shows that a new peak appears at -0.520 V when Sb(III) is added to the solution containing HMT, which gives us an idea about the formation of Sb(III)-HMT complex in the solution. The peak current proportionally increases with the Sb(III) concentration (curve d). Cyclic voltammograms obtained affirm that the electrochemical reduction process of the antimony in the complex is irreversible. Additionally, logI-logv plot was drawn (see Fig. 3) using the data obtained from cyclic voltammograms recorded for 10, 20, 50, 100 and 200 mV/s scan rates (not shown herein). The slope of the linear graph is 0.9243, and this value is very close to 1 suggesting the adsorption process.
FIGURE 2 - SW voltammograms obtained in acetic acid-phosphoric
acid mixture at pH 5: (a) 10 µg L-1 Sb (III) in the absence of HMT, (b)
1×10⁻⁶ mol L-1 HMT in the absence of Sb (III), (c) 10 µg L-1 Sb(III) in
the presence of 1 × 10⁻⁶ mol L-1 HMT, and (d) c +10 µg L-1 Sb (III).
Other conditions: Eac=-600 mV, tac = 120 s, scan rate = 50 mV/s.
FIGURE 3 - LogI-logv plot for 10, 20, 50, 100 and 200 mV/s scan rates.
Preliminary experiments were performed for pH 4, 7 and 9 by using acetate, phosphate and ammonia buffers, respectively. Our previous studies indicated that boron can form a stable complex with polyhydroxy compounds, such as HMT. For this reason, Britton Robinson buffer was not preferred for avoiding complex formation be-tween boron and HMT. The peak of Sb(III)-HMT com-plex overlaps with the free HMT, due to the competitive adsorption, at higher pHs more than pH 7, deteriorating the peak resolution. Therefore, further pH experiments were planned in neutral and acidic medium. The pH of the solution containing Sb(III)-HMT complex was varied in the range of 3.0 and 7.0 for examining the effect of pH on the peak current. No signal related to the complex was obtained below pH 3.0. The peak current gradually in-creases with pH and reaches a maximum value at pH 5.0, but then decreases (Fig. 4). Therefore, pH 5.0 was preferred as optimum. Additionally, sodium acetate, ammonium acetate and sodium acetate-phosphate mixture at pH 5 were tested, and a slightly high peak current was obtained in the case of acetate-phosphate mixture. The peak potential of both the free HMT and Sb(III)-HMT complex shifted linearly to negative values as the pH increases. A linear relationship between peak potential and pH for Sb(III)-HMT complex was observed (Ep = - 92, pH 5, R2 = 0.9914).
FIGURE 4 - The variation of complex peak current with pH (Condi-tions: CSb(III): 20 µg L-1, CHMT: 1 × 10⁻⁶ mol L-1, tacc = 120 s, Eacc = -600 mV, pH 5, pulse amplitude: - 25 mV, scan rate: 50 mV/s).
The concentration of HMT is the other important so-lution parameter with respect to both complex formation degree and competitive adsorption on the electrode sur-face. For this reason, the effect of HMT concentration was studied. The peak current of Sb(III)-HMT complex rapidly increases with concentration of HMT up to 1 × 10⁻⁶
mol L-1 (not shown herein), and then, remains almost
con-stant in the higher concentrations more than 1 × 10⁻⁶ mol
L-1. Therefore, this concentration was selected for
subse-quent measurements.
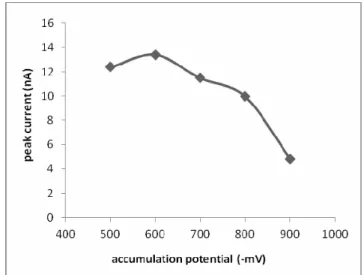
The accumulation potential, accumulation time, strip-ping mode and scan rate are the important instrumental parameters affecting the peak current and, hence, sensitiv-ity of the method. Figure 5 shows the effect of accumula-tion potential on the peak current of the Sb - HMT com-plex. Both the free HMT and the Sb(III) - HMT complex
peaks overlap at the potentials more positive than - 500 mV and more negative than - 900 mV resulting in bad peak resolution and low sensitivity. The peak current was maxi-mum at - 600 mV, then decreased at more negative poten-tials because of competitive adsorption of the free ligand and the complex at the electrode surface.
FIGURE 5 - The variation of complex peak current with accumula-tion potential (Condiaccumula-tions: CSb(III): 10 µg L-1, CHMT:1 × 10⁻⁶ mol L-1, pH 5, pulse amplitude:- 25 mV, scan rate: 50 mV/s).
The dependence of the peak current on the accumula-tion time, tac, is presented in Fig. 6. The peak current
in-creases with the accumulation time up to 120 s, and then, slightly decreases for longer accumulation times. This is attributed to both saturation of the electrode surface and competitive adsorption of free HMT and Sb (III)-HMT complex on the electrode surface.
FIGURE 6 - The variation of complex peak current with
accumula-tion time (Condiaccumula-tions: CSb(III): 10 µg L-1, CHMT :1 × 10⁻⁶ mol L-1,
pH 5, Eacc = - 600 mV, pulse amplitude: - 25 mV, scan rate: 50
mV/s).
The effect of the stripping modulation was investi-gated by using differential pulse and square wave (SW) potential scanning. SW modulation was chosen taking into account the highest peak current and the speed of the measurements. Additionally, the influences of scan rate on the peak current were studied while the other selected optimum conditions were kept constant. Scan rate was
varied from 10 to 50 mV/s. The results showed that the peak current increased by increasing scan rate; therefore, 50 mV/s was selected.
3.1 Validation and application of the method
As a result of the studies above, the optimum condi-tions for determination of antimony in the presence of HMT are as follows:
Supporting electrolyte and pH: acetic acid-phosphoric acid mixture and 5.0; concentration of HMT: 1 × 10⁻⁶ mol
L-1; accumulation potential: - 600 mV; accumulation time:
120 s; stripping mode: SW; scan rate: 50 mV/s.
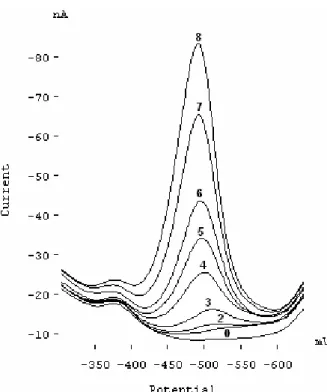
Figure 7 shows some voltammograms used for draw-ing the calibration curve. The linear relationship was ob-tained in the concentration range of 2.7 - 80 µg L-1 (22 -
657 nmol L-1). The regression line equation (r = 0.998, n
= 10) is Ip = 0.954 (±0.029) CSb + 7.570 (± 1.054) where
Ip is the peak current (in nA) and CSb is the concentration
of Sb(III) (in µg L-1). The standard error of slope and
intercept of the regression line are given in paranthesis. The estimated limit of detection (3s) and the limit of quanti-fication (10s) based on the standard deviation of blank data (n = 7) were 0.8 µg L-1 (6.6 × 10⁻⁹ mol L-1) and, 2.7 µg L-1
(2.2 × 10⁻⁸ mol L-1), respectively. The relative standard
de-viation for 5 µg L-1 Sb (III) (n = 9) was calculated as 3.2 %.
FIGURE 7- SW voltammograms of various concentration of
anti-mony; (0) 1 × 10⁻⁶ mol L-1 HMT in acetic acid-phosphoric acid
mix-ture (pH 5), (1) (0) + 3 µg L-1 Sb (III), (2) (0) + 5 µg L-1 Sb (III), (3)
(0) + 10 µg L-1 Sb (III), (4) (0) + 20 µg L-1 Sb (III), (5) (0) + 30 µg L-1
Sb (III), (6) (0) + 40 µg L-1 Sb (III), (7) (0) + 60 µg L-1 Sb (III), and
(8) (0) + 80 µg L-1 Sb (III).
The influence of various ions on the determinations of antimony was investigated in the presence of 20 µg L-1
of Sb (III). ± 5 % changing in the peak current was taken
into account as interference criterion. The results showed that B(III), Bi(III), Cr(III) and Cu(II) did not affect the peak current. The obtained voltammograms in the absence and presence of Cu(II) and Bi(III) are given in Fig. 8. The peak current and the peak potential remain almost con-stant in the presence of 1800 µg L-1 of Cu(II) and Bi(III)
suggesting the selectivity of the proposed method in point of these ions (Fig. 8). Additionaly, 30-fold Al(III), 10-fold Co(II) and 10-fold Ni(II) did not interfere but 2-fold Fe(III), Pb(II) and Zn(II) decreased the peak current while Cd(II) increased the signal because of overlapping its peak with the signal. EDTA (2 × 10⁻³ mol L-1) was added
to the sample solution for eliminating the interference of the Cd(II), Fe(III), Pb(II) and Zn(II) ions.
FIGURE 8 - SW voltammograms obtained in the absence and
pres-ence of Cu(II) and Bi(III) ions: (a) 1 × 10⁻⁶ mol L-1 HMT in acetic
acid-phosphoric acid mixture (pH 5) and 30 µg L-1 Sb(III), (b) a + 30
µg L-1 Cu(II) and 30 µg L-1 Bi(III), and (c) a + 1800 µg L-1 Cu(II) and
1800 µg L-1 Bi(III)).
FIGURE 9 - Standard addition voltammograms for fortified
drink-ing water sample: (a) 1 × 10⁻⁶ mol L-1 HMT in acetic acid-phosphoric
acid mixture (pH 5), (b) water sample spiked with 20 µg L-1 Sb(III),
(c). b + 10 µg L-1 Sb(III), (d) b + 20 µg L-1 Sb(III), and (e) b + 30 µg L-1 Sb(III)).
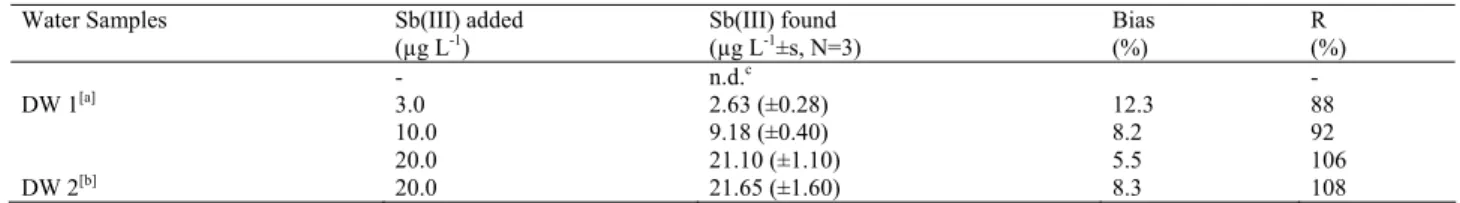
TABLE 1 - The obtained results in water samples spiked with Sb(III).
Water Samples Sb(III) added
(µg L-1) Sb(III) found (µg L-1±s, N=3) Bias (%) R (%)
DW 1[a] - 3.0 10.0 n.d.c 2.63 (±0.28) 9.18 (±0.40) 12.3 8.2 - 88 92 DW 2[b] 20.0 20.0 21.10 (±1.10) 21.65 (±1.60) 5.5 8.3 106 108
[a] DW 1: Drinking water; [b] DW 2: Drinking water fortified with 50 µg L-1 Cu(II), Bi(III), Co(II), Zn(II), Pb(II), Fe(III), Cr(III), Mn(II), Ni(II),
Mo(VI), Hg(II), Al(III), Se(IV) and 500 µg L-1 Na(I), K(I), Ca(II), Mg(II); [c] n.d. = not detected.
The proposed method was applied to the drinking wa-ter and fortified drinking wawa-ter samples. Standard addi-tion voltammograms obtained for the fortified drinking water sample are shown in Fig. 9. The accuracy check of the method in water samples was characterized by the use of recovery tests, and the results obtained were summa-rized in Table 1.
4. CONCLUSIONS
A new, selective, sensitive and accurate voltammetric method for the determination of Sb(III) in the presence of HMT was described. As far as we know, this is the first time that HMT is used in voltammetry for the determina-tion of a cadetermina-tion. The method has advantages over some existing voltammetric methods [9, 12, 15] as it is free from the interference of Cu(II) and Bi(III). The method can be used with satisfactory results for the trace determi-nation of Sb(III) in water samples, and is particularly recommended for the samples containing Cu(II) and Bi(III).
ACKNOWLEDGEMENTS
This study was carried out in the laboratory of Balıke-sir University Research Center of Applied Sciences. The authors would like to thank the Research Project Division of Balıkesir University (contract no: 2008/29) for financial support.
The authors have declared no conflict of interes.t
REFERENCES
[1] WHO, Guidelines for drinking water quality, 4th ed., Swit-zerland, 2011, 314.
[2] Lorenzini, G. (2002) Trace elements in vegetables grown in an area exposed to the emissions of geothermal power plants. Fresenius Environmental Bulletin 11(3), 137-142.
[3] Yersel, M., Erdem, A., Eroğlu, A.E. and Shahwan, T. (2005) Separation of trace antimony and arsenic prior to hydride generation atomic absorption spectrometric determination Anal. Chim. Acta. 534, 293-300.
[4] Smichowski, P. (2008) Antimony in the environment as a global pollutant: a review on analytical methodologies for its determination in atmospheric aerosols. Talanta, 75, 2-14. [5] Krachler, M., Emons, H. and Zheng, J. (2001) Speciation of
antimony for the 21st century: promises and pitfalls. Trends in Analytical Chemistry 20(2), 79-90.
[6] Filella, M., Belzile, N. and Chen, Y.W. (2002) Antimony in the environment: a review focused on natural waters I. Oc-currence.. Earth-Science Reviews 57, 125–176.
[7] Filella, M., Belzile, N. and Chen, Y.W. (2002) Antimony in the environment: a review focused on natural waters II. Rele-vant solution chemistry. Earth-Science Reviews 59, 265-285. [8] Quentel, F. and Filella, M. (2002) Determination of inorganic
antimony species in seawater by differential pulse anodic stripping voltammetry: stability of the trivalent state Anal. Chim. Acta 452, 237-244.
[9] Bond, A. M., Kratsis S., Micheal O. and Newman G. (1998) Combined use of differential pulse adsorptive and anodic stripping techniques for the determination of antimony(III) and antimony(V) in zinc electrolyte. Anal. Chim. Acta 372, 307-314.
[10] Woolever, C A., Starkey, D. E. and Dewald, H. D. (1999) Differential pulse anodic stripping voltammetry of lead and antimony in gunshot residues. Foren. Sci. Inter. 102, 45-50. [11] Locatelli, C. and Torsi G. (2003) Analytical procedures for
the simultaneous voltammetric determination of heavy metals in meals. Microchemical Journal 75, 233-240.
[12] Zhou C., Lu, Y., Li, X., Luo C., Zhang, Z. and You J. (1998) Adsorptive stripping voltammetric determination of anti-mony. Talanta 46, 1531-1536.
[13] Sander, S. (1999) Simultaneous adsorptive stripping voltam-metric determination of molybdenum(VI), uranium(VI), va-nadium(V), and antimony(III). Anal. Chim. Acta 394, 81-89. [14] Gonzalez, M. J.G., O.D. Renedo, M. J. A. Martinez. (2007)
Speciation of antimony by adsorptive stripping voltammetry using pyrogallol. Talanta 71, 691-698.
[15] Nakiboglu, N., Sahin, I. and Ertas, F.N. (2008) Adsorptive Stripping Voltammetric Determination of Antimony by Us-ing Alizarin Red S. Analytical Letters 41(14), 2621-2633. [16] Toghill, K.E., Lu, M. and Compton, R. G. (2011)
Electroana-lytical determination of antimony. Int. J. Electrochem. Sci. 6, 3057-3076.
[17] Titford, M. (2005) The long history of hematoxylin. Biotech-nic and Histochemistry 80(2), 73-78.
[18] Niazi, A., Zolgharnein, J. and Davoodabadi, M. R. (2007) Simultaneous Determination of Aluminium and Iron with Hematoxylin Using Spectrophotometric and Orthogonal Sig-nal Correction-Partial Least Squares in Plant and Water. An-nali Di Chimica 97, 1181-1190.
[19] Zare, H.R., Nasirizadeh, N., Ardakani, M.M. and Namazian, M. (2006) Electrochemical properties and electrocatalytic ac-tivity of hematoxylin modified carbon paste electrode toward the oxidation of reduced nicotinamide adenine dinucleotide (NADH). Sensors and Actuators B 120, 288-294.
Received: January 30, 2014 Accepted: March 27, 2014
CORRESPONDING AUTHOR Nuri Nakiboglu
Balıkesir University Science and Art Faculty Chemistry Department 10145 Balıkesir TURKEY Phone: ++90 0266 612 10 00 Fax: ++90 0266 612 12 15 E-mail: [email protected]