596 / C L l O 2 0 0 1 /
TUESDAYAFTERNOON
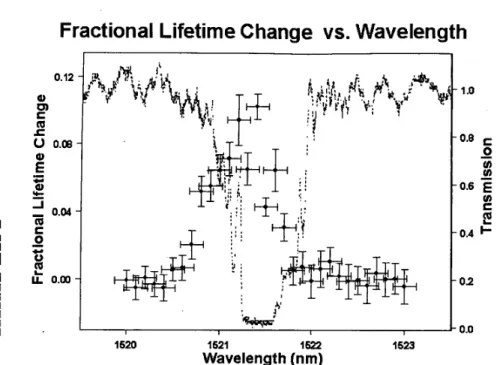
Fractional Lifetime Change vs. Wavelength
0.12 Q)ul
r
m
c
0
0.w YE"
c U- Q)-
i
0.04m
c
0 0m
-
*
k
0.00 I I I I I 1620 1521 1622 1523Wavelength (nm)
1.o
0.8 0 U1 v) 0.6E
v)c
0.4 I--
E
0 2 0.0 m C 3 bium doped FBG.Fig. 2. Dots: Fractional lifetime change vs. wavelength Dash normalized transmission for Er-
tronics': Phys. Rev. Lett. 58, 2059-2062 (1987).
R. Lee, Y. Xu and A. Yariv, "Modified sponta- neous emission from a two-dimensional photonic bandgap crystal slab, J. Opt. Soc.
Am. B, 17, 1438-1442 (2000).
J. Martorell and N.M. Lawandy, "Observa- tion of Inhibited Spontaneous Emission.in a periodic Dielectric Structure': Phys. Rev.
K. Tanaka, T Nakamura, W. Takamatsu, M. Yamanishi,Y. Lee and T. Ishihara,"Cavity-In- duced Changes of Spontaneous Emission Lifetime in a One-Dimensional Semicon- ductor Microcavities", Phys. Rev. Lett. 74,
3380-3383 (1995). 4. 5. Lett. 65,1877-1880 (1990). 6 . JTuC4/3:15 pm
Photonic band gap effect and localization in twdimensional Penrose lattice
Mehmet Bayindir, E. Cubukcu, I. Bulu, and E. Ozbay, Department of Physics, Bilkent University, Bilkent, 06533 Ankara, Turkey; EmaiZ: bayindirqen. biZkent.edu. tr
Photonic crystals are artificial periodic structures in which the refractive 'index modulation gives rise to stop bands for electromagnetic waves (EM) within a certain frequency range in all di- rections.' Recently it was recognized that the photonic gaps can exist in two-dimensional (2D) octagonal quasicrystals.* A quasiperiodic system is characterized by a lack of long range periodic translational order. But the quasiperiodic system has long-range band orientational order, so that it can be considered as an intermediate between pe- riodic and random systems.'
In this work, we report on observation of the photonic band gap effect in a 2D Penrose qua- sicrystal consisting of dielectric rods. Defect char-
0
-
-20 0._
m'I
Be
-40 c -macteristics of various inequivalent sites of the crystal were investigated. The Penrose tiles are composed of fat and skinny rhombic unit cells and fill the 2D plane nonperiodically as illus-
trated in Fig. 1. The 2D Penrose lattice was con- structed by placing square shaped alumina rods, having refractive index 3.1 at the microwave fre- quencies and dimensions 0.32 cm x 0.32 cm x
15.25 cm, at each vertices of the skinny and fat
rhombic cells (Fig. 1). The side of each rhombus is a = 1.2 cm. The experimental set-up consists of a HP 8510C network analyzer and microwave horn antennas to measure the transmission-am- plitude spectrum. The electric field polarization vector of the incident EM field was parallel to the rods.
We first performed transmission measure- ments through the perfect Penrose crystal by varying angle of incidence of the EM waves (see the inset in Fig. 2). The crystal consisted of 236
7 9 11 13
--
Frequency (GAZ)
JTuC4 Fig. 2. Transmission characteristics of a Penrose dielectric crystal for various incidence angles. A stop band extending from 9.9 to 13.2 GHz was observed irrespective of the incidence angle. Inset: The ( 0 ) symbols denoted vertices of the Penrose lattice.
rods, and had a square shape with dimensions 13 cm x 13 cm. As shown in Fig. 2, there is a strong attenuation, around 50 dB, in transmissiorl of EM wave through the crystal. The photonic band gap extends from 9.9 to 13.2 GHz. The same photonic band gap spectra were observed for different val- ues of incidence angle between 0" and 90". We performed the measurements up to 40 GHz, and we did not observe any other gaps in the trans- mission spectrum.
The defect characteristics of quasiperiodic photonic crystals can be different from the peri- odic case as pointed out in Ref. 2. Localization properties of the defect modes in quasicrystals depend on the position of the removed rotcl, since local environment of each site can be different from other sites. Therefore, we can get different defect frequencies within the band gap by remov- ing rods from various positions. This feature might be important for certain applications. To demonstrate the localization phenomena in qua- sicrystals, we measured the transmission spec- trum through a Penrose crystal, which consisted of 98 rods, with a single rod removed defect as la- beled in the inset of Fig. 3. Each defect has differ- ent local properties, i.e., number and ai-range-
JTuC4 Fig. 1. Schematic drawing of a two-di- mensional Penrose photonic crystal. The dielec- tric rods are placed at all vertices of fat and skinny rhombic cells.
1 9 11
N
13
Frequency (GHz)
JTuC4 Fig. 3. Defect characteristics of a Pen- rose crystal consisting of 98 dielectric rods ob- tained by removing a single rod from various lo- cations. Highly localized defect modes were observed. Since the crystal has many inequivalent defect sites, we can change the defect frequency within the stop band. The inset shows location of
the defects. Here, the point B is positioned at the center of the crystal.
TUESDAY AFTERNOON
/
CLlO 2001/
597ment of neighboring rods. As shown in Fig. 3, we observed strongly localized cavity modes within the stop band of the crystal. The corresponding defect frequencies were fA = 11.436 GHz, f B =
11.301 GHz, and fc = 10.679 GHz. The quality
factors, defined as center frequency divided by the peak’s full width at half-maximum, of these cavi- ties were measured to be QA = 817, Q B = 513, and
Qc = 305.
In conclusion, we have experimentally ob- served that the EM waves can not propagate within a certain frequency range through a 2D quasicrystal that was composed of the Penrose tiling of dielectric rods. It was demonstrated that by removing a single rod from an otherwise per- fect Penrose lattice, we could create a highly lo- calized cavity mode. Since the crystal had many inequivalent sites, we achieved different defect frequencies within the photonic band gap!
This work was supported by NATO Grant No. Sfp971970, National Science Foundation Grant No. INT-9820646, Turkish Department of De- fense Grant No. KOBRA-001 and Thales JP8.04.
References
1. J.D. Joannopoulos, R.D. Meade, and J.N. Winn, Photonic Crystals: Molding the Flow of Light (Princeton University Press, Princeton,
NJ, 1995).
Y.S. Chan, C.T. Chan, andZ.Y. Liu, Phys. Rev. Lett. 80, 956 (1998).; C. Jin, B. Cheng, B. Man, Z. Li, and D. Zhang, Appl. Phys. Lett. 75,1848 (1999).
P.J. Steinhardt and S . Ostlund, The Physics of Quasicrystals (World Scientific, Singapore,
1987).
Mehmet Bayindir, E. Cubukcu, I. Bulu, and
E. Ozbay, Submitted to Phys. Rev. Lett. (Oc- tober 2000).
2.
3.
4.
JTuC5 3:30 pm
Optical measurement of trapped acoustic mode at defect In squarelattice photonic crystal Rber preform
E. Marin, A. Diez” and P. St. J. Russell,
Optoelectronics Group, Department of Physics, University ofBath, Claverton Down, Bath BA2 7Ak; U.K.; Email: [email protected]
1. Introduction
Photonic crystal fibers (PCFs) were first demon- strated in 1996.’ They are all-silica fibers in which the cladding consists of a two-dimensional array of microscopic air holes running along their length. The central hole of the structure is miss- ing, leaving a solid silica core to guide the light.
The periodic nature of the cladding makes also possible the existence of acoustic band gaps. Moreover, the core can also act as a defect of the phononic crystal and so elastic defect modes can be confined in this region?
Here we present the first experimental demon- stration of an acoustic defect mode trapped at the solid core in a square-lattice PCF preform.
2. Experimental results
A transverse mode lithium niobate piezoelectric transducer was attached to one side of a square PCF perform, which is shown in Fig. 1. The change in phase induced by the acoustic wave on
the light traveling along the core was measured for different frequencies by inserting the preform
J’IuC5 Fig. 1. SEM image of the cross-section of the preform used in the experiments. The pitch is A
-
75 l m and the diameter of the holes is d -53 pm.in one arm of a Michelson interferometer. A sec- ond Michelson interferometer, in which the transducer was used as one of the mirrors, was set up to monitor the amplitude of the transducer’s vibration and to keep it constant for all the fre- quencies.
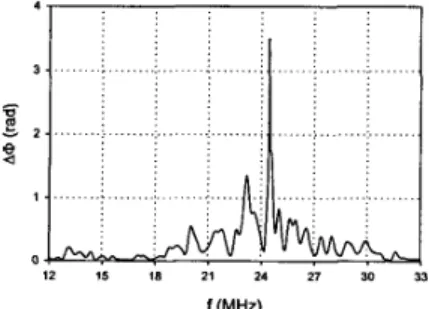
Fig. 2 shows the change in phase as a function of frequency, of the light propagating along the core of the preform, due to the acoustic perturba- tion. A sharp peak is observed at a frequency of 24.4 MHz, which we believe corresponds to an acoustic resonance at the defect. A two-dimen- sional theoretical model confirms this experi- mental behavior.
3. Conclusions
We have observed, for the first time, the presence of an acoustic defect mode trapped at the solid core in a square-lattice PCF preform. Since a pho- tonic crystal fiber is a scaled down preform, we expect to find the same acoustic effects at higher frequencies in the PCF. This can lead to high effi- cient acousto-optic devices based on PCF.
aOn leave from Departamento de Fisica Apli- cada, Universidad de Valencia, E-46 100, Valencia, Spain
4. References
1. J.C. Knight, T.A. Birks, P. St. Russell, D.M. Atkin, “All-silica single-mode optical fiber with photonic crystal cladding”, Opt. Lett.,
12 I S 18 21 24 27 30 33 f (MHz)
JTuC5 Fig. 2. Phase change of the light prop- agating in the PCF perform, induced by the acoustic wave, as a function of frequency.
21, 1547, (1996); erratum Opt. Lett 22, 484, (1997)
M.M. Sigalas, “Elastic wave band gaps and defect states in two-dimensional compos- ites”, J. Acoust. Soc. Am., 101, 1256, (1997)
2.
JTuC6 3:45 pm
Multipole method for efficient
mlcrostructured optical fiber calculations
T.P. White, R.C. McPhedran,
C. Martijn de Sterke, School of Physics, University
of Sydney, New South Wales 2006, Australia; Email: [email protected]
L.C. Botten, School ofMathematica1 m1
==
Sciences, Univ. of Technology, Sydney,N.S. W 2007, Australia
ma’
&
Microstructured optical fibers (MOFs) are
among the most exciting recent developments in
c
fiber optics.’ Typically these consist of a glass coreE
=*I*
surrounded by circular airholes running parallel to the fiber. MOFs have properties that can differ substantidy from conventional step-index fibers, such as unusual dispersion characteristics, low or high effective nonlinearities, and many others. The number of air holes can be as small as six, in which case the energy confinement is imperfect and the modes are leaky. More generally, all modes of MOFs with a finite number of holes and no other confinement mechanism, are leaky.
A number of different methods for MOF cal- culations have been developed. The plane wave decomposition method’ can deal with any refrac- tive index profile but requires large matrices. The decomposition using Hermite-Gaussian func- t i o n ~ ~ has an adjustable parameter, the value of which is not a priori known, and which may dif- fer for different modes of the same fiber. Both methods use periodic boundary conditions and the modes’ leakiness is thus unattainable. The Beam Propagation Method (BPM)* lets one cal- culate the evolution of an initial field profile upon propagation. Though propagating over a suffi- cient distance allows one to separate the modes, this distance is very large if two modes have sim- ilar propagation constants.
Here we report a multipole expansion method for full-vector modal calculations of MOFs with circular holes. Since this is the natural type of ex- pansion for structures with circular inclusions, it is very efficient. In the neighbourhood of an air hole (labeled by i), E, is written using local coor- dinates (ri,
4;)
in terms of Bessel(I,)
and Hankel(H(k9
functions as5E, =
1
[afJ,,,(kLri)+
bfH(’),,,(klri)] e“*, (1)where
kl
is the transverse wavevector compo- nent. When used with the corresponding expan- sion inside the cylinder, the boundary conditions at the surface can be satisfied analytically. This leads to a matrix M, that expresses the a:) in terms of the bi’ for cylinder i. The relation be- tween the bi’ for different cylinders is derivedfrom the observation that the source free or
I ,
parts of expansion (1) in the neighbourhood of cylinder i must be due to