Procedia - Social and Behavioral Sciences 150 ( 2014 ) 1167 – 1176
ScienceDirect
1877-0428 © 2014 The Authors. Published by Elsevier Ltd. This is an open access article under the CC BY-NC-ND license (http://creativecommons.org/licenses/by-nc-nd/3.0/).
Peer-review under responsibility of the International Strategic Management Conference. doi: 10.1016/j.sbspro.2014.09.132
1 Corresponding author. Tel.:+90-212-4441997; E-mail address: [email protected].
10
thInternational Strategic Management Conference
Strategies for employee job satisfaction: A case of service
sector
Kamil Erkan Kabak
a,*, Asım Şen
a, Kenan Göçer
a, Seçil Küçüksöylemez
b, Güngör
Tuncer
caBeykent University, Istanbul, Turkey bEdding Gmbh,Istanbul, Turkey cKavram Meslek Yüksekokulu, Istanbul, Turkey
Abstract
In most situations managing the strategy execution process include the best practices of Total Quality Management (TQM) through increasing employee job satisfaction. The purpose of this study is to measure the impact of TQM activities on the job satisfaction for small and middle sized companies (SMEs) in the service sector of Turkey with an empirical analysis. Five TQM practices chosen to have a significant impact on job satisfaction are employee training and education, employee relations and teamwork, employee reward and recognition, quality culture and employee empowerment. The variables are analyzed using the Exploratory Factory Analysis (EFA), descriptive statistics analysis, correlation analysis and an independent sample t-test. Results show that employee training and education, and employee relations and teamwork are the most dominant factors on job satisfaction. However, there are some considerable factors such as facilities, job security, rewards and there is little impact of education and salary levels on job satisfaction.
© 2014 Published by Elsevier Ltd. Selection and/or peer-review under responsibility of the 10th
International Strategic Management Conference
Keywords: job satisfaction; total quality management; service sector.
1. Introduction
Implementing and executing the strategies successfully depends partly on manager’s ability to motivate people, create and nurture a strategy-supportive work climate. In most cases, managing strategy execution process includes using the best-known practices of Total Quality Management (TQM) and pushing for job satisfaction (Thompson et al., 2010). Job satisfaction and its relations with the TQM
© 2014 The Authors. Published by Elsevier Ltd. This is an open access article under the CC BY-NC-ND license (http://creativecommons.org/licenses/by-nc-nd/3.0/).
practices are gaining more significance in today’s industries since it affects organizational outcomes significantly (Gray et al., 2003). Also, it is one of the main factors on the effectiveness of a business since it causes a firm’s functioning through the behaviors of employees (Spector, 1997). Further, it is regarded as a crucial element in the European Model for TQM (1994), the Deming Prize (1996), and the American Baldrige Quality Award (1999) (Jha and Kumar, 2012).
Job satisfaction is mainly regarded as a phenomenon that occurs when the properties of a job fit together with the demands of employees and determines the fulfillment from a job (Locke, 1976). That is, it is an important factor for the loyalty of employees, continuity, attraction and productivity of a job and it can be viewed as positive emotional reactions to a specific job (Locke, 1976). Many definitions of job satisfaction exist in the literature. Accordingly, Bullock (1952) treats job satisfaction as the integrity of related and unrelated desired job experiences and as an attitude that results from these activities. Vrom (1964) defines it as a multi-dimensional measure of job attitudes with regard to employees’ perceptions, emotions and behaviors. However, Davis and Nestrom (1985) consider job satisfaction connected closely with an employee’s behavior in a workplace.
Although defined in different ways in the literature, in this context, it is considered briefly as the fulfillment that results from the emotions of employees such as love, loyalty and dedication to a job. Further, the research reveals that job satisfaction has an impact on the life satisfaction. As long as being an important element in a human life, the satisfaction from work life will affect the satisfactions on the other areas of the life.
However, one of the difficulties measuring the job satisfaction is that it changes from person to person and it has a dynamic nature. The main reason for this change is that satisfaction factors affect employees’ behaviors at different levels. Some of these factors can be listed as salaries, promotions, structural properties of a job, management styles and colleagues. The impact of these factors on job satisfaction is often explained with TQM.
Despite an extensive amount of research has been performed on job satisfaction and TQM independently, there are only a small number of studies that examine the relationships between TQM activities and job satisfaction. Also, according to authors’ knowledge, little research has been conducted in Turkish industry, particularly on the service sector. For these reasons, this study aims to fill this gap in the literature and to measure the impact of TQM activities on the job satisfaction for small and middle sized companies (SMEs) in the service sector of Turkey with an empirical analysis.
The paper is organized as follows. Section 2 gives a brief survey on relevant literature. Section 3 introduces the conceptual research framework and Section 4 explains the methodology. Section 5 discusses the results of the job satisfaction survey. Finally, the paper is ended with the concluding remarks in Section 6.
2. Literature Research
Much research has been conducted independently on both job satisfaction and TQM in the literature (see Spector, 1979). However, the linkage between job satisfaction and TQM activities is investigated only by a small number studies in various industries in different countries (Lau and Idris, 2001; Zhang et al., 2000; Chapman and Al-Khawaldeh, 2002).
Keng et al. (2005) perform an empirical case analysis to study the employees’ perceptions of TQM activities and analyze their effects on the job satisfaction for a large Malaysian outsourced semiconductor assembly and test organization. Their results show that teamwork has the most dominant factor on job satisfaction. Jain (2010) conducts the job satisfaction survey for an Indian software company by applying
correlation and multiple regression analysis. Her study includes a constraint such that the survey covers only engineers who have more than two years of experience. Similar to Keng et al. (2005), she finds that teamwork is the most dominant factor on job satisfaction. Ijaz et al. (2012) use a different term called “internal customer job satisfaction” instead of employee job satisfaction and they evaluate it with the TQM practices. Also, rather than considering only one organization, their survey includes different service and manufacturing organizations with a structural equation modeling analysis. In a recent study, Alsughayir (2014) analyzes employee job satisfaction by applying an exploratory factor analysis (EFA) together with a multilinear regression analysis for a Saudi Arabian organization. He finds that organization culture has a dominant effect on job satisfaction among the TQM activities.
3. Conceptual Research Framework
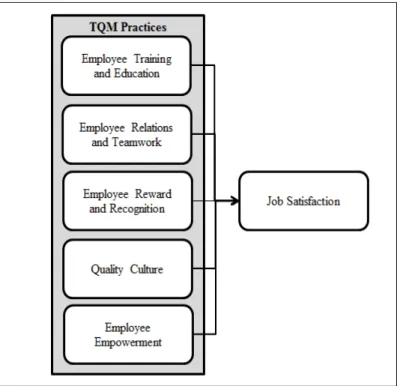
Conceptual research framework is developed in this study similar to the framework given by Keng et al. (2005). The theoretical TQM model for the SMEs in the service sector of Turkey is given in Figure 1.
Figure 1: Conceptual research framework.
The model has five independent variables and one dependent variable. The independent variables are critical TQM practices that are given by Deming (1986) and Juran (1993). The employee job satisfaction is modeled as a dependent variable. Among the independent variables, teamwork, rewards and recognition are also used in previous studies for investigating the impact of TQM practices on employee job satisfaction (see Keng 2005). However, the other critical TQM practices like employee training and education, employee relations, quality culture and employee empowerment are not evaluated on the
impact of job satisfaction in the literature. Therefore, one of the purposes of this study is to bridge these less studied TQM factors with the job satisfaction. For this reason, the following hypothesis is proposed:
H1: The implementation of TQM practices such as employee training and education, employee relations and teamwork, employee reward and recognition, quality culture and employee empowerment are positively associated with job satisfaction within organizations in Turkish service sector.
4. Methodology
In this study, the research method is questionnaire survey method with self-completed surveys. The surveys are completed by small and medium sized enterprises (SMEs) in the Turkish service sector located in Marmara region of Turkey. These SMEs constitute an important portion of Turkish service sector so that it is crucial to analyze the impact of job satisfaction based on TQM activities for these organizations. The data are collected from employees having different job levels from various departments within these SMEs. The response rate of the survey is 50%. The survey was performed between the months of January until April 2013.
The questions in the survey are determined according to main TQM activities and based on the literature. The survey includes five factors in relation to critical TQM practices with a total of 23 questions. The survey is collected in the same day when it is completed. Also, special care is given for having clear and understandable questions in the preparation of the survey. The survey questions are based on 5 point Likert scale ranging from strongly disagree (1) to strongly agree (5) except for the first four questions, which includes non-categorical values such as gender, age range, education level and working length in the organization. The five important TQM constructs and dependent variable are explained below:
(1) Employee training and education: this construct refers to training and education activities within an organization since education is one of major factors affecting the work quality, performance and productivity of the organization. Four questions are asked in the survey at a five item scale according to Zhang et al. (2000).
(2) Employee relations and teamwork: this construct refers to relations of employees with each other since it is an important factor for an employee to feel happy and comfortable in the organization. The purpose of this construct is to understand whether employees in the organization have issues in communicating with their colleagues or not. Four questions based on a five item scale given by Zhang et al. (2000) are asked employees in the survey for this construct.
(3) Employee reward and recognition: this construct refers to social and economic capabilities of an organization since it increases employees’ morale and performance of the organization. This construct includes health insurance, promotions, satisfaction from salaries and availability of social facilities in the organization. Two questions based on a five-item scale developed by Zhang et al. (2000) are asked in the survey for this construct.
(4) Quality culture: this construct refers to satisfaction from the activities within the workplace. It consists of organizational customs, organizational values and environment. This factor is measured by three questions at a five-item scale given by Zhang et al. (2000).
(5) Employee empowerment: this construct refers to the degree of involvement of employees into TQM activities and the level of communication within an organization. The objective for this factor is to understand if TQM practices are applied and employees have a degree of empowerment in relation to managerial decisions. Three questions are asked in the survey for this construct and it has a five-item scale adopted by Zhang et al. (2000).
When compared to above independent constructs, job satisfaction is considered as a dependent variable referring briefly to fulfillment obtained from a job when the values of a job are matched with the needs of employees (Locke, 1976). This construct is measured in the survey by five questions at a five item scale given by Zhang et al. (2000). The questions include if employees are satisfied with their positions in the organization, their duties and their work quality.
5. Results
The analyses are performed with using SPSS 13.0 software program. In this survey, 53.8 percent of respondents were men and 46.2 percent of respondents were women. With regard to education levels, the university graduates constitute the biggest group with a percentage of 63.1. This is followed by master science (MSc) graduates with a percentage of 30.8 and high school graduates with a percentage of 6.2. Although survey questions had choices for primary and secondary school qualifications, there were no replies for these education levels. According to employee age levels, 33.8 percent of respondents is between 18 and 25 years old, 41.5 percent of respondents is between 26 and 35 years old, 15.4 percent of respondents is between 36 and 45 years old, and the remaining percentage of 9.2 is 46 years old and above. As for internal consistency, the survey is tested for Cronbach’s coefficient alpha test value and it is found as 0.656. According to Hair et al. (2006), this value is in the lower range of acceptability since it is between 0.6 and 0.7. In this section, the results of the survey are divided into four subsections. The first subsection includes the results of Exploratory Factor Analysis (EFA), the second subsection describes the descriptive statistics analysis, the third subsection gives the correlation analysis, and the forth subsection presents the results of analyses on the impact of the education level of an employee, salary level and the length of work experience.
5.1 Exploratory Factor Analysis (EFA)
In the beginning of the analysis, the first step is to determine major TQM constructs and to validate the conceptual research framework (see Section 2). To do this, EFA is conducted using the SPSS statistical software package, and the results together with factor loading rates are given in Table 1. With regard to the factors, factor loading rates greater than 0.5 are selected for each component. In addition, these loadings are correlations and the range of possible values is between -1 and 1. In addition, Barlett’s test of sphericity is found as significant. That is, chi-square value is 481.950 and p < 0.001. However, Kaiser-Meyer-Olkin (KMO) measure of sampling adequacy.is found as .556. Thus, the adequacy level of test is considered at the bottom levels of acceptance. According to the results, the TQM factors are sorted according to their factor loading rates. Consequently, the first factor is found as employee training and education. This is followed by employee relations and teamwork as the second factor, then the third factor is found as rewards and recognition. The forth factor is quality culture and the final one is empowerment.
5.2 Descriptive Statistics Analysis
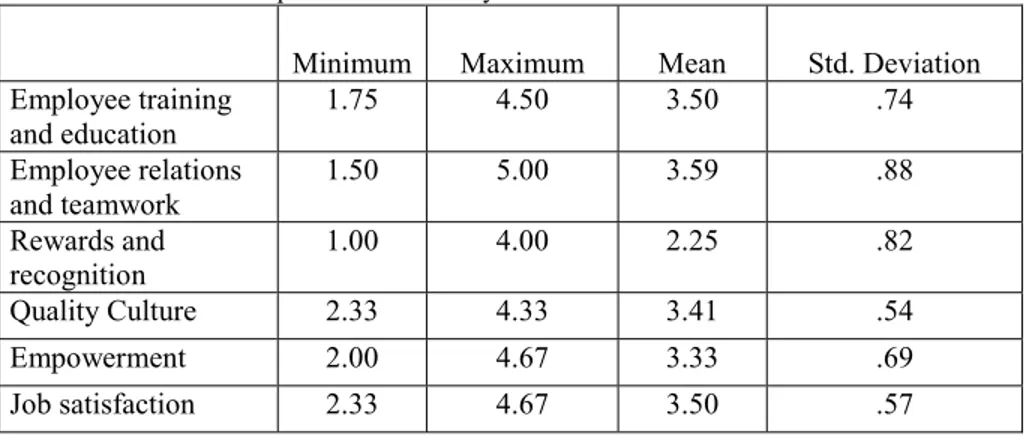
The second analysis includes descriptive statistics analysis of variables chosen from the conceptual framework in Section 3. The results of descriptive statistics are given in Table 2. Accordingly, the most dominant TQM activity for service organizations in Turkey is employee relations and teamwork with the highest mean value (M = 3.59, SD = .88). The second most dominant factor is employee training and education (M = 3.50, SD = .74). Quality culture (M = 3.41, SD = .54) and empowerment (M = 3.33, SD = .69) are considered to be moderate factors for the service organizations, however, rewards and recognition having the smallest mean value (i.e. M = 2.25, SD = .82) is found as the least effective factor.
Table 1: Exploratory factor analysis (EFA) and factor loading rates.
Variables Instrument Items Factor loading Employee training and education Item 1 .915 Item 2 .888 Item 3 .792 Item 4 .720 Employee relations and teamwork Item 1 .839 item 2 .805 Item 3 .775 Item 4 .673 Rewards and recognition Item 1 .851 Item 2 .798 Quality Culture Item 1 .746 Item 2 .601 Item 3 .528 Empowerment Item 1 .782 Item 2 .721 Item 1 .878 Job satisfaction item 1 .670 Item 2 .660 Item 3 .620
Also, job satisfaction (M = 3.50, SD = .57) has relatively high mean value indicating that the impact of TQM activities are relatively positive and high.
Table 2: Results of descriptive statistics analysis.
Minimum Maximum Mean Std. Deviation Employee training and education 1.75 4.50 3.50 .74 Employee relations and teamwork 1.50 5.00 3.59 .88 Rewards and recognition 1.00 4.00 2.25 .82 Quality Culture 2.33 4.33 3.41 .54 Empowerment 2.00 4.67 3.33 .69 Job satisfaction 2.33 4.67 3.50 .57
5.3 Correlation Analysis
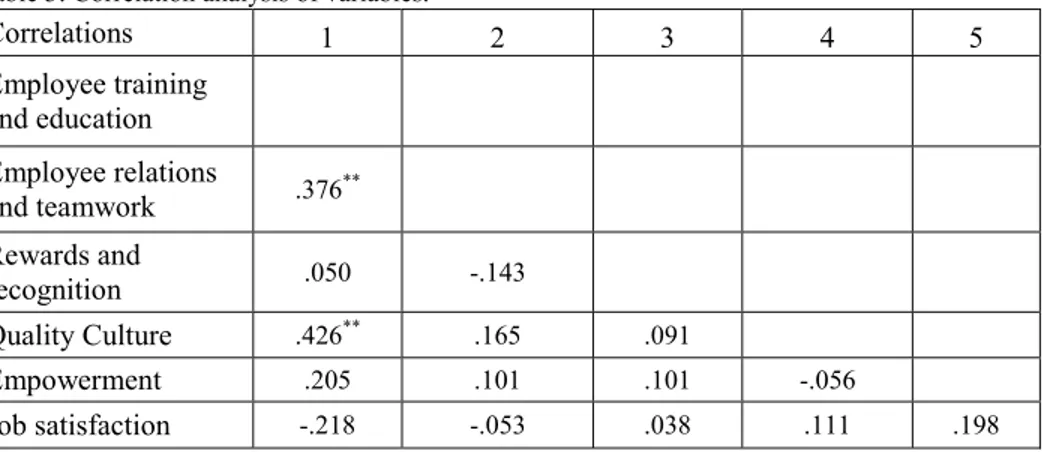
In this section, dependency of TQM activities on the job satisfaction is investigated using the correlation analysis. The results are presented in a correlation matrix in Table 3. According to results, none of the variables are correlated with the job satisfaction since correlations are not significant for p < 0.01 level (2-tailed). However, there is some level of correlation between the first TQM activity of employee training and education and the second TQM activity of employee relations and teamwork. Also, the first TQM activity is correlated with the forth one, quality culture. In addition, all the correlation values of job satisfaction are less than 0.9. That is, collinearity problem does not affect the data (Hair et al., 2006). On the other hand, the results of the multiple regression analysis give that the coefficient of determination, R2, is 18.2 percent, which is too small and not acceptable. For this reason, the results of multiple
regression analysis are not examined in this study.
According to the correlation results, the most dominant TQM factor on the job satisfaction is the first factor, employee training and education with the highest value of correlation. However, this correlation is insignificant. Therefore, the second factor, employee relations and teamwork is selected to be the most dominant factor on the job satisfaction according to the descriptive statistics given in the preceding section.
Table 3: Correlation analysis of variables.
Correlations 1 2 3 4 5 Employee training and education Employee relations and teamwork .376** Rewards and recognition .050 -.143 Quality Culture .426** .165 .091 Empowerment .205 .101 .101 -.056 Job satisfaction -.218 -.053 .038 .111 .198 ** Correlation is significant at p < 0.01 level (2-tailed).
5.4 Analyses on the impact of the education level, salary level and the length of work experience
This analysis examines the other variables such as an employee’s education level, salary level and the length of work experience. The following hypotheses are tested:
H2: There is a positive relationship between the education level of an employee and job satisfaction. H3: There is a positive relationship between the salary level of an employee and job satisfaction. H4: There is no significant difference between the employees having work experience less than 5 years and the employees having work experience between 5 and 10 years with regard to the level of involvement on organization decisions.
The first hypothesis, H2, is tested with the single correlation analysis. The results of the correlation analysis are given in Table 4. According to Table 4, Pearson Correlation shows there is a positive correlation between the education levels of employee and job satisfaction since the value of 0.3 is greater than 0, and hence it is significant. Therefore, H2 can be accepted based on the results given in Table 4.
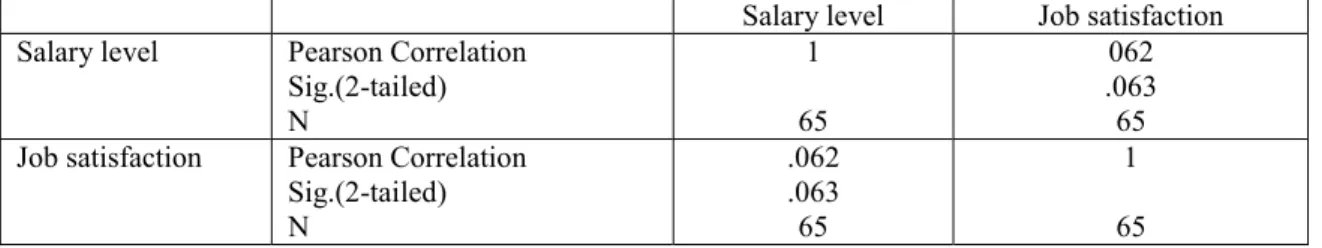
Using the similar analysis, the third hypothesis, H3, is tested according to job satisfaction and the results are given in Table 5 below.
Table 4. The relationship between the education level of an employee and job satisfaction.
Education level Job satisfaction Education level Pearson Correlation
Sig.(2-tailed) N 1 65 .300(*) .015 65 Job satisfaction Pearson Correlation
Sig.(2-tailed) N .300(*) .015 65 1 65
Table 5. The relationship between the employee salary and job satisfaction.
Salary level Job satisfaction Salary level Pearson Correlation
Sig.(2-tailed) N 1 65 062 .063 65 Job satisfaction Pearson Correlation
Sig.(2-tailed) N .062 .063 65 1 65
According to Table 5, Pearson Correlation shows there is a positive correlation between the salary level of an employee and job satisfaction since Pearson Correlation value is greater than .05. However, this relationship is not strong because the value, .062 is not so high.
The forth hypothesis, H4, is tested using the independent samples t-test according to job satisfaction. The results of the test are given in Table 6. The results show that significance levels are greater than 0.05. Thus, H4 is accepted and it is concluded that there is no significant difference between the employees having work experience less than 5 years and the employees having work experience between 5 and 10 years with regard to the level of involvement on organization decisions.
Table 6. The results of independent samples t-test for the forth hypothesis. Levene's Test
for Equality of
Variances t-test for Equality of Means
F Sig. t Df Sig. (2-tailed) Mean Difference Std. Error Difference 95% Confidence Interval of the Difference Lower Upper Equal variances assumed .143 .707 -.633 62 .529 -.173 .273 -.718 .373 Equal variances not assumed -.641 38.02 .525 -.173 .269 -.718 .373
6. Concluding Remarks
The analyses conclude that there is a strong relationship between job satisfaction and some of the TQM activities including employee training and education, employee relations and teamwork. Most of the employees indicate that management of organization should have asked their opinion for important organizational decisions. Their inclusion to overall activities is not good enough and their inclusion to management activities has to be increased.
Employee relations and teamwork in these organizations are strong and they increase employees’ motivation and job performance. Similar results are also reported by Keng et al. (2005) and Jain (2010) for different organizations in Malaysia and Saudi Arabia, respectively. Overall, job satisfaction and work success of employees have been very high. However, employee wages, social and health benefits have to be improved. The employees are not satisfied with the wages. They feel that the organization should increase their material benefits.
The findings could prescribe potential implications for top management to review their TQM practices and include them in their strategic planning process as an important element for increasing employee job satisfaction.
There are some limitations that should be considered for future studies. The survey results were based on some limited data. The future research should increase the sample sizes, geographical diversity, and organization type. It is also important other major practices of the TQM practices including management style and job security should be added to conceptual framework of the study. The measure of job satisfaction comprise of limited number of TQM practices may not represent overall view of job satisfaction.
It is suggested that the future research should be undertaken to include more TQM practices and their impacts on the organizational outcomes. Furthermore, a wider range of employees’ reactions to task characteristics, career satisfaction, management styles, and leadership commitment should be incorporated into a more comprehensive study.
References
Alsughayir, A. (2014), Internal customer job satisfaction and role of TQM practices, European Journal of Business and Management, 6(3), 169-175.
Bullock, R. P. (1952), Social factors related to job satisfaction, Research Monograph No. 70, Ohio State University, Bureau of Business Research, Columbus.
Chapman, R. & Al-Khawaldeh, K. (2002), Quality management worldwide: TQM and labour productivity in Jordanian industrial companies, The TQM Magazine, Vol. 14 No. 4, pp. 248-62.
Davis, K. & Nestrom, J.W. (1985), Human Behavior at work: Organizational Behavior, 7th ed., McGraw Hill, New York, p.109. Deming, W. E. (1986), Out of the Crisis, Cambridge University Press, Cambridge, MA.
Gray, J. H., Densten, I. L. & Sarros, J. C. (2003), A matter of size: does organizational culture predict satisfaction in small organizations? working paper 65/03, September, Faculty of Business and Economics, Monash University, Australia. Hair, J., Black, W., Babin, B., Anderson, R., & Tatham, R. (2006), Multivariate data analysis, 6th ed., New Jersey: Upper Saddle
River, Pearson Education, Inc.
Ijaz, A., Kee, D. M. H. & Irfan, S. M. (2012), Internal customer job satisfaction and role of TQM practices, Far East Journal of Psychology and Business, 6(2), 1-14.
Jain, A. (2010), Impact of TQM on employees’ job satisfaction in Indian software industry, The Proceedings of International Conference on e-Education, e-Business, e-Management and e-Learning, 378-382.
Jha, U. C. & Kumar, S. (2012), Effect of TQM on employee satisfaction, Radix International Journal of Research in Social Science, 1(8), 2250-3994.
Juran, J. M., & Gryna, F. M. (1993), Quality Planning and Analysis: From Product Development through Use, McGraw-Hill, New York, NY.
Keng, B., Bakar, N., Arumugam, A., Vellapan, L. & Loke, A. (2005), Does TQM influence employees’ job satisfaction? An empirical case analysis, International Journal of Quality & Reliability Management, 24(1), 62-77.
Lau, H. C. & Idris, M. A. (2001), Research and concepts: the soft foundation of the critical success factors on TQM implementation in Malaysia, The TQM Magazine, Vol. 13 No. 1, pp. 51-60.
Locke, E. A. (1976), The nature and causes of job satisfaction: role of negative affectivity, Handbook of Industrial and Organizational Behavior, Rand, Chicago, IL, 1297-349.
Smither, R. D. (1997), The Psychology of Work and Human Performance, Longman, 3rd Edition, New York, p. 235. Thompson, A. A. (2010), Crafting and Executive Strategy: The Quest for Competitive Advantage. New York: McGraw-Hill. Vroom, V. H. (1964), Work and motivation, John Wiley and Sons, New York, p.99
Zhang, Z. H., Waszink, A. B. & Wijngaard, J. (2000), An instrument for measuring TQM implementation for Chinese manufacturing companies, International Journal of Quality & Reliability Management, Vol. 17 No. 7, pp. 730-55.