LABORATORY EVALUATION OF THE CROWN IMPACT ON THE
CONTROL OF PIER SCOUR PROTECTION AT A 90 DEGREE BENDS
Mojtaba Ehsanbakhsh
MA, Department of Civil engineering, Yasooj Branch , Islamic Azad University, Yasooj, Iran Seyd Mohsen Sajadi
Assistant Professor, Department of Civil engineering, Yasooj Branch , Islamic Azad University, Yasooj, Iran
Iman Daraie
MA, Department of Civil engineering, Yasooj Branch , Islamic Azad University, Yasooj , Iran Heshmat Alah Mossaie Galeh
MA, Department of Civil engineering, Yasooj Branch , Islamic Azad University, Yasooj , Iran
ABSTRACT
Bridges are among the most important river structures. One the most effective factor for the destruction of bridges is the local scour around bridge piers. Every year, many bridges around the world are damaged because of not considering the role of hydraulic factors. Accordingly,for a reliable design, precise estimation of scour around bridge piers is necessary. In this study, the impact of the crown in the 90-degree bend scour at bridge pier is studied. Moreover, the bases of 2.5 cm and 5 cm in both modes, with the crown and without the crown were studied, including crowns with 2.5 cm and 5 cm and 7.5 cm diameter in a rectangular channel at an angle of 30 degrees and by measuring the water flow in three modes of 12 and 14 and 16 liters per second.The water depth in the channel for each flow was considered in the order of 8 cm and 10 cm and 12 cm that the Ds / y means the maximum depth of scour had an acceptable significance in two modes with scour and without scour and therefore, we obtained the results of processing by using two statistical software Excel and Spss that respectively are graphs and regression equation for both modes.
Keywords: pier, scour, crown INTRODUCTION
Bridges are generally built on rivers, but most rivers have a winding path. Bridges are typically built in the range of river that the rivers are more stable. In this path, may be due to the limitations of constructing roads or lack of stability of the river in the direct ranges, the opinion will be issued on constructing the bridge at River Bend. Scour occurrence around the bridge piers is one of the main reasons for the destruction of bridges.After the collision of flow to the nose of the bridge at the base, according to the fact that the velocity form the reverbed increases to the water surface, more pressure is created in the higher levels on the base and thus the pressure gradient will be created from the top to the down, that causes a downward flow in front of the base.Downward flow will act such as a vertical jet and after hitting the river bed, will dig the bed, and will scatter in all directions, some of the flow that return upward have to move in the direction of flow in hitting with the general flow of the river, and hit the base again. This flow rotation and its return inside the cavity will create a vortex that gradually extends on both sides of the base, and will form a shape like a horseshoe that is called a horseshoe vortex. (Brosez et al., 1997)
Horseshoe vortex formation inside the scour hole will accelerate its drilling and the particles separated from the bed are carried out by the mainstream of the river to the downstream, due to the separation of the flow on the sides of the base, vortices are formed that their axis is perpendicular to the river bed and they are called lift-off vortex. These vortices isolate particles on the bed and expose them to the
flow, and help the transfer of the particles from the front and around the base of the downstream. Scour hole dug by the horseshoe vortex continues so that the volume of water in the scour hole increases and amortizes the vortex energy. In this case, the scour depth reaches the equilibrium. (Radkirvi et al., 1983)
There are many methods proposed to prevent or reduce scour around bridge piers, which can be divided into two categories: direct and indirect. In the direct method, the bed resistance against stresses will increase, this can be done by replacing existing materials to more resistant materials, the most common method is using stile.In an indirect method, by modifying the flow pattern around the base, destructive forces are reduced, including the use of the crown and gap.There are numerous experimental relations to predict scour depth and the most famous of them is the relations that are presented by the American highways central Bureau.
Where DS is depth scour, D is the coefficient of the particles forming the bed, Fr is Froude number, Y is the depth of water in the base upstream, and k is a coefficient that is determined according to the channel bed conditions. These experimental formulas show the scour depth more than the actual amount. (Kaya, 2010)
RESEARCH HISTORY
Several studies have been conducted by researchers in both fields of dealing with scour, including the study of Sing et al (2010) that reviewed the performance of the crown, test results showed that if the distance between the bed level and the crown installment level increases, the maximum scour depth increases, the diameter D 1. The best place to install crown in the experiments was under the bed surface, which in this case, the crown decreases the scour up to 91 percent with a diameter twice the base diameter. (Aghli, 2012)
Dehghani et al (2009) in a study entitled Experimental Study of local scouring around the series of L-shaped breakwaters, writes that breakwaters are structures that are used for the purposes of diverting water flow from the erodible river beach, creating the right path to guide the flow, flood control, establishing the necessary depth for the Ship navigation, protecting outer wall of arches and reforming initiatives of the river. Among the major issues in the design of breakwaters is local scouring of their nose that occurs due to cross flow narrowing and the presence of strong vortex flows. If this depth is not calculated correctly, it can lead to the destruction of the breakwater structures. A review of previous research shows that most previous research was based on the blade breakwater and little research has been done with the L-shaped breakwater. Due to the fact that in practice, a series of water break is used to stabilize an erodible area of the river, so this study is based on a series of L-shaped breakwaters. In this study, with an experimental study in clear water conditions, experiments with three different aggregation, 4 distances between breakwaters and in 3 different flow rates was done. The results showed that the maximum depth of scour occurs around the first breakwater, and the more average particle diameter of the substrate increases, the less maximum scour depth will be. Also in a specific grading, by increasing the distance between the breakwaters, the maximum depth of scour decreases and this negative trend is more intuitive with increasing Froude numbers.
Khosravi et al (2011) has conducted a study entitled the impact of crown on reducing the scour around the breakwaters at the University of Tabriz. They write, the breakwaters are built to protect and control the sides and river banks. Methods of controlling and preventing of breakwaters' scour are based on studies of the scour mechanism. One of these methods is to install a crown around the breakwater. The crowns will protect the bed against the vortex system around the breakwater and will reduce the rate of scour. In the present study, scour around three breakwaters, with a length of 6, 8 and 10 cm was examined and trapezoidal crowns performance with different dimensions was compared for placement on the surface of the bed, and on the breakwater of clear water conditions of breakwaters without a
crown.The results showed that by increasing the width of the crown, the crown performance increases in depth reduction and the scour time delay increasing. Moreover, the percentage of scouring reduction was variable from15 to 100% for crown with different width.
Aronghi (2009) has conducted a study entitled the appropriate dimension determination of the rectangular crown in decreasing pier scour.Variousproceduresare presented to prevent or reduce scour around bridge piers. Using the crown is one the methods that are considered by researchers. In this research, by using a rectangular crown in cylindrical base, it was found that crown, speed of scour and depth of scour hole will decrease the bridge piers scour. The crown dimensions have an important role in reducing scour around bridge piers. In the present study, the crown in upstream and downstream of the bridge pier model and the width of the crown was investigated. Suitable amounts of the rectangular crown length in the upstream and downstream that were measured in the body bridge base model body respectively were determined 0.92 and 1.42 equal to the base diameter. Furthermore, the suitable crown width was also estimated three times of the base diameter. It should be noted that with the above dimensions after 62 hours, a small scour was observed around the bridge piers model.
Englis and Lisi (1959), these two researchers have collected the scour information around bridge from 17 bridges in India. The flow discharge of these bridges was between 29063 to 325000 cubic feet per second and the diameter of bed particles were varied between 17% to 39% mm. The flow depth in areas where scour occurred, were between 25 and 115 feet. This relation is as follows.
1/3 - y ) ds = 0.946 (!.!"!! !"!.! Where in 𝑑!: scour depth (ft)
y the depth of water in the base upstream (ft) Q: flow discharge!"!
!
D50: average particle diameter of the bed (ft)
MATERIALS AND METHODS
Experiments were done in Hydraulic and physical model laboratory of basic studies and comprehensive designs of Ahvaz Water Resource in a rectangular channel with the central angle of 90 degrees and an average radius of 3, width of 6 meters and a height of 6 meter and a length approximately 16 meters. First, we put a bridge pier without a crown in the channel and in a 90 degree arc for the angle of 30 degrees and we also add bed materials with a diameter of 𝐷!"= .8𝑚𝑚 to the bed and we put a gate at the downstream of the bed. Next to adjust the flow rate, for each situation,we received help by using an alignment hose that was installed on the water supply, so that, for example, if we want to choose 12 liters discharge, it was like, when the water level inside the hose reached the height of 13.84, it means, our output discharge is at a rate of 12 liters.For the water level of 14.8 in the hose, the flow discharge rate was 14 and for the water level of 15.62, the flow discharge rate was considered 16. Now, we must examine the bridge foundations in two diameters of 5cmand 2.5cm. First, we put the bridge pier with 2.5cm diameter without a crown in the channel or the bed, and we release the discharge to a limited extent, so that bed material will be almost at saturation level and we close the valve downstream. After that, the bed was quite saturated; we obtain the particle motion threshold. Moving threshold means we enter the discharge into the channel, and by using overflows that we installed in that channel, we continue the last movement of particles, from their initial location to the extent that they move or more clear, to the extent that bed particles do not show any movement for each discharge mode or do not reveal to be suspended which means the other bed particles remain still for that discharge and do not move. We examined the test for the case with two bridge piers, now we place a crown with 2.5cm diameter for bridge pier with 2.5 cm diameter and a crown with 5 diameters and a crown with 7.5 cm diameter at an angle 30 degrees and we increase the input discharge and we open the hatch. We must examine the entries discharge in three modes of12 𝑙𝑖𝑡 𝑠, 14 𝑙𝑖𝑡 𝑠, 116 𝑙𝑖𝑡 𝑠, which means we examine one time a 12 𝑙𝑖𝑡 𝑠dischargefor a bridge with 2.5cm diameter for a crown with 2.5cm diameter, a crown with 5cm diameter and a crown with 7.5cm in 30-degree arc that water level in this mode of discharge must be 8 cm and one time a
14 𝑙𝑖𝑡 𝑠dischargefor a bridge pier with 2.5cm diameter, for a crown with 2.5cm diameter, a crown with 5cm diameter and a crown with 7.5cm that water level in this mode of discharge must be 10 cm and one time a 16 𝑙𝑖𝑡 𝑠 discharge for a bridge pier with 2.5cm diameter, for a crown with 2.5cm diameter, a crown with 5cm diameter and a crown with 7.5cm that water level in this mode of discharge must be 12 cm that for each three modes of our discharge, we must write three tail water depth in the downstream located in the hatch.For this purpose, we steer the hatch with increasing the discharge gradually toward downstream at the same time, till gives us one depth for each discharge. For the discharge of 12 𝑙𝑖𝑡 𝑠, we consider the depth of 8 cm and for the discharge of14 𝑙𝑖𝑡 𝑠, the depth of 10cm and for the discharge of 16 𝑙𝑖𝑡 𝑠, the depth of 12cm for the water level inside the flume. We did not have a specific time period for each test.We continued the test till the amount of scour around bridge piers reaches equilibrium, for each mode of discharge, with a specific diameter of bridge piers and specific diameter of a crown, it means the substrate particles do not transfer from the scour hole to the outside or downstream. After obtaining the maximum scour for each mode, we cut off the discharge, and calculated the maximum depth of scour around bridge piers. To do this, we used a laser meter, initially, before we entered the discharge into the channel or flume, we obtained the primary level of the bed with laser meter, after we opened the discharge, and we obtained the maximum scour for each mode. Places where there was a hole or pit, there was the maximum scour, and places where it happened typically downstream, there was our maximum accumulation. Now for the bridge pier, with a diameter of 5cm, we put once a crown with 2.5cm diameter and a crown with 5cm diameter and once a crown with 7.5cm diameter in the angle of 30 degrees and increased the input discharge and opened the hatch. We examined the input discharge in three modes of12 𝑙𝑖𝑡 𝑠, 14 𝑙𝑖𝑡 𝑠and 16 𝑙𝑖𝑡 𝑠, it means one time a 12 𝑙𝑖𝑡 𝑠discharge for a bridge pier with 2.5cm diameter for a crown with 2.5cm diameter, a crown with 5cm diameter and a crown with 7.5cm in 30-degree arc that water level in this mode of discharge must be 8 cm and one time a 14 𝑙𝑖𝑡 𝑠discharge for a bridge pier with 2.5cm diameter, for a crown with 2.5cm diameter, a crown with 5cm diameter and a crown with 7.5cm that water level in this mode of discharge must be 12 cm that for each three modes of our discharge, we must write three tail water depth in the downstream located in the hatch.We examined the effect of crown in controlling the scour of the bridge pier that how much scour depth we will have for each mode and the angle of 30 degrees ends of the base of the bridge with 2.5cm and 5cm diameter. After the research concepts and hypotheses were formed carefully and the proper sample was selected, the next step is the preparation of research techniques to collect information. This study was experimental and based on the results of the tests and their analysis, the assumptions will be discussed. The use of statistical software Excel and Spss, the results are plotted as graphs and a relation is presented based on the crown coordination.
METHODS OF DATA ANALYSIS
After the research concepts and hypotheses were formed carefully and the proper sample was selected, the next step is the preparation of research techniques to collect information. This study was experimental and based on the results of the tests and their analysis, the assumptions will be discussed. The use of statistical software Excel and Spss, the results are plotted as graphs and a relation is presented based on the crown coordination.
ANALYSIS OF THE RESULTS
Correlation analysis is a statistical tool to determine the type and intensity relation of a quantitative variable with another quantitative variable. The correlation coefficient is a measure used to determine the correlation between two variables. To examine the relation between the dependent variable Ds / y and independent variables in this study, by using SPSS software of the data obtained from direct observation were analyzed and the following results were obtained.
1. The mode with a crown
For better assessing, the relation between dependent and independent variables is detailed above; the correlation matrix for the variables is expressed below. Description of Table 1 is the same as similar description of the correlation in the tables of this chapter.
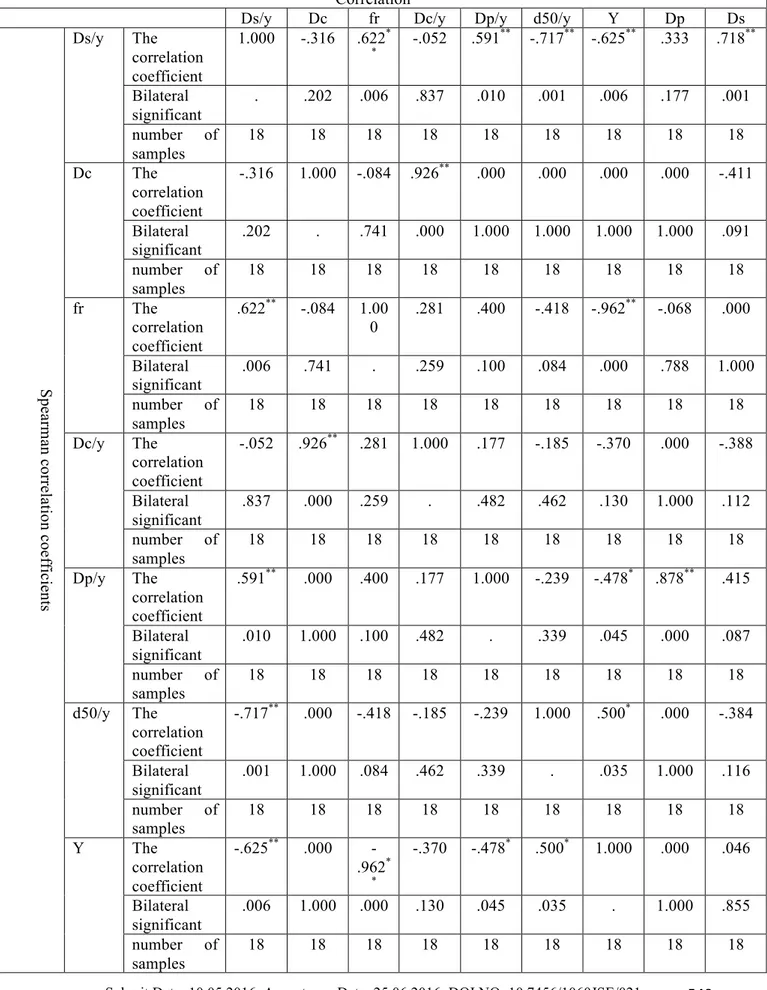
Table 1- Correlation matrix between the variables in the mode with a crown
Correlation
Ds/y Dc fr Dc/y Dp/y d50/y Y Dp Ds
Sp ea rm an c or re la tio n c oe ffi cie nts Ds/y The correlation coefficient 1.000 -.316 .622* * -.052 .591 ** -.717** -.625** .333 .718** Bilateral significant . .202 .006 .837 .010 .001 .006 .177 .001 number of samples 18 18 18 18 18 18 18 18 18 Dc The correlation coefficient -.316 1.000 -.084 .926** .000 .000 .000 .000 -.411 Bilateral significant .202 . .741 .000 1.000 1.000 1.000 1.000 .091 number of samples 18 18 18 18 18 18 18 18 18 fr The correlation coefficient .622** -.084 1.00 0 .281 .400 -.418 -.962** -.068 .000 Bilateral significant .006 .741 . .259 .100 .084 .000 .788 1.000 number of samples 18 18 18 18 18 18 18 18 18 Dc/y The correlation coefficient -.052 .926** .281 1.000 .177 -.185 -.370 .000 -.388 Bilateral significant .837 .000 .259 . .482 .462 .130 1.000 .112 number of samples 18 18 18 18 18 18 18 18 18 Dp/y The correlation coefficient .591** .000 .400 .177 1.000 -.239 -.478* .878** .415 Bilateral significant .010 1.000 .100 .482 . .339 .045 .000 .087 number of samples 18 18 18 18 18 18 18 18 18 d50/y The correlation coefficient -.717** .000 -.418 -.185 -.239 1.000 .500* .000 -.384 Bilateral significant .001 1.000 .084 .462 .339 . .035 1.000 .116 number of samples 18 18 18 18 18 18 18 18 18 Y The correlation coefficient -.625** .000 -.962* * -.370 -.478* .500* 1.000 .000 .046 Bilateral significant .006 1.000 .000 .130 .045 .035 . 1.000 .855 number of samples 18 18 18 18 18 18 18 18 18
Dp The correlation coefficient .333 .000 -.068 .000 .878** .000 .000 1.000 .497* Bilateral significant .177 1.000 .788 1.000 .000 1.000 1.000 . .036 number of samples 18 18 18 18 18 18 18 18 18 Ds The correlation coefficient .718** -.411 .000 -.388 .415 -.384 .046 .497* 1.000 Bilateral significant .001 .091 1.00 0 .112 .087 .116 .855 .036 . number of samples 18 18 18 18 18 18 18 18 18
**. Two-way correlation, at a significance level 0.01 *. Two-way correlation, at a significance level 0.05
In this project, we are looking for the relation between the dependent variable Ds / y with the independent variable, fr, y, Ds, Dc and Dp and with dependent variables Dp / y, Dc / y and d50 / y. Relation description between each of the written independent variables with the dependent variable Ds / y is as follows:
1. The relation between Ds / y and frat the 0.05 level was significant and changes per unit of frat the rate of0.622 per cent increases the amount of Ds / y.
2. The relation between Ds / y and Dc / y at the 0.05 level was significant and changes per unit of Dp / y at a rate of -0.052 reduces the amount of Ds / y.
3. The relation between Ds / y and DP / y at the 0.01 level was significant and changes per unit ofDc / y at the rate of0.591increases the amount of Ds / y.
4. The relation between Ds / y and d50 / y at the 0.01 level was significant and changes per unit ofd50 / y at a rate of -0.717 reduces the amount of Ds / y.
5. The relation between Ds / y and y at the 0.01 level was significant and changes per unit of y at a rate of -0.625 reduce the amount of Ds / y.
6. The relation between Ds / y and Ds at the 0.01 level was significant and changes per unit of Ds at a rate of 0.718 increases the amount ofDs / y.
7. The relation between Ds / y and Dc was not significant. 8. The relation between Ds / y and Dp was not significant.
Therefore, there is not a significant relation between the crown diameter of Ds / y. The interpretation of this concept is that crown diameter variable influenced Ds / y through other variables and by other variables cause changes in Ds / y. To investigate this case, we focus on the relation between Dc with other variables.
It is obtained from Table 1 that, the Dc / y was significant at 0.01 levels and changes per unit of Dc at the rate of 0.926 increases the amount of Dc / y. However, the change per unit of Dc / y at a rate of -0.052 reduces the amount of Ds / y. This matter confirms the regression obtained between the diameters of the crown that only 0.003 percent of the objective function Ds / y can be explained by of the diameter of the crown. In addition, the coefficient of determination between the crown diameter and Ds / y was obtained at a rate of 0.083 and this means that the diameter of the crown has a direct impact on the Ds / y.
In addition, there is no significant relation between the diameter of the bridge piers and Ds / y. According to Table 1 at a significance level of 0.01, the diameter of the bridge pier with Dp / y has a positive and constructive effect with the amount of 0.878. It means changes in per unit of the bridge pier, increases Dp / y to the amount of0.878. In addition, the diameter of the bridge pier on Ds was
significant at the 0.05 level and changes per unit of the bridge pier diameter increases0.497 percent of maximum depth of scour.
1. The mode without a crown
Like the mode with a crown, in the without the crown mode, the correlation matrix has been presented too. The interpretation of the correlation matrix in Table 2 is similar to the interpretation of the correlation table between two variables in the previous pages.
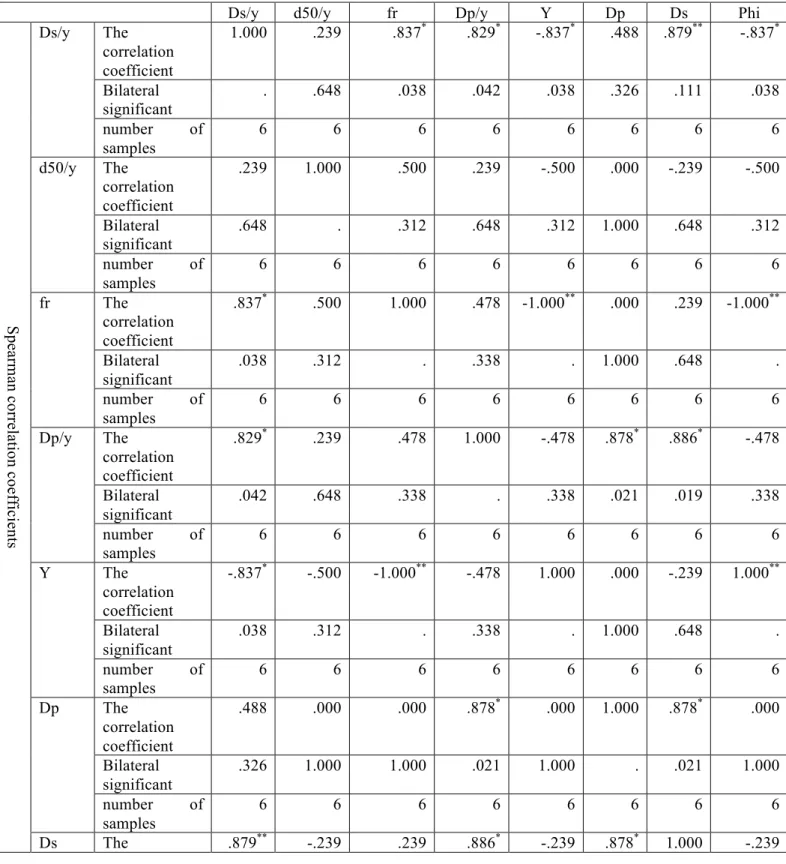
Table 2-Correlation matrix between the variables in the mode without a crown
Ds/y d50/y fr Dp/y Y Dp Ds Phi
Sp ea rm an c or re la tio n c oe ffi cie nts Ds/y The correlation coefficient 1.000 .239 .837* .829* -.837* .488 .879** -.837* Bilateral significant . .648 .038 .042 .038 .326 .111 .038 number of samples 6 6 6 6 6 6 6 6 d50/y The correlation coefficient .239 1.000 .500 .239 -.500 .000 -.239 -.500 Bilateral significant .648 . .312 .648 .312 1.000 .648 .312 number of samples 6 6 6 6 6 6 6 6 fr The correlation coefficient .837* .500 1.000 .478 -1.000** .000 .239 -1.000** Bilateral significant .038 .312 . .338 . 1.000 .648 . number of samples 6 6 6 6 6 6 6 6 Dp/y The correlation coefficient .829* .239 .478 1.000 -.478 .878* .886* -.478 Bilateral significant .042 .648 .338 . .338 .021 .019 .338 number of samples 6 6 6 6 6 6 6 6 Y The correlation coefficient -.837* -.500 -1.000** -.478 1.000 .000 -.239 1.000** Bilateral significant .038 .312 . .338 . 1.000 .648 . number of samples 6 6 6 6 6 6 6 6 Dp The correlation coefficient .488 .000 .000 .878* .000 1.000 .878* .000 Bilateral significant .326 1.000 1.000 .021 1.000 . .021 1.000 number of samples 6 6 6 6 6 6 6 6 Ds The .879** -.239 .239 .886* -.239 .878* 1.000 -.239
correlation coefficient Bilateral significant .111 .648 .648 .019 .648 .021 . .648 number of samples 6 6 6 6 6 6 6 6 phi The correlation coefficient -.837* -.500 -1.000** -.478 1.000** .000 -.239 1.000 Bilateral significant .038 .312 . .338 . 1.000 .648 . number of samples 6 6 6 6 6 6 6 6
**. Two-way correlation, at a significance level 0.01 *. Two-way correlation, at a significance level 0.05
Now, in the state without a crown, we study the relations between the dependent and independent variables.
In this project, we are looking for the relation between the dependent variable Ds / y with the independent variable, fr, y, Ds, Dc and Dp and with dependent variables Dp / y, Dc / y and d50 / y. Relation description between each of the written independent variables with the dependent variable Ds / y is as follows:
1. The relation between Ds / y and frat the 0.05 level was significant and changes per unit of frat the rate of 0.837 per cent increases the amount of Ds / y.
2. The relation between Ds / y and Dp / y at the0.05 level was significant and changes per unit of Dp / y at a rate of 0.829 increases the amount of Ds / y.
3. The relation between Ds / y and D50/y is not significant.
4. The relation between Ds / y and y at the 0.05 level was significant and changes per unit of y at a rate of -0.837 reduces the amount of Ds / y.
5. The relation between Ds / y and Ds at the 0.01 level was significant and changes per unit of Ds at a rate of 0.879 increases the amount of Ds / y.
6. The relation between Ds / y and Dp was not significant.
7. The relation between Ds / y and the discharge in the nonparametric state at the0.05 level was significant and changes per unit of the discharge at a rate of -0.837 reduce the amount of Ds / y. 8. The relation between Ds / y and the speed in nonparametric state at the 0.05 level was significant and changes per unit of the speed at a rate of 0.837 increases the amount of Ds / y.
Now,we express the regression, regression coefficient (R), coefficient of determination (R Square), adjusted coefficient of determination (Adjusted R Square), the standard error of the estimate (Std. Error of the Estimate) and computational error (Residua) for two series with a crown and without a crown. As shown in Table 3, to determine the coefficient of determination (r2) and the regression, at first we consider the variables of Dp / y, Dc / y, d50 / y and fr as year variables and we calculate the function regression of Ds / y for the state with a crown.
Table3- input variables in regression analysis
ModelInput Variables Deleted variables
Method 1 ،Dc/y،Dp/y
d50/y , frb. Enter
a. the dependent variable: F1
In Table 4, the regression coefficient equal to 0.887, and the coefficient of determination, equal to 0.796 and adjusted determination coefficient equal to the same coefficient of determination minus the standard error of the estimates, equal to 0.698.
Table 4– Summary of the regression analysis
ModelRegression
coefficient R Square Adjusted R Square The standard error of the estimates
1.877a .769 .698 .0258783
a. the predictor variables, Dp / y, D / y, d50 / y, fr Regression and Residua for the type with the crown are as Table 5.
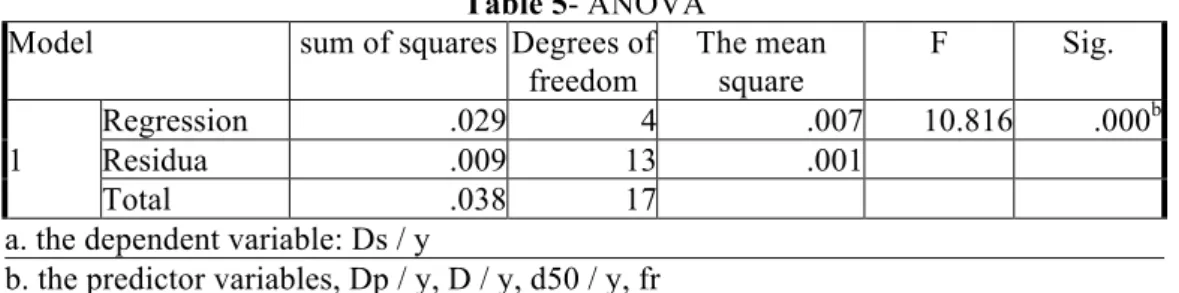
Table 5- ANOVA
Model sum of squares Degrees of freedom The mean square F Sig. 1 Regression .029 4 .007 10.816 .000b Residua .009 13 .001 Total .038 17
a. the dependent variable: Ds / y
b. the predictor variables, Dp / y, D / y, d50 / y, fr
After the regression with a crown mode became clear, to obtain the formula between the variables in the case of the criterion, will be in accordance with Table 6:
Ds / y = .223 + .118fr-.312Dp / y + .286Dc / y-.692d50 / y
Table 6- Table of variables coefficients
Model Not standardized coefficients Standardized coefficients t Sig. B Std. Error Beta 1 (Constant).223 .039 5.721 .000 fr.241 .375 .118 .642 .532 Dp/y-.062 .028 -.312 -2.208 .046 Dc/y.090 .046 .286 1.962 .072 d50/y-10.241 2.796 -.692 -3.663 .003
a. the dependent variable: Ds / y
In addition to the communication matrix and regression tables, we draw the charts of biaxial between Ds / y and four variables d50 / y, Dp / y, fr and Dc / y so that a comprehensive conclusion will be presented from the content.
Figure 1- Graph between Ds / y and f
Figure 2- Graph between Ds / y and Dc / y
Figure 3 - Graph between Ds / y and d50 / y
0 0.05 0.1 0.15 0.2 0.25 0.3 0 0.02 0.04 0.06 0.08 0.1 Ds/y fr 0 0.05 0.1 0.15 0.2 0.25 0.3 0 0.2 0.4 0.6 0.8 1 Ds/y Dc/y 0 0.05 0.1 0.15 0.2 0.25 0.3 0 0.002 0.004 0.006 0.008 0.01 Ds/y d50/y
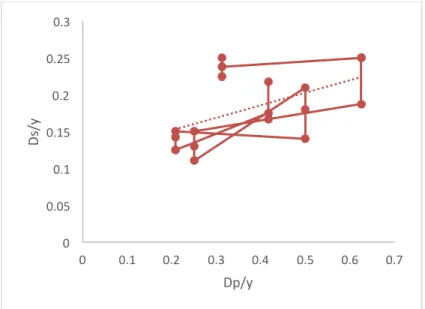
Figure 4 - Graph between Ds / y and Dp / y
But for graphs relating to the mode without the crown, between the dependent variable Ds / y and variables d50 / y, Dp / y, fr we have:
Figure 5 - Graph between Ds / y and d50 / y
0 0.05 0.1 0.15 0.2 0.25 0.3 0 0.1 0.2 0.3 0.4 0.5 0.6 0.7 Ds/y Dp/y 0 0.1 0.2 0.3 0.4 0.5 0.6 0.7 0 0.2 0.4 0.6 0.8 1 Ds/y d50/y 0 0.1 0.2 0.3 0.4 0.5 0.6 0.7 0 0.02 0.04 0.06 0.08 0.1 Ds/y fr
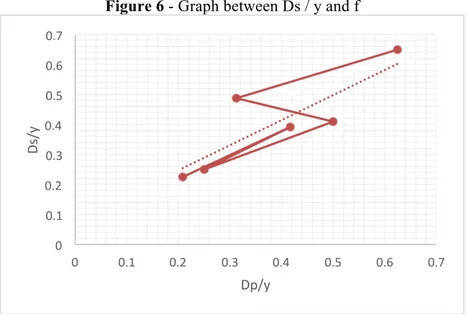
Figure 6 - Graph between Ds / y and f
Figure 7 - Graph between Ds / y and Dp / y
For no crown mode, at first, the variables d50 / y, Dp / y, fr are evaluated along with Ds / y for processing regression. The regression (Regression), regression coefficient (R), coefficient of determination (R Square), the adjusted coefficient of determination (Adjusted R Square), the standard error of the estimate (Std. Error of the Estimate) and computational errors (Residua) are as Table 7 .
Table 7
- The input variables in the regression analysis a
ModelInput Variables Deleted variables
Method 1 d50/y, Dp/y, frb. Enter a. The dependent variable: Ds / y
b. All variables were entered
According to the obtained regression coefficients and R Square for no crown mode in Table 8, the mode with a crown is acceptable for controlling the scour.
Table 8– Summary of the regression analysis
ModelRegression coefficient R Square Adjusted R Square The standard error of the estimates 1.995a .990 .976 .0245193
a. the predictor variables, Dp / y, D / y, d50 / y, fr Regression without a crown is obtained 0.122 based on Table 9.
Table 9- ANOVA
Model sum of squares Degrees of
freedom The mean square F Sig. 1
Regression .122 3 .041 67.762 .015b
Residua .001 2 .001
Total .123 5
a. the dependent variable: Ds / y
b. the predictor variables, Dp / y, D / y, d50 / y, fr
Now that regressions and correlations between variables involved in the defined equation have been
0 0.1 0.2 0.3 0.4 0.5 0.6 0.7 0 0.1 0.2 0.3 0.4 0.5 0.6 0.7 Ds/y Dp/y
Ds / y = .053 + .470fr + .624Dp / y-.368d50 / y
Table 10- Table of variables coefficients
Model Not standardized coefficients Standardized coefficients t Sig. B Std. Error Beta 1 (Constant).053 .032 1.680 .235 fr2.886 .479 .470 6.024 .026 Dp/y.617 .077 .624 8.023 .015 d50/y-.141 .027 -.368 -5.220 .035 (Constant).053 .032 1.680 .235
a. the dependent variable: Ds / y
But, which one of the modes without a crown or with a crown is better to use? Since, the numbers of samples of both modes with and without crowns are not equal and whereas the number of variables involved in the creation of objective functions values 1 and 2 are not equal, according to Tables 3 and 7; the mode without the crown is better. But to confirm this result and to assess the significance of the two given objective function values, the Kolmogorov test is used. This test is in the form of significant measured two variables or two unequal societies and that society or a variable that has a higher significant value, will be selected as the accepted sample in terms of comparisons. Table 11 shows the significant amount of Ds / y for the two modes of with a crown and without a crown. Both modes had the significance higher than 0.05 and therefore the results of both modes are accepted. According to Table 11, the non-crown mode (F2) had a higher significance at the rate of 0.996 and scour control is acceptable. The first objective function (F1) is not considered scientific because it has the significant amount below 0.9 and that its implementation is not accepted. Table 11 outlines the above description.
Table 11- The comparison of two populations by using Smirnov- Kolmogorov test
F2 F1
The total number of samples 6 18 Normal parameters, b Average.402367 .18308 Standard deviation.1571092 .047079 Highlights major differences Total.167 .148 Positive.167 .148 Negative-.140 -.105 Kolmogorov-Smirnov,.410 .627 Amount of symmetrical two-sided
significance.996 .827 a. The distribution test is normal
b. Calculations derived from data
CONCLUSION
This research aimed to investigate the relation between the dependent variable Ds / y with the independent variables fr, y, Ds, Dc and Dp and with dependent variables Dp / y, Dc / y and d50 / y. This process was carried out in both modes with a crown (Dc) and without a crown. Regression and correlation analyzes were done with spss software, and charts related to the relations between the dependent variable Ds / y with the dependent variables Dp / y, Dc / y and d50 / y and the independent variable fr in Excel. Results showed that first Ds / y and Dc, Ds / y and Dp in the first mode had no significant relation together. In the mode without a crown Ds / y with Dp and d50 / y had no significant relation. Ds / y had a significant relation with other variables. Second, the second purpose function-without a crown- was evaluated and selected with R Square 0.990 and the regression coefficient 0.995 better than the mode with a crown. After determining the communications and regression, the mode with a crown with the will be as the regression formula Ds / y = .223 +
.118fr-.312Dp / y + .286Dc / y-.692d50 / y and the mode without the crown was obtained with regression formula Ds / y = .053 + .470fr + .624Dp / y-.368d50 / y, respectively.
REFERENCES
Aronghi Hadi, Farsadizadeh Davood, Hossein Zadeh Dalir Ali, Fakhari Far Ahmad (2009), to determine the appropriate dimensions of the rectangular crown in reducing the bridge pier scour, Department of Water Engineering, Faculty of Agriculture, University of Tabriz
Dehghani, Reza, Yusefi, Roya (2009) Experimental study of local scour around a series of L-shaped breakwater, Journal of Civil Engineering, Tehran University.
Khosravinia Payam, Hussein Zadeh Dalir Ali, Farsadizadeh Davood, Fakheri Fard Ahmad (2012) the effect of a crown in reducing scouring around breakwater, University of Agriculture, University of Tabriz
Aghli, Mojtaba, Zomorodian, Seyed Mohammad (2012) combined effects of a crown and a cable on depth of scour around bridge piers in the river bend, the SID Journal, Shiraz University.
Breusers، H. N. C.، Nicollet، G. and H. W. Shen.1977. Local scour around cylindrical piers. Journal of Hydraulic Research، H. W. 15(3):211-252.
Kaya، A. 2010. Artifical neural network study of observed pattern of scour depth around bridge piers.Computers and Geotechnics، 37:413-418.
Mashahir، M.B. and A.R. Zarrati، 2002.Effect of collar on time development of scouring around rectangular bridge، 5th International Conference on Hydraulic Science and Engineering، Warsaw، Poland. pp. 50-57.
Masjedi، A. R.،ShafaeiBejstan، M. A. and A. Esfandi، 2010. Redaction of local scour at a bridge pier fitted with a collar in a 180 degree flume bend. Journal of Hydraulic Engineering، ASCE. 134(3):183-187.
Raudkivi، A. J. and R. Ettema. 1983. Clear water scour at cylindrical piers. Journal of Hydraulic Engineering، ASCE R، 109(3): 338-349.