Determination of Ellenberg’s Indicator Values Along an Elevational
Gradient in Central Black Sea Region of Turkey
(Penentuan Nilai Penunjuk Ellenberg Sepanjang Kecerunan Ketinggian di Wilayah Laut Hitam Tengah, Turki)
H.G. KUTBAY* & B. SÜRMEN ABSTRACT
The Central Black Sea Region has an unique vegetation because different vegetation types occurred. In the present study plant communities (from Mediterranean-type to temperate forests) in the Central Black Sea Region along an elevational gradient was evaluated on Ellenberg’s Indicator Values (EIVs). EIVs were calculated for nutrient availability, pH and temperature variables (nutrient availability (N), pH (R) and temperature (T)) with the help of weighted averages. Additionally, the vegetation of the study area was classified by using two way indicator species analyses (TWINSPAN) method and the interactions among plant species and EIVs were also studied by the help of Canonical Correspondence Analysis (CCA). We found some differences between our data and the previous data which were obtained from similar vegetation types with respect to EIV’s for nutrient availability, pH and temperature. Pteridium aquilinum, Fragaria
vesca and Euphorbia amygdaloides var. amygdaloides may be used as an indicator of nutrient availability. There were significant differences among species regarding EIVs for temperature because the study area includes temperate and Mediterranean-type communities.
Keywords: Black Sea; Canonical correspondance analyses; Ellenberg indicator values (EIVs); forest vegetation; nutrient availability; pH; temperature
ABSTRAK
Wilayah Laut Hitam Tengah mempunyai vegetasi unik kerana wujudnya jenis vegetasi berbeza. Dalam kajian ini komuniti tumbuhan (daripada jenis Mediterranean kepada hutan temperat) di Wilayah Laut Hitam Tengah sepanjang kecerunan ketinggian telah dinilai ke atas Nilai Penunjuk Ellenberg (EIV). EIV telah dikira untuk variabel ketersediaan nutrien, pH dan suhu (ketersediaan nutrien (N), pH (R) dan suhu (T)) dengan bantuan purata pemberat. Sebagai tambahan vegetasi kawasan kajian telah dikelaskan dengan menggunakan kaedah analisis spesies penunjuk dua arah (TWINSPAN) dan saling tindakan dalam kalangan spesies tumbuhan dan EIV telah dikaji dengan bantuan Analisis Kesetaraan Kanon (CCA). Terdapat perbezaan antara data kami dan data terdahulu daripada vegetasi serupa daripada segi EIV bagi ketersedian nutrien, pH dan suhu. Pteridium aquilinum, Fragaria vesca dan Euphorbia amygdaloides var. amygdaloides boleh digunakan sebagai penunjuk bagi ketersediaan nutrien. Terdapat perbezaan yang signifikan antara spesies daripada segi EIV bagi suhu kerana kawasan kajian mencakupi jenis masyarakat temperat dan Mediterranean.
Kata kunci: Analisis kesetaraan Kanon; suhu; ketersediaan nutrien; Laut Hitam; nilai penunjuk Ellenberg (EIV); pH; vegetasi hutan
INTRODUCTION
Environmental factors in forest communities are very complex due to the overlapping of species niches (Testi et al. 2004; Whittaker 1975). Plant ecologists know about the varying habitat requirements of the organisms investigated by them (Hill et al. 2000). Plant ecologists proposed various indicator value for plants (Grime’s CSR strategies and functional nitrogen index). Indicator values were firstly calculated in plant communities by Landolt (1977). Ellenberg (1979) put forward two sets of indicator values for the flora of central Europe which was updated by Ellenberg et al. in 1991 (Hill et al. 2000). The enumeration given by Lindacher (1995) includes both of them. However, van de Maarel (1993) has recommended
that Ellenberg’s indicator values (EIV’s) should be taken as more or less definite. Only thing to be done is correction of few misclassifications and regional deviations. The indifferent or uncertain values missing from the list should be compiled by using average values for socio-ecological groups (Hill et al. 2000).
Ellenberg indicator values have been used from central Europe to Poland (Zarzycky 1984), Italy (Pignatti 2005), Hungary (Borhidi 1995) and Britain (Hill et al. 2004). Böhling et al. (2002) has proposed a list of ecological indicators for the flora of Greece. Biological indicator involves use of specific reactions of organisms to their enviroment (Diekmann 2003). So the tolerances of the species against certain enviromental factors affect their
distribution areas. According to Fanelli et al. (2007) synthetic and effective way of analysing and expressing ecosystem complexity is indicator values (Zeigerwerte) proposed for plant species. Ellenberg’s classification system has proven to be very useful to better understand the autecology of plant species (Humbert et al. 2007). Central Black Sea Region has a unique vegetation because different vegetation types from Mediterranean-type communities to temperate deciduous forests occurred (Kutbay & Kılınç 1995). The aim of this study was the classification of species in Central Black Sea Region of Turkey according to Ellenberg’s indicator values along an elevational gradient. We also aimed to classify these species by the help of numerical methods. This is the first study to attempt the classification of Turkish species regarding Ellenberg’s indicator values because no study was carried out to classify Turkish Flora according to Ellenberg’s indicator values.
MATERIALS AND METHODS STUDY AREA
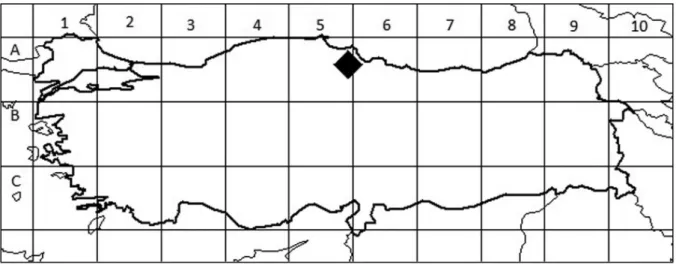
The study area is located in A5 - A6 squares according to the grid sytem of Davis (Figure 1). An elevational gradient was chosen from 50 to 1400 m. The study area is surrounded by rich water resources. The most important water source is Kızılırmak. The oldest geological structure unit is the upper cretaceous flysch series and volcanic and alluvial series are also present. The most common soil group is brown forest soils grey-brown podsolic soils, alluvial and colluvial series (Kutbay & Kılınc 1995).
February is the coldest month with mean temperatures in the area lying around 6.9°C and August is the hottest month with a mean daily temperature of 28.2°C. The hottest month is November (38.4°C), while the coldest month is March (-7.0°C). Mean annual precipitation is 691.70 mm. The study area is situated in Euxine provence of Euro-Siberian phytogeogaphical region.
VEGETATION SAMPLING
A total of 140 sampling plots along the elevational gradient at 100, 300, 500, 700, 900, 1100 and 1300 m were taken at 200 m intervals (Kitayama 1992). Sample plot size was determined by the help of minimal area method. The method given by Braun-Blanquet for vegetation classification (Mueller-Dombois & Ellenberg 1974) was used to estimate cover-abundance values: 0, 1, 1-5, 5-10, 10-25, 25-50, 50-75 and 75-100%. The cover-abundance values of species given as percentages were converted to van der Maarel’s cover-abundance values as: 1 to 1, 1-5 to 2, 5-10 to 3, 10-25 to 5, 25-50 to 7, 50-75 to 8 and 75-100 to 9 (Hill 1979).
SOIL SAMPLING AND ANALYSES
Soil samples for chemical analysis were collected under all of the associations from 0 to 40 m by the help of a soil auger along the elevational gradient. Soil samples were cleaned from organic debris and they were sieved to a 2 mm mesh. Standard protocols were followed for chemical analysis. Beckman pH meter was used for pH determination and total N concentration was determined by using a micro-Kjeldahl method (Kutbay & Ok 2003).
CALCULATIONS AND STATISTICAL ANALYSES MEAN WEİGHT
For character species in plant associations, EIVs were calculated by using weighted average formula.
rij = response of species i in sample plot j
xi = indicator value of species i
We identified plant association by using TWINSPAN (two-way indicator species analyses) and DCA (detrended
correspondance analysis) was done for an identification of distance group patterns. We obtained EIVs by calculating weighted average. Using these EIVs, indicator values for each sample plot were estimated. For each site the interrelationships between environmental data and vegetation were analyzed using CCA (canonical correspondance analyses).
In the present study, to calculate EIVs and to reveal their relationship between vegetation and enviromental factors, plant associations were determined by TWINSPAN: In plant associations, EIVs of character species were calculated for nutrient availability (N), pH (R) and temperature (T). The calculated EIVs were compared with previous studies; CCA (Canonical correspondance analysis).
RESULTS
Temperate deciduous and Mediterranean-type communities and stream vegetation types occurred in the study area. According to DCA analysis both axis 1 and axis 2 were significant. In axis 1, shade tolerance is effective on distribution of associations, whereas temperature is effective on distribution of associations in the study area (Figure 2). According to the TWINSPAN, eleven plant
associations were present in the study area (Figure 3). Character species were usually Euxine origin, although some Mediterranean elements were present (Table 1).
Mediterranean-type communities were replaced by temperate deciduous forests towards to the left axis of DCA diagram (Figure 2).
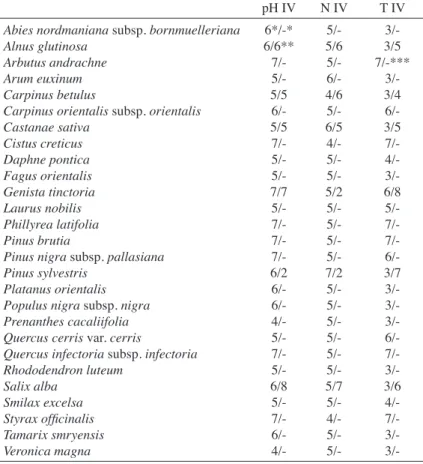
A total of 27 EIVs of plant species were calculated according to weighed average (Table 1). EIVs of species were different from those reported in previous studies. However, some similarities were also found (Table 1). Common plant species were Alnus glutinosa, Carpinus betulus, Genista tinctoria, Pinus sylvestris and Salix alba. When pH indicator values were examined, P. sylvestris and S. alba occurred in two different axis. P. sylvestris has a low EIV for pH, but S. alba has a relatively high EIV for pH. For the other plant species, EIV for pH were comparatively similar. All of the plant species has different nutrient availability especially P. sylvestris and G. tinctoria. Finally, all plant species had different EIVs for temperature. CCA results showed that nutrient availability, pH and temperature enviromental factors are the most significant ecological factors on the distribution of associations (Figure 4). Pteridium aquilinum, Fragaria vesca, Circea luteliana, Rumex crispus and Salvia glutinosa were related to nutrient availability, whereas Blackstonia perfoliata,
TABLE 1. Ellenberg indicator values (EIVs) of selected species pH IV N IV T IV
Abies nordmaniana subsp. bornmuelleriana Alnus glutinosa
Arbutus andrachne Arum euxinum Carpinus betulus
Carpinus orientalis subsp. orientalis Castanae sativa Cistus creticus Daphne pontica Fagus orientalis Genista tinctoria Laurus nobilis Phillyrea latifolia Pinus brutia
Pinus nigra subsp. pallasiana Pinus sylvestris
Platanus orientalis Populus nigra subsp. nigra Prenanthes cacaliifolia Quercus cerris var. cerris
Quercus infectoria subsp. infectoria Rhododendron luteum Salix alba Smilax excelsa Styrax officinalis Tamarix smryensis Veronica magna 6*/-* 6/6** 7/- 5/-5/5 6/-5/5 7/- 5/-7/7 5/- 7/-6/2 6/- 4/- 5/- 7/- 5/-6/8 5/- 7/- 6/- 4/- 5/-5/6 5/- 6/-4/6 5/-6/5 4/- 5/-5/2 5/-7/2 5/-5/7 5/- 4/- 5/- 3/-3/5 7/-*** 3/-3/4 6/-3/5 7/- 4/- 3/-6/8 5/- 7/- 6/-3/7 3/- 6/- 7/- 3/-3/6 4/- 7/-
3/-*EIVs in the present study
**EIVs in previous studies (Hill et al. 2004). ***Not determined
FIGURE 3. TWINSPAN dendogram of plots showing plant associations. FC: Fago orientalis – Castanetum sativae Quézel ve ark., 1980; RF:Rhododendron luteo – Fagetum orientalis Kutbay & Kılınc 1995; CF:Carpino orientalis – Fagetum orientalis Akman ve
ark., 1983; FA:Fago orientalis–Abietum nordmannianae Akman, 1976; PL:Phillyreo latifoliae – Lauretum nobilis Quézel ve ark., 1980; CQ:Carpino orientalis – Quercetum cerridis Kutbay & Kılınc 1995; DP:Daphno ponticae – Pinetum sylvestris Akman, 1974;
GP:Genista tinctoriae – Pinetum nigrae Kutbay & Kılınc 1995; QP:Querco - Pinetum brutiae Kutbay and Kilinc 1995; CP:Carpino
orentalis – Phillyretum latifoliae Quézel ve ark., 1980; SP:Salici albae – Platanetum orientalis Kutbay& Kılınc 1995
FIGURE 2. DCA ordination diagram showing distribution of plant species at vegetation. underlined plants are character species (Eigenvalues; axis 1= 0.71, axis 2=0.53)
Cotinus coggyria and Dorycnium pentaphyllum subsp. anatolicum were related to soil pH like Pinus nigra subsp. pallasina and Genista tinctoria. Temperature was rather effective on the distribution of Mediterranean species like Cistus creticus, Phillyrea latifolia, Arbutus andrachne, Teucrium chamaedrys subsp. chamaedrys and T. polium (Figure 4).
DISCUSSION
We tried to characterize the enviromental gradients along the elevational gradient in vegetation of Central Black Sea Region. Our results were somewhat similar to British species. However, some differences were also found. For example, Salix alba and Pinus sylvestris showed significant differences from British species regarding all of the EIVs. Such differences in EIVs may be originated from different habitat preference of particular species. There is no systematical deviation of ecological behaviour of different plant species within the geographical range, thus obviously levelling off respective deviances due to single species in the nemoral and subboreal part of Europe (Seidling & Fisher 2008). In the floras of Britain and Ireland, Ellenberg’s values for temperature and continentality have been discussed in relation to wider geographical distribution (Preston & Hill 1997). They observed that in major biomes good relation exists between Ellenberg T values and the distribution of species (Hill et al. 2000). According to Seidling and Rohner (1993) and Hardtle et al. (2004) when soil conditions are taken into consideration on regional basis; Ellenberg indicator values are in close relation with measured soil parameters.
Mediterraean-type communities were closely associated with temperature. Central Black Sea region has a Mediterranean climate and temperature and pH values are different from eastern parts of Black Sea Region.
Temperature was changed along the elevational gradient. The problems concerning light, temperature and moisture values in the Mediterranean region have been dealt with by Godefroid and Dana (2007). Different plant communities from temperate deciduous forests to Mediterrean-type forests occurred in the study area and plant species had different preference for temperature and our data were agreed with Central European plants (Hermy et al. 1999). EIVs for temperature and nutrient availability were differed among species, whilst pH values were somewhat similar except for Salix alba and Pinus sylvestris. Zerbe and Wirth (2006) found that P. sylvestris is a widely distributed dominant species on many sites in the German lowlands in relation to soil characteristics like moisture, nutrient availability and pH. It is easier to measure soil pH when compared with most other variables, because its variation over time is less than soil water or light. The nutrient status and the available amounts of other elements in the soil are generally affected by the soil pH (Diekmann 2003). According to Zelený et al. (2010) soil reaction increases with increasing landscape heterogeneity when data is presented by Ellenberg indicator values. These species (Salix alba and Pinus sylvestris) occupied heterogenous areas in northern slopes.
According to CCA, the species under Pinus nigra subsp. pallasiana forests were associated with soil pH. These species and Mediterranean-type communities occupied slightly alkaline areas, whilst the other forests occurred medium to slightly acidic sites. P. sylvestris and P. nigra subsp. pallasiana forests occupied nutrient-rich sites as compared to the other communities. This show the spatial heterogenity of the study area.
Urtica dioica is a well- known indicator of fertile conditions and nitrogen-rich areas (Pigott & Taylor 1964). We found that Pteridium aquilinum, Fragaria vesca and Euphorbia amygdaloides var. amygdaloiedes may be used
FIGURE 4. CCA ordination diagram showing distribution of plant species and enviromental factors. Underlined plants are character species of associations. (Eigenvalues of axis 1: pH= -0.71, N=0.36; T= - 0.84;
as an indicator of nutrient availability. The importance of nitrogen in the terrestrial ecosystems stresses the fact that soil nitrogen indication is useful. At the same time it is more difficult to measure than soil pH or moisture (Diekmann 2003). Cornwell and Grubb (2003) reported that plant productivity was controlled by soil nutrient availability and EIVs for soil nutrient availability found to be significant with respect to species richness on a regional scale in Central Europe.
In conclusion, we found that some differences among communities with respect to EIVs for nutrient availability, soil pH and temperature. Our data revealed that these traits changed along the elevational gradient and EIVs were influenced by spatial heterogenity.
REFERENCES
Böhling, N., Greuter, W. & Raus, T. 2002. Zeigerwerte der Gefasspflanzen der Südaegeis (Griechenland). Indicator values of the vascular plants in southern Aegean (Greece).
Braun-Blanquetia 32: 1-106.
Borhidi, A. 1995. Social behaviour types, the naturalness and relative ecological indicator values of the higher plants in the Hungarian flora. Acta Botanica Hungarica 39: 97- 181. Cornwell, W.K. & Grubb, P.J. 2003. Different plant communities
from temperate deciduous forests to Mediterrean-type forests occurred in the study area because temperature. Oikos 100: 417-428.
Diekmann, M. 2003. Species indicator values as an important tool in applied plant ecology – A review. Basic and Applied
Ecology 4: 493-506.
Ellenberg, H. 1979. Zeigerwerte von Gefasspflanzen Mitteleuropas. Scripta Geobotanica 9: 1-122.
Ellenberg, H., Weber, H.E., Düll, R., Wirth, V., Werner, W. & Paulissen, D. 1991. Zeigerwerte von Pflanzen in Mitteleuropa.
Scripta Geobotanica 18: 1-248.
Fanelli, G., Pignatti, S. & Testi, A. 2007. An application case of ecological indicator values (Zeigerwerte) calculated with a simple algorithmic approach. Plant Biosystems 141(1): 15-21. Godefroid, S. & Dana, D. 2007. Can Ellenberg’s indicator values
for mediterranean plants be used outside their region of definition. Journal of Biogeography 34: 62-68.
Hardtle, W., von Oheimb, G., Friedel, A., Meyer, H. & Westphal, C. 2004. Relationship between pH values and nutrient availability in forest soils – the consequences for the use of ecograms in forest ecology. Flora 199: 134-142.
Hermy, M., Honnay, O., Firbank, L., Grashof-Bokdam, C. & Lawesson, J.E. 1999. An ecological comparison between ancient and other forest plant species of Europe and the implications for forest conservation. Biological Conservation 91: 9-22.
Hill, M.O., Preston, C.D. & Roy, D.B. 2004. PLANTATT
Attributes of British and Irish Plants: Status, Size, Life History, Geography and Habitats. Huntington, UK: Centre
for Ecology and Hydrology.
Hill, O.M., Roy, D.B., Mountford, J.O. & Bunce, R.G.H. 2000. Extending Ellenberg’s indicator values to a new area: An algorithmic approach. Journal of Applied Ecology 37(1): 3-15.
Humbert, L., Gagnon, D., Kneeshaw, D. & Messier, C. 2007. A shade tolerance index for common understory species of northeastern North America. Ecological Indicators 7: 195-207.
Kitayama, M. 1992. An altitudinal transect of the vegetation on Mount Kinabalu, Borneo. Vegetatio 102: 149-171.
Kutbay, H.G. & Kılınc, M. 1995. Bafra Nebyan Dağı (Samsun) ve çevresinin vejetasyonu üzerinde fitososyolojik ve ekolojik bir araştırma. Turkish Journal of Botany 19: 41-63. Kutbay, H.G. & Ok, T. 2003. Foliar N and P resorption and
nutrient levels along an elevational gradient in Juniperus
oxycedrus L. subsp. macrocarpa (Sibth. & Sm.) Ball. Annals of Forest Science 60: 449-454.
Landolt, E. 1977. Ökologische Zeigerwerte zur Schweizer Flora. Veröffentlichungen Des Geobotanischen Institutes der ETH,
Stiftun Rübel, Zürich 64: 1-208.
Lindacher, R. 1995. Phanart: Datenbank der Gefasspflanzen Mitteleuropas. Veröffentlichungen Des Geobotanischen Institutes der ETH, Stiftun Rübel, Zürich 125: 1-436. Mueller-Dombois, D. & Ellenberg, H. 1974. Aims and Methods of
Vegetation Ecology. New York: John Wiley and Sons. p. 547.
Pignatti, S. 2005. Biondicazione attraverso le piante vascolari. Valori di indicazione secondo ellenberg (zeigerwerte) per le speci della flora d’Italia. Braun-Blanquetia 39. Camerino, Italy.
Pigott, C.D. & Taylor, K. 1964. The distribution of some woodland herbs in relation to the supply of nitrogen and phosphorus in the soil. Journal of Ecology 52(supplement): 175-185.
Preston, C.D. & Hill, M.O. 1997. The geographical relationships of British and Irish vascular plants. Botanical Journal of the
Linnean Society 124: 1-120.
Seidling, W. & Rohner, M-S. 1993. Zusammenhange zwischen reaktions-zeigerwerten und bodenchemischen Parametern am Beispiel von Waldbodenvegetation. Phytocoenologia 23: 301-317.
Seidling, W. & Fisher, R. 2008. Deviances from expected Ellenberg indicator values for nitrogen are related to N throughfall deposition in forests. Ecological Indicators 8: 639-646.
Testi, A., Crosti, R., Dowgiallo, G., Tescarollo, P., De Nicola, C., Guidotti, S., Bianco, P.M. & Sault, A.S. 2004. Available soil water capacity as a discriminant factor in mixed oak forests of Central Italy. Annali di Botanica 4: 49-64.
van der Maarel, E. 1993. Relationships between sociological-ecological species groups and Ellenberg indicator values.
Phytocoenologia 23: 343-362.
Whittaker, R.H. 1975. Communities and Ecosystems. 2nd ed. New York: Mac Millan Publishing.
Zarzycky, K. 1984. Indicator Values of Vascular Plants in Poland (in polish). Krakow, Poland: Krakow Institute Botanica Polska Akademii Nauk.
Zelený, F., Ching-Feng, Li. & Chytrý, M. 2010. Pattern of local plant species richness along a gradient of landscape topographical heterogeneity: Result of spatial mass effect or environmental shift? Ecography 33: 578-589.
Zerbe, S. & Wirth, P. 2006. Non-indigenous plant species and their ecological range in Central European pine (Pinus
sylvestris L.) forests. Annals of Forest Science 63: 189-203.
H.G. Kutbay*
Ondokuz Mayıs Üniversitesi Fen Edebiyat Fakültesi Biyoloji Bölümü, Samsun Türkiye
B. Sürmen
Karamanoğlu Mehmetbey Üniversitesi Kamil Özdağ Fen Fakültesi
Biyoloji Bölümü, Karaman Türkiye
*Corresponding author; email: [email protected] Received: 10 March 2013