PERFORMANCE COMPARISON OF DIFFERENT SIZED REGIONS OF INTEREST ON FISH CLASSIFICATION
Bilal İŞÇİMEN1,+, Yakup KUTLU2, Cemal TURAN3
1 Kirikhan Vocational School, Mustafa Kemal University, Hatay/Turkey 2 Faculty of Engineering and Natural Sciences, Iskenderun Technical University,
Hatay/Turkey
3 Faculty of Marine Sciences and Technology, Iskenderun Technical University,
Hatay/Turkey
[email protected], [email protected], [email protected] Abstract
In this study, different sized regions of interest were obtained from fish images and these were used for fish species classification. A previously proposed region of interest obtaining method was upgraded in order to acquire wider regions of interest. Depending on general accuracies of classification performances, comparison between these regions of interest was made. According to comparison results the effects of the different sized regions of interest were discussed for classification purposes of fish species. This study was performed by using a database which consists of 1321 fish images. These fish images include fish samples from 16 fish families and 35 fish species. All images were colored in RGB color space. But two different feature sets were extracted for fishes by examining images both in RGB and HSV color spaces. Feature extraction was performed by using a color based method. For each color space, seven statistical features were extracted from each component of the color space. Two feature sets were acquired for each fish sample by combining the extracted statistical features according to color spaces. The obtained feature sets from RGB and HSV color spaces were used separately for classification purposes. Classification was performed according to families and species by using Nearest Neighbor algorithm as classifier.
According to classification results, the best performances on general accuracies were achieved as 93.5% and 91% for fish families and species classification respectively. Keywords: Fish classification, fish species, ROI, color based classification
BALIK SINIFLANDIRMASINDA FARKLI BOYUTLU İLGİ BÖLGELERİNİN PERFORMANS KARŞILAŞTIRMASI
Özet
Bu çalışmada balık fotoğraflarından farklı boyutlu ilgi bölgeleri elde edilmiş ve balık türlerinin sınıflandırılmasında kullanılmıştır. Daha önce önerilen bir ilgi bölgesi elde etme yöntemi, daha geniş ilgi bölgelerine sahip olmak için geliştirilmiştir. Sınıflandırma performansındaki genel başarımlara bağlı olarak bu ilgi bölgeleri arasında bir karşılaştırma yapılmıştır. Karşılaştırma sonuçlarına göre balık türleri sınıflandırmasında farklı boyutlu ilgi bölgelerinin etkileri tartışılmıştır. Bu çalışma 1321 balık fotoğrafı içeren bir veritabanı kullanılarak gerçekleştirilmiştir. Bu balık fotoğrafları 16 familya ve 35 türe ait balık örnekleri içermektedir. Bütün fotoğraflar RGB renk uzayında renkli fotoğraflardır. Fakat fotoğraflar hem RGB hem de HSV renk uzaylarında ele alınarak balıklar için iki farklı öznitelik seti çıkarılmıştır. Öznitelik çıkarma, renk tabanlı bir yöntem kullanılarak gerçekleştirilmiştir. Her renk uzayında, renk uzayının her bir bileşeni için yedi adet istatistiksel öznitelik çıkarılmıştır. RGB ve HSV renk uzaylarında her renk bileşeninden çıkarılan öznitelikler kendi içlerinde bir araya getirilerek her bir balık için iki farklı öznitelik seti oluşturulmuştur. Bu renk uzaylarından elde edilen öznitelik setleri sınıflandırma için ayrı ayrı kullanılmıştır. En Yakın Komşu algoritması kullanılarak familya ve tür bazında sınıflandırma yapılmıştır. Sınıflandırma sonuçlarına göre en iyi genel başarımlar familya bazında %93.5 ve tür bazında %91 olarak elde edilmiştir.
Anahtar Kelimeler: Balık sınıflandırma, balık türleri, ilgi bölgesi, renk tabanlı sınıflandırma
1. Introduction
Automatic fish classification systems’ development is getting an important task. The requirement of fish classification systems is rising from the reason that they can be used by researchers for the purposes of fish counting, stock assessments, evaluating ecological impacts, monitoring fish behavior, and ext. [1]. Additionally, the scientists believe that there are more than 1200 venomous fish species in over 24600 different fish species in the world. Avoiding from harms of the venomous species can be possible by making use of fish classification systems. In spite of the necessity for fish classification, it is a difficult task to be performed manually. The developments in computer technologies offer an insight into computer vision and image processing methods to be getting commonly used for the purposes of fish classification.
There are some studies using various features in order to classify fishes. Kutlu et al. proposed a multistage system that can separate fishes taxonomically in three stages by using morphological shape properties within Nearest Neighbor algorithm [2]. Kutlu et al. performed a fish species classification system utilizing Deep Belief Networks by using morphometric measurements [3]. Maasz et al. identified fish species with a high accuracy by applying MALDI-TOF MS method in order to extract features [4]. Hasija et al. performed the classification of fish species by using a novel method which is based on an improved image-set matching approach, which makes use of Graph-Embedding Discriminant Analysis [5]. Siddiqui et al. presented a computer vision method which is based on deep learning techniques. A cross-layer pooling algorithm using a pre-trained Convolutional Neural Network as a generalized feature detector is proposed in this work. Classification was performed by a SVM classifier for fish species from underwater video imagery [6]. Bothmann et al. used under water sonar videos to extract features which are based on shape and movement of the fishes in order to present a real time fish classification system [7]. Shafait et al. presented an image set based approach for fish species identification by utilizing from Principal Component Analysis [8]. Chuang et al. presented an unsupervised feature learning and object recognition system by using geometric attributes of the fish body within a hierarchical partial classifier [9]. Mizuno et al. performed the classification purpose by using normalized cross correlation obtained from a new method using high resolution acoustic video camera [10]. Ogunlana et al. presented a Support Vector Machine based method
for fish classification by extracting the body and five fin lengths of the fishes as features [11]. Iscimen et al. presented a method which is based on centroid-contour distances of fish images in order to classify fish species with two dorsal fins [12]. Iscimen et al. presented a Naive Bayesian classifier based system for fish families and species classification by using biometric measurement techniques [13]. D’Elia et al. used frequency response, morphometric, bathymetric or other energetic parameters as features within a multi-frequency acoustics approach to detect and classify fish species [14]. Fabic et al. described a method by using blob counting and Zernike moment-based shape analysis for fish detection, counting, and species classification from underwater video sequences [15]. Alsmadi et al. presented a fish recognition system based on features extraction from size and shape measurements using neural network [16]. Cabreira et al. applied methods on digital echo recordings of schools which involving artificial neural networks (ANNs) for the automatic recognition and classification. Energetic, morphometric, and bathymetric school descriptors were extracted from the echo-recordings as the input for the ANNs [17].
Also, there are some studies taking advantage of color and texture features for fish classification purposes. Iscimen et al. proposed a color based method for fish species classification which is using statistical features extracted from different color space’s components [18, 19]. Daramola et al. proposed a method by using Singular Value Decomposition in order to extract features of fish body pattern [20]. Huang et al. presented a balance-enforced optimized tree with reject option for the purpose of live fish recognition. The proposed system is using features which are a combination of color, shape and texture properties [21]. Hernández-Serna et al. obtained a combination of geometrical, morphological, and texture features which are extracted by using image processing methods. Fish identification was performed by using the obtained feature set within an Artificial Neural Networks classifier [22]. Chuang et al. presented an underwater fish species recognition system by using a systematic hierarchical partial classification algorithm. The extracted features are consist of size, shape and texture attributes of fish body parts [23]. Hu et al. presented a method for classifying fish species based on color and texture features by using a multi-class support vector machine [24]. Alsmadi et al. presented a fish recognition system based on features extraction from color texture measurements by using back-propagation classifier [25].
The aim of this study is obtaining wider regions of interest on fish images by upgrading a previously proposed method [18] and making comparison between classification performances of the fishes according to these regions of interest. The obtained regions of interest were used within a color based statistical feature extraction method. The features were extracted by examining images both in RGB and HSV color spaces and the acquired feature sets were used in classification separately. Classifications were performed according to families and species. The proposed system is performing various image processing methods for mentioned purposes and these are explained in detail in remaining of the paper.
2. Materials and Methods
The structure of the proposed system is consists of data acquiring, preprocessing, feature extraction, classification and performance measurement phases. Details of the processes are described in the following subsections.
2.1. Acquiring the Database
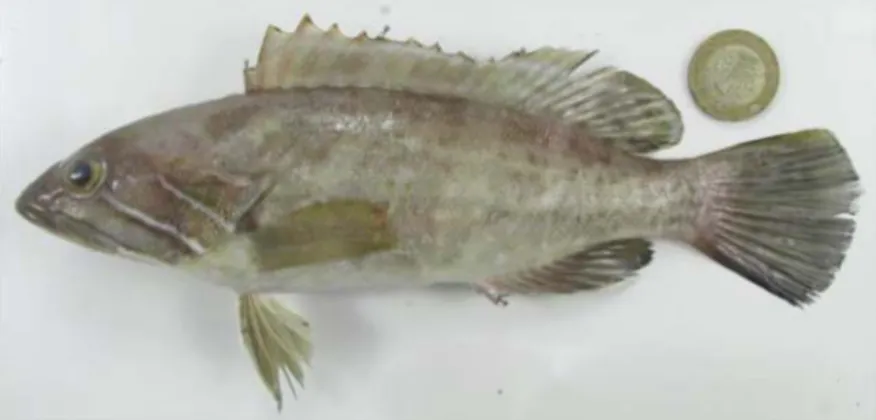
A fish database which consists of 1321 fish images was used in this study. In each image, a fish was located on a white background floor with the same position and the images were taken from different distances. Figure 1 shows a sample of taken images. The database totally consists of 35 fish species from 16 fish families. Each species include different numbers of samples. Table 1 shows variance of the collected database. The definition of species and systematic discrimination were performed according to [26].
Figure 1. A sample of taken images from database.
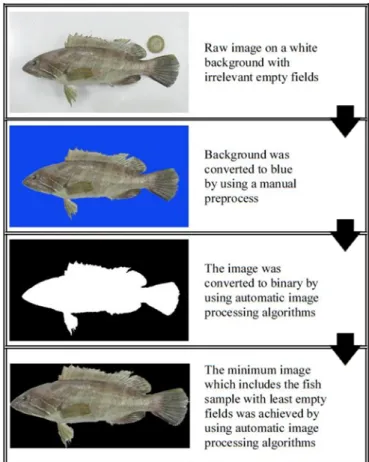
It is aforementioned that all images were taken on a white background. In spite of that, some image noises might be arise from background or environmental conditions. In an attempt to reduce the negative environmental conditions, all images’ backgrounds were manually converted to blue before image processing. The images include irrelevant empty fields apart from the fish sample. Therefore, after converting the background to blue a series of automatic image processing algorithms were applied on each image to gain the minimum image including the fish sample with least empty fields. Figure 2 shows the image processing phases from raw image to gained minimum image which includes fish sample.
Table 1. Variance of the collected database.
Families Name Species Name Number of Fish Samples
Apogonidae Apogon queketti 18
Apogonidae Apogon smithi 29
Carangidae Caranx rhoncus 8
Dactyloperidae Dactylopterus volitans 26
Haemulidae Pomadasys stridens 116
Moronidae Dicentrarchus labrax 30
Moronidae Dicentrarchus punctatus 18
Mullidae Mullus barbatus 15
Mullidae Mullus surmuletus 44
Mullidae Upeneus mollucensis 19
Nemipteridae Nemipterus randalli 18
Sciaenidae Argyrosomus regius 21
Sciaenidae Sciaena umbra 9
Sciaenidae Umbrina cirrosa 5
Scombridae Sarda sarda 128
Serranidae Epinephelus aeneus 38
Serranidae Epinephelus caninus 15
Serranidae Epinephelus costae 108
Serranidae Epinephelus marginatus 124
Serranidae Hyporthodus haifensis 17
Serranidae Mycteroperca rubra 33
Sparidae Diplodus annularis 5
Sparidae Lithognathus mormyrus 7
Sparidae Oblada melanura 15
Sparidae Pagellus erythrinus 9
Sparidae Pagrus caeruleostictus 5
Sparidae Sparus aurata 50
Synodontidae Saurida undosquamis 22
Teraponidae Pelates quadrilineaetus 18
Tetraodontidae Lagocephalus suezensis 5
Triglidae Aspitrigla cuculus 22
Triglidae Chelidonichthys lastoviza 98
Triglidae Chelidonichthys lucernus 141
Triglidae Trigla lyra 59
Total Number of Samples 1321 The following steps are performed for this task:
The colored input image was in RGB color space. This image was converted to grayscale image.
The grayscale image was converted to binary image. Canny Filter was applied for edge detection.
Edge disorders were fixed by filtering the binary image with a morphometric structure element which is shaped in a 3-by-3 matrix. The fish sample’s edges became more apparent by this process.
Missing or overflowing pixel issues were fixed by applying erosion and dilation processes.
The whole apparent area of the fish sample was detected by filling the inner sides of edges.
The minimum image was gained which includes the fish sample with least empty fields. The image was in RGB color space. The fish sample was colored and the background was black.
Figure 2. Image processing phases from raw image to gained minimum image which includes the fish sample.
Each of the fish samples takes different sized areas in images (Figure 3). This case is rising an issue about selecting region of interest. It is necessary to interest on a solid fish texture and avoid considering black background due to using a color based feature extraction method. For this purpose, each four sides of the image (left border, right border, top border, bottom border) were assumed as a frame. Each frame of the minimum image was subtracted consecutively from outside to inside until a solid fish texture remains. Figure 4 shows the actual subtraction process which is performed by subtracting one frame in per time. Figure 5 shows a representative illustration which explains the subtracting process with wider frames.
Figure 3. Fish samples from different species take different sized areas in image. The species of the fish samples: 1) Epinephelus aeneus, 2) Chelidonichthys lastoviza, 3)
Nemipterus randalli
Figure 4. Actual subtracting process. One frame is subtracting in per time.
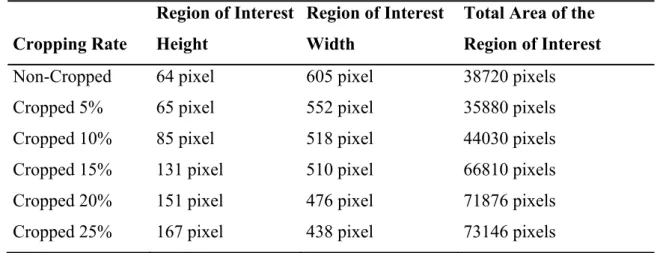
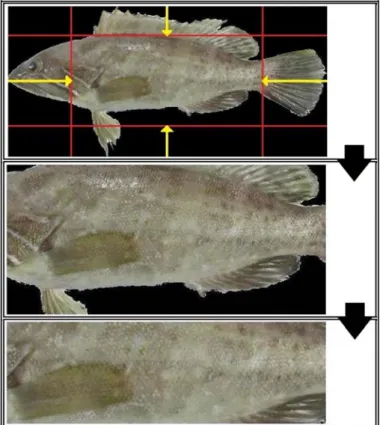
Frame subtracting process can provide wider region of interest in the event of having rectangular shaped objects on image. Fish objects’ shapes are distant from rectangular shape due to having various fins on their body and cauda. The general shape of the fishes is getting wider from mouth toward body and is getting thinner again from body toward cauda. Also same issue exists in direction from dorsal fins toward lower fins. In order to overcome this issue and obtain a more rectangular object in image, the image was cropped from its four sides. Hence, the fish object lost some of its body parts and came in a more rectangular shape. After the cropping, frame subtracting process was applied on cropped image and a wider region of interest was obtained (Figure 6). Cropping process was performed with cropping rates as 5%, 10%, 15%, 20% and 25% separately. Due to the variance on cropping rates, regions of interest with different sizes were obtained. Table 2 shows sample region of interest dimension values of some fish sample according to cropping rates. These values may vary for each different fish sample because of the size variance between fishes.
Table 2. An example of size comparison between regions of interest according to cropping rates. The given values may vary for each different fish sample. Cropping Rate
Region of Interest Height
Region of Interest Width
Total Area of the Region of Interest Non-Cropped 64 pixel 605 pixel 38720 pixels
Cropped 5% 65 pixel 552 pixel 35880 pixels
Cropped 10% 85 pixel 518 pixel 44030 pixels Cropped 15% 131 pixel 510 pixel 66810 pixels Cropped 20% 151 pixel 476 pixel 71876 pixels Cropped 25% 167 pixel 438 pixel 73146 pixels
Figure 6. Applying subtracting process after cropping the image from its four sides.
2.3. Feature Extraction
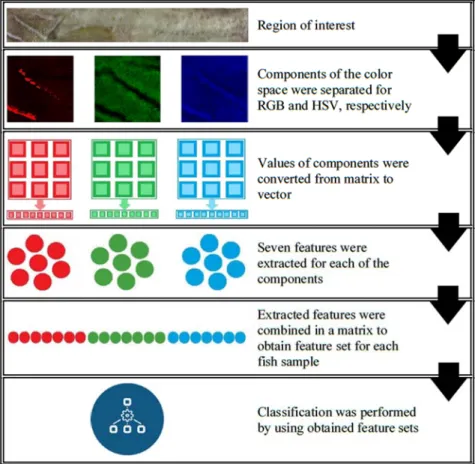
The obtained regions of interest were handled both in RGB and HSV color spaces. Feature sets for both color spaces obtained and used separately for classification purposes. Feature extraction performed by using the red, green, blue components of the RGB color space and hue, saturation, value components of the HSV color space separate from each other. Values of the color spaces’ components were in a matrix that having same dimension with the region of interest image which they belong to. Since each obtained region of interest image has different dimensions, the number of extracted features may vary according to row and column sizes of the images. In order to fix this issue, values of the color spaces’ components were converted from matrix to a vector before feature extraction. Afterwards, seven statistical features were extracted from these vectors for each of these components respectively. The extracted features from three components of the color space were combined in a new vector in order to obtain the feature set of the fish samples. Hence, there were totally 21 features in each feature set. The extracted features are minimum value, maximum value, mean value, variance, standard deviation, kurtosis, skewness. Figure 7 shows the phases of feature extraction from region of interest to classification.
Figure 7. Phases of feature extraction.
2.4. Classification and Performance Measurement
Classification purposes were performed by using Nearest Neighbor algorithm [27]. In this method, an unclassified sample of data is compared with all classified samples applying the Euclidian Distance method on their features. The class of the unclassified sample is selected as the class of its nearest neighbor which has the nearest distance to unclassified sample.
Performance measurement was performed by using five-fold cross validation schema. The 5-fold cross validation process is performed by dividing randomly the dataset in 5 disjoint sets. The four of divided sets are used for the purposes of training and the remaining one is used for testing. This procedure is repeated along a period of time in a process of using each set for testing. Performance of classifications was measured in terms of general accuracies.
3. Conclusion
This study purposed an approach to obtain different sized regions of interest and make comparison between their classification performances by using them within a
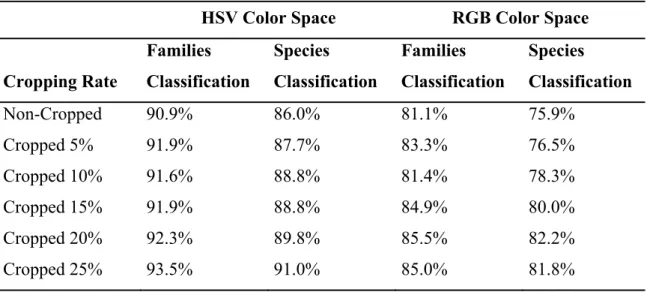
color based statistical feature extraction method. All images were preprocessed to obtain a minimum image including a colored fish sample with a black background. The obtained images were cropped from their four sides with cropping rates from 5% to 25% increasing by fives. Hence, regions of interest with different sizes were obtained according to each cropping size. These regions of interest examined in RGB and HSV color spaces separately. The acquired feature sets from RGB and HSV color spaces were used separately for classification. Classification purposes were performed according to families and species by using the Nearest Neighbor algorithm as classifier. Table 3 shows a comparison of classification results between non-cropped images’ and cropped images’ features in terms of general accuracy achievement.
Table 3. Comparison of classification performances.
HSV Color Space RGB Color Space
Cropping Rate Families Classification Species Classification Families Classification Species Classification Non-Cropped 90.9% 86.0% 81.1% 75.9% Cropped 5% 91.9% 87.7% 83.3% 76.5% Cropped 10% 91.6% 88.8% 81.4% 78.3% Cropped 15% 91.9% 88.8% 84.9% 80.0% Cropped 20% 92.3% 89.8% 85.5% 82.2% Cropped 25% 93.5% 91.0% 85.0% 81.8%
The compared results show that cropping the images is raising the classification performances according to non-cropped images. All cropped images’ performances better than non-cropped images. Also the increment of the classification performance is getting higher on cropped images as long as increasing the cropping rate. This fact has an inaccuracy for just 4 classification results in total of 20 classification results of cropped images. Additionally, this study shows that the proposed color based feature extraction method provides much better performance by using HSV color space than using RGB color space for both families and species classification. Also, families classification has greater results according to species classification for both of the color spaces in all cropping rates. As a result, 1321 fish samples from 16 families and 35
species were classified with best general accuracies of 93.5% and 91% for families and species classification respectively.
Table 2 shows that increasing the cropping size increases the row sizes and decreases the column sizes of the regions of interest. This fact might be arise from cropping the images with the same rate along the X axis (left border and right border) and the Y axis (top border and bottom border). Using different cropping rates for the X and Y axises might cause to have more field that can be used as region of interest. References
[1] Benson B, Cho J, Goshorn D, Kastner R. Field programmable gate array (FPGA) based fish detection using Haar classifiers. American Academy of Underwater Sciences 2009.
[2] Kutlu Y, Iscimen B, Turan, C. Multi-Stage Fish Classification System Using Morphometry. Fresenius Environmental Bulletin 2017; 26(3): 1911-1917.
[3] Kutlu Y, Altan G, İşçimen B, Doğdu SA, Turan C. Recognition of species of Triglidae Family using Deep Learning. Journal of the Black Sea/Mediterranean Environment 2017; 23(1): 56-65.
[4] Maasz G, Takács P, Boda P, Varbiro G, Pirger Z. Mayfly and fish species identification and sex determination in bleak (Alburnus alburnus) by MALDI-TOF mass spectrometry. Science of The Total Environment 2017; 601: 317-325. [5] Hasija, S., Buragohain, M.J., Indu, S., 2017, Fish Species Classification Using
Graph Embedding Discriminant Analysis, International Conference on Machine
Vision and Information Technology (CMVIT), Singapore, 81-86.
[6] Siddiqui SA, Salman A, Malik MI, Shafait F, Mian A, Shortis MR, Harvey ES. Automatic fish species classification in underwater videos: exploiting pre-trained deep neural network models to compensate for limited labelled data. ICES Journal of Marine Science, 2017.
[7] Bothmann L, Windmann M, Kauermann G. Realtime classification of fish in underwater sonar videos. Journal of the Royal Statistical Society: Series C (Applied Statistics), 2016; 65(4): 565-584.
[8] Shafait F, Mian A, Shortis M, Ghanem B, Culverhouse PF, Edgington D, Cline D, Ravanbakhsh M, Seager J, Harvey ES. Fish identification from videos
captured in uncontrolled underwater environments. ICES Journal of Marine Science: Journal du Conseil, 2016; 73(10): 2737-2746.
[9] Chuang MC, Hwang JN, Williams KA. Feature Learning and Object Recognition Framework for Underwater Fish Images. IEEE Transactions on Image Processing, 2016; 25(4): 1862-1872.
[10] Mizuno, K., Liu, X., Asada, A., Ashizawa, J., Fujimoto, Y., Shimada, T., 2015, Application of a high-resolution acoustic video camera to fish classification: An experimental study, IEEE Underwater Technology (UT), India, 1-4.
[11] Ogunlana SO, Olabode O, Oluwadare SAA, Iwasokun GB. Fish Classification Using Support Vector Machine. African Journal of Computing & ICT, 2015; 8(2): 75-82.
[12] Iscimen, B., Kutlu, Y., Uyan, A., Turan, C., 2015, Classification of fish species with two dorsal fins using centroid-contour distance, 23nd Signal Processing
and Communications Applications Conference (SIU), Malatya-Turkey,
1981-1984.
[13] Iscimen, B., Kutlu, Y., Reyhaniye, A. N., Turan, C., 2014, Image analysis methods on fish recognition, 22nd Signal Processing and Communications
Applications Conference (SIU), Trabzon-Turkey, 1411-1414.
[14] D’Elia M, Patti B, Bonanno A, Fontana I, Giacalone G, Basilone G, Fernandes PG. Analysis of backscatter properties and application of classification procedures for the identification of small pelagic fish species in the Central Mediterranean. Fisheries Research, 2014; 149: 33-42.
[15] Fabic, J.N., Turla, I.E., Capacillo, J.A., David, L.T., Naval, P.C., 2013, Fish population estimation and species classification from underwater video sequences using blob counting and shape analysis, IEEE International
Underwater Technology Symposium (UT), Tokyo-Japan, 1-6.
[16] Alsmadi MK, Omar KB, Noah SA, Almarashdeh I. Fish recognition based on robust features extraction from size and shape measurements using neural network. Journal of Computer Science, 2010; 6 (10): 1088.
[17] Cabreira AG, Tripode M, Madirolas A. Artificial neural networks for fish-species identification. ICES Journal of Marine Science, 2009; 66(6): 1119-1129. [18] Iscimen B, Kutlu Y, Turan C. Classification of Serranidae Species Using Color
Based Statistical Features. Natural and Engineering Sciences, 2017; 2(1): 25-34. [19] Iscimen, B., Kutlu, Y., Turan, C., 2017, Classification of Fish Families Using
Texture Analysis. The 3rd International Symposium on EuroAsian Biodiversity
(SEAB), Minsk-Belarus, 23.
[20] Daramola SA, Omololu O. Fish Classification Algorithm using Single Value Decomposition. International Journal of Innovative Research in Science, Engineering and Technology, 2016; 5(2): 1621-1626.
[21] Huang PX, Boom BJ, Fisher RB. Hierarchical classification with reject option for live fish recognition. Machine Vision and Applications, 2015; 26 (1): 89-102.
[22] Hernández-Serna A, Jiménez-Segura LF. Automatic identification of species with neural networks. PeerJ, 2014; 2: e563.
[23] Chuang, M.C., Hwang, J.N., Kuo, F.F., Shan, M.K., Williams, K., 2014, Recognizing live fish species by hierarchical partial classification based on the exponential benefit, IEEE International Conference on Image Processing
(ICIP), Paris-France, 5232-5236.
[24] Hu J, Li D, Duan Q, Han Y, Chen G, Si X. Fish species classification by color, texture and multi-class support vector machine using computer vision. Computers and Electronics in Agriculture, 2012; 88: 133-140.
[25] Alsmadi MK, Omar KB, Noah SA, Almarashdeh I. Fish recognition based on robust features extraction from color texture measurements using back-propagation classifier. Journal of Theoritical and Applied Information Technology, 2010; 18(1): 11-18.
[26] Turan C, Erguden D, Gürlek, M, Yaglioglu D, Keskin Ç. Atlas and systematics of marine Bony fishes of Turkey. Adana: Nobel; 2007.
[27] Cunningham P, Delany SJ. k-Nearest neighbour classifiers. Multiple Classifier Systems, 2007; 34: 1-17.