Materials Science in Semiconductor Processing 109 (2020) 104945
Available online 14 January 2020
1369-8001/© 2020 Elsevier Ltd. All rights reserved.
Green preparation of Carbon Quantum dots using Gingko biloba to sensitize
TiO
2
for the photohydrogen production
Munevver Tuna Genc
a, Gizem Yanalak
b, Gulsin Arslan
b, Imren Hatay Patir
a,* aSelcuk University, Department of Biotechnology, 42030, Konya, TurkeybSelcuk University, Department of Biochemistry, 42030, Konya, Turkey
A R T I C L E I N F O Keywords:
Carbon quantum dots
Photocatalytic hydrogen evolution TiO2
Gingko biloba
A B S T R A C T
Carbon Quantum dots (CQDs) were obtained from Gingko biloba by using microwave technique, which is easy, time-saving, cost-effective, non-toxic and environmental friendly way. TiO2 were sensitized by green-prepared
CQDs to obtain CQDs/TiO2 composite. The characterizations of the CQDs and CQDs/TiO2 were performed by
Transmission Electron Microscopy (TEM), high-resolution TEM (HR-TEM), X-ray Diffraction (XRD), X-ray Photoelectron Spectroscopic (XPS), Photoluminescence (PL) and Fourier Transformed Infrared (FT-IR) spec-troscopy. The photocatalytic hydrogen evolution activity of CQDs/TiO2 system was studied under visible light (λ
>420 nm) irradiation in the aqueous solution by using triethanolamine (TEOA) as a sacrificial electron donor. When Pt was used as a co-catalyst, CQDs/TiO2/Pt exhibited improved hydrogen evolution rate (1502 μmol
h 1g 1) compared to CQDs/TiO2 composite (665 μmol h 1g 1).
1. Introduction
Demand for cost-effective, clean and renewable energy sources were drastically increasing all around the world. In addition, global warming and the resulting climate change reinforce the importance of finding renewable energy sources. At this point, hydrogen energy emerges as a promising choice. The hydrogen evolution reaction (HER), electro-catalytic or photoelectro-catalytic splitting of water, is an important process to conversion of energy via hydrogen production [1,2]. In order to improve HER efficiency, many photocatalyst, which can convert solar energy to chemical energy, were studied very intensively. TiO2, which was used
commonly in the semiconductor-based hydrogen production system, is known as a stable, environmentally friendly, abundant, cost-effective and non-toxic photocatalyst [3,4]. Titanium oxide-P25 is the most intensively studied photocatalyst for water splitting after first studies of the photoelectrochemical water splitting by Honda-Fujishima in 1972 [5]. Many articles have also been published [6–9] discussing the various features of the photocatalytic water splitting, such as fundamental principles, nature (optical properties, morphology and surface charac-teristics of the photocatalyst, role of co-catalyst/sacrificial reagents, mechanism, kinetics, etc.) Although TiO2 is most commonly used
pho-tocatalyst, solar-to-hydrogen energy conversion efficiency of TiO2 is still
low owing to fast backward reaction, recombination of photo-generated
electron-hole pairs and inability to utilize visible light. Several strategies have been employed to resolve those problems, such as addition of electron donors [10–13], dye sensitization [14–17], noble metal loading [18–20], metal ion [21,22] and anion doping [23,24]. For example, Sreethawong and co-workers were prepared Cu, Pd and Au loaded nanocrystalline mesoporous TiO2, which was used as a photocatalyst
and their efficiency of photocatalytic hydrogen evolution was compared [25]. In another study, Yuan et al. were reported N-doped TiO2 from
urea and titanium tetrachloride has more efficient photocatalytic HER activity than bare TiO2 [26]. Moreover, eosin-Y sensitized N-doped TiO2
was showed better photocatalytic hydrogen evolution efficiency than N-doped TiO2 [27]. Recently, it has been found that CQDs have been
efficiently used to sensitize TiO2 [28–31].
Because of their unique properties like low cytotoxicity, fit chemical inertness, water solubility, low cost, environmental friendliness, outstanding stability against photobleaching, perfect up-converting and size dependent photoluminescence, CQDs have captured increasing attention for photocatalytic hydrogen production applications [32]. Till now, hydrothermal synthesis [33,34], oxidation [35] and microwave techniques have been used for the synthesis of CQDs. Zu et al. were reported economical and time saving microwave method, which was used synthesis of fluorescent nanoparticles. After this study, a clean, cheap, cost-saving, non-cytotoxic, time-saving and inexpensive
* Corresponding author.
E-mail address: [email protected] (I.H. Patir).
Contents lists available at ScienceDirect
Materials Science in Semiconductor Processing
journal homepage: http://www.elsevier.com/locate/mssp
https://doi.org/10.1016/j.mssp.2020.104945
microwave synthesis technique was an excellent alternative for the studies to be performed [36].
Till now, CQDs were synthesized from many natural or synthetic materials easily [37]. For example, bacteria [38], ginger and galangal herbs [39], cinnamon, red chilli, turmeric, black pepper [40], water-melon peel, sugarcane juice, orange juice, lemon, strawberry juice,
co-workers also showed that CQDs sensitized TiO2 nanotube arrays
plays as a role an efficient photoelectrochemical hydrogen evolution under visible light [45]. Saud and co-workers were searched the pho-tocatalytic and antibacterial activities of CQDs/TiO2 nanofibers [46]. In
another study, CQDs/TiO2 composites were prepared with the aim of
hydrothermal method and efficient photocatalytic hydrogen evolution results were reported by Yu et al. [32]. CQDs modified onto TiO2 via
hydrothermal synthesis technique and the photocatalytic HER efficiency of CQDs/TiO2 composite were studied [47]. In addition, CQDs/TiO2
composite were synthesized with the help of hydrothermal method and their photocatalytic activities were reported by Mind and co-workers [48].
In this study, the green synthesized CQDs from Gingko biloba by using microwave irradiation was used to the photosensitization of TiO2
pho-tocatalyst for the photocatalytic and photoelectrochemical HER in the visible region. The morphologies and optical properties of CQDs and CQDs/TiO2 composite prepared via hydrothermal method have been
investigated TEM, HR-TEM, XRD, XPS, PL and FT-IR techniques. CQDs/ TiO2 composite have been used in the photocatalytic HER with and
without loading Pt co-catalyst by using TEOA as an electron donor. Moreover, the photoelectrochemical and photocatalytic activities of CQDs/TiO2 were investigated under visible light irradiation. A
mecha-nism is also proposed for photocatalytic HER.
2. Experimental section
2.1. Chemicals
Fresh Gingko biloba, taken from Antalya Forestry Directorate, were dried at room temperature. Before the production of CQDs process, dehydrated Gingko biloba leaves were ground to powder. Triethanol-amine (TEOA, 97%), hydrochloric acid (HCl), chloroplatinic acid hexahydrate (H2PtCl6.6H2O), TiO2 powder (21 nm primary particle
size) (Degussa P25), ethanol (CH3CH2OH) and methanol (CH3OH)
gradient grade for liquid chromatography were provided by Sigma- Aldrich. TiO2 coated electrodes (transparent) and sodium sulfate
(Na2SO4, anhydrous �99.0%) and were supplied by Dyesol and Sigma,
respectively.
2.2. Synthesis of CQDs from Gingko biloba
The CQDs were synthesized from Gingko biloba via microwave syn-thesis technique. Shortly, different amount of dry Gingko biloba leaves (1, 3, 5 g) and 50 mL of deionized water were added into volumetric flask and that prepared solution was exposed in microwave irradiation (400 W–800 W) at different time scale (1, 3, 5, 7, 10 min). Then, het-erogonous brownish mixture was centrifugated at 4500 rpm for 20 min and supernatant was obtained. Finally, to supply homogenous brownish solution of CQDs, supernatant was filtered with the help of Millex–GP Syringe Filter Unit (0.40 μm) and vacuum freeze dried.
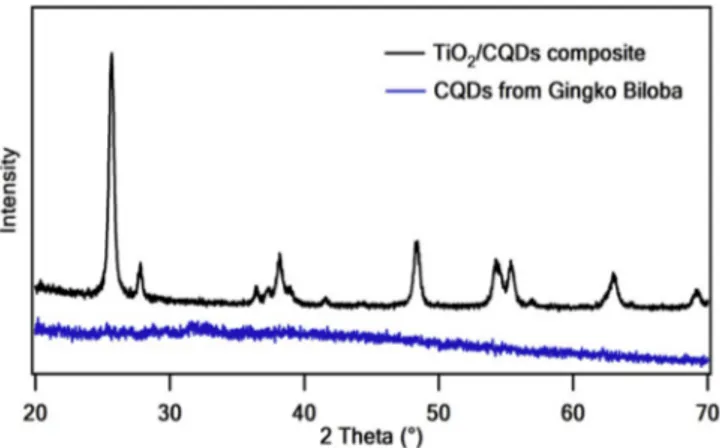
Fig. 2. XRD diffraction patterns of CQDs and CQDs/TiO2 composite.
2.3. Synthesis of CQDs/TiO2 composite
The CQDs/TiO2 composite was obtained via hydrothermal method. Firstly, liquid solution was prepared from distilled water (20 mL) and ethanol (6 mL). Then, to obtain optimum CQDs/TiO2, different amounts
CQDs (1 wt%-CQDs/TiO2, 2 wt%-CQDs/TiO2, 4 wt%-CQDs/TiO2, 6 wt
%-CQDs/TiO2) (Fig. S1) and 0.4 g Degussa P 25 were added into the
same liquid solution, according to literature [15]. Prepared solution was vigorously stirred for 4 h at 25 �C, in order to obtain uniform solution.
After that, uniform solution was transferred into Teflon coated autoclave and solution was warmed at 160 ̊C for 4 h. After natural cooling, CQDs/TiO2 composite was obtained with the help of centrifugation for
5 min at 4500 rpm. Finally, obtained composite was washed with deionized water until the aqueous phase was colorless and dried at room
temperature.
2.4. Photocatalytic hydrogen evolution tests
Photocatalytic reactions were performed in a 135 mL volumetric Pyrex flask and stamped with rubber septa. Firstly, 10 mg sample of CQDs/TiO2 photocatalyst with and without using Pt cocatalyst were
mixed into deoxygenated TEOA solution (%5 w/w, 20 mL) in the glo-vebox. Aqueous TEOA solution (0.33 M) was adjusted pH from 7.00 to 10.0. That suspension was sonicated for 5 min in order to homogeni-zation. The light source (300 W) equipped with an ultraviolet-blocking filter was used to irradiate (λ � 420 nm). Taken gas sample from Pyrex flask was injected into gas chromatography to detect the produced hydrogen amount hourly.
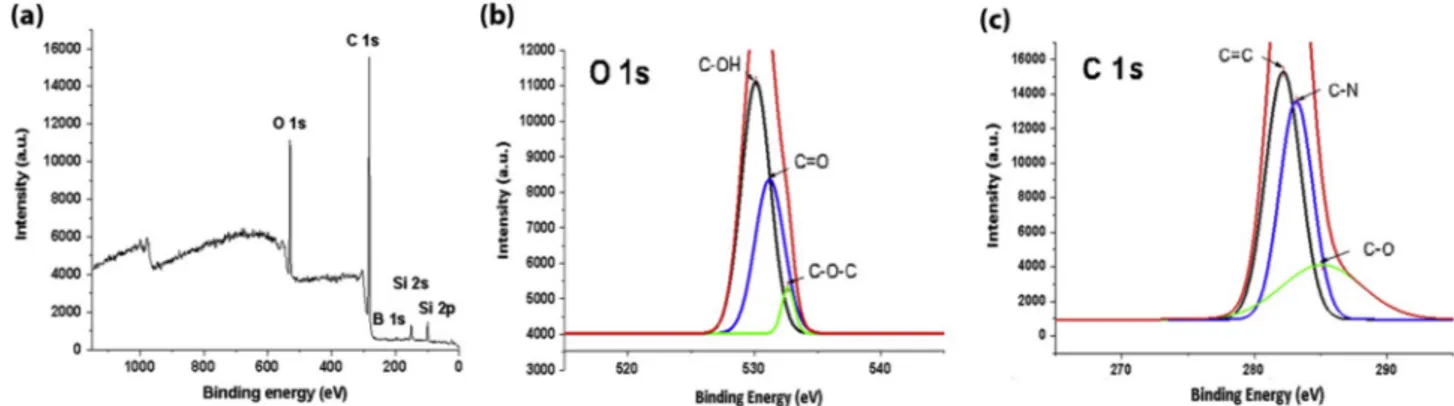
Fig. 4. XPS spectrum of CQDs from Gingko biloba and high resolution XPS spectra of O 1s and C 1s signals.
2.5. Photoelectrochemical hydrogen evolution tests
Linear sweep voltammetry (LSV) and chronoamperometry (CA) methods were used to measure the photoelectrochemical HER activities in the TEOA/Na2SO4 aqueous solution (0.1 M). Three electrode cells
were used to investigate photoelectrochemical properties of CQDs/TiO2
composites. The prepared CQDs/TiO2 composite electrodes were used as
a working electrode. Ag/AgCl and Pt-wire were served as a reference electrode and counter electrode, respectively. Linear sweep voltamme-try has been performed from 0.2 V to 0.6 V scan region. Chro-noamperometric experiments have been carried out for 350 s (50 s light on/off periods) [33].
2.6. Characterization
CQDs synthesis from Gingko biloba leaves was carried out with
microwave oven (Mars CEM). The TEM characterization of CQDs/TiO2
and CQDs was performed JEOL JEM -2100 (UHR- Ultra High Resolu-tion). The CQDs FT-IR spectra were registered with a Bruker Vertex 70 spectrophotometer scanning from 4000 to 500 cm-1. XPS tests were performed on a Thermo Scientific K-Alpha X-ray Photoelectron Spec-trometer. XRD measurements were performed on a Bruker D8 Advance X-ray diffractometer; 2θ angle was scanned between 0̊ and 90̊ at scan rate of 3�/min. Photoluminescence studies were performed on Perkin
Elmer LS 55 instrument (Perkin Elmer, Cambridge, UK). The photo-catalytic hydrogen evolution reactions of CQDs/TiO2 and CQDs/TiO2/Pt
composite were irradiated with cut-off filter λ � 420 nm, Solar Light XPS-300™. The evolved hydrogen amount was determined by Gas Chromatography (GC; Shimadzu GC-2010 Plus, molecular sieve 5 A, thermal conductivity detector (TCD) and argon as the carrier gas).
Fig. 6. UV–Vis Absorption spectra of CQDs (a), the fluorescence spectra of the CQDs at the different excitation wavelengths ranging from 300 to 440 nm with differences of 20 nm (b), the fluorescence spectra of CQDs which exposed different synthesis time (c), the fluorescence spectra of different amount of CQDs (d).
3. Results and discussion
3.1. Characterization of CQDs and CQDs/TiO2 composite
3.1.1. TEM characterization of the CQDs and CQDs/TiO2 composite
The TEM and HR-TEM characterization results of CQDs and CQDs/ TiO2 composite were presented in Fig. 1. The size of characterized
spherical CQDs was change between 15 nm and 20 nm. In Fig. 1b, CQDs/ TiO2 composite shape was also spherical and small than 20 nm. Besides,
the HR-TEM image of CQDs and TiO2 can also be observed as pointed out
in white arrows in Fig. 1b. TEM image of pure TiO2 was also shown in SI
Fig. S2.
3.1.2. XRD diffraction patterns of the CQDs and CQDs/TiO2 composite
The XRD patterns of CQDs and CQDs/TiO2 composite were shown in
Fig. 2. In addition, the XRD spectrum of pure TiO2 was shown in SI
Fig. S3. The XRD pattern of the CQDs had graphitic crystallinity peaks at 2θ ¼ 16� �
of 25.3 [20]. The XRD of the CQDs/TiO2 composite exhibited
characteristic anatase form of TiO2 phase peaks at 2θ values of 25.7,
38.1, and 48.40. Moreover, in the XRD pattern of CQDs/TiO2 composite
at 2θ, rutile form of TiO2 peaks at 27.8, 36.5, 41.6, 54.3, 62.5, and 69.10
[30]. There were no characteristic diffraction peaks of carbon in the CQDs/TiO2 composite because of the low content of CQDs [34,35].
According to the concordance of TEM and XRD results, it is understood that the CQDs and CQDs/TiO2 composites with desired properties could
be obtained from synthesis and sensitization processes.
3.1.3. FT-IR spectra of the CQDs and CQDs/TiO2 composite
FT-IR spectra of CQDs and CQDs/TiO2 composite were performed
and their infrared spectra were analyzed as shown in Fig. 3. That infrared spectra of CQDs showed O–H (3361 cm 1), C–H (2959 cm 1),
C–O (1662 cm 1), C–C (1537 cm 1), C–N (1436 cm 1) stretching
vi-brations [43,49]. Moreover, CQDs/TiO2 composite absorption peaks at
3000–3500 and 1600–1700 were attributed O–H, and C–O, respectively [46].
3.1.4. XPS pattern of the CQDs and CQDs/TiO2 composite
XPS was used to surface and elemental characterizations of the CQDs and CQDs/TiO2. XPS spectrum of CQDs demonstrate two peaks at 282
and 530 eV which are attributed to the C 1s and O 1s, respectively (Fig. 4) [50]. Other peaks at 197, 151, and 100 eV are B 1s, Si 2s and Si 2p respectively. XPS results demonstrate that CQDs which taken from
Gingko biloba contain 80.5% C 1s, 13.6% O 1s, 4.6% Si 2p, and 1.4% B
1s. As a result, synthesized CQDs have major amount of carbon, oxygen and trace amount of silicium, boron elements which may come from the
Gingko biloba leaves. The O 1s spectrum demonstrate three peaks at
530.1, 531.2, and 532.7 which are attributed to the C–OH, C––O, and C–O–C, respectively. The C 1s spectrum demonstrate three peaks at 282.2, 283.2, and 285.1 which are attributed to the C––C, C–N, and C–O, respectively [51]. In the CQDs/TiO2 spectrum shows three peaks O 1s, C
1s, and Ti 2p which are attributed to 54.9%, 28.0%, and 17.1% atomic percentage, respectively (Fig. 5). In the CQDs/TiO2 spectrum oxygen
and carbon binding energies lower than bare CQDs spectrum [42]. The C 1s spectrum show two major peaks at 283.1, and 286.5 which are attributed to the C–C/C––O, and C–O, respectively [44]. The O 1s spectrum of the CQDs/TiO2 show two peaks at 527.3, and 528.1 which
are attributed to the C––O, C–O–C/C–OH, respectively. The Ti 2p spectrum show two peaks at 455.8, and 461.3 which attributed to the Ti 2p1, and Ti 2p3, respectively [32]. These XPS results were coherent with FT-IR and XRD results which showed above.
3.1.5. UV–Vis absorption and fluorescence properties of the CQDs and CQDs/TiO2 composite
The photophysical properties of the CQDs were investigated ac-cording to their absorbance and fluorescence property. As shown in
Fig. 6a, maximum absorption shoulders of the CQDs were observed at 264 nm and 340 nm in the UV–Vis spectrum. The absorption peak of
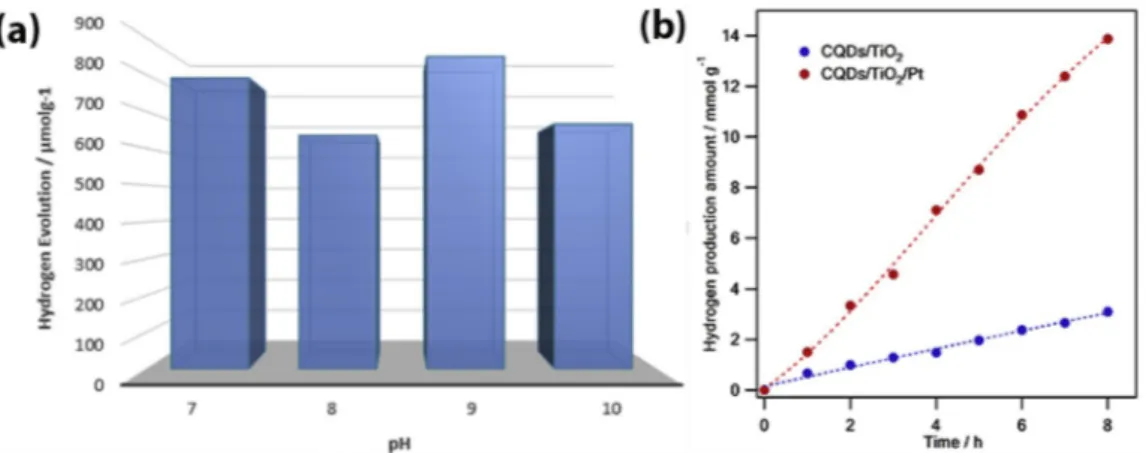
Fig. 8. The influence of pH on the photocatalytic H2 evolution activity for CQDs/TiO2 (a), the photocatalytic hydrogen evolution activity of CQDs/TiO2 and CQDs/
TiO2/Pt (b).
Fig. 9. The reusability experiment results of CQDs/TiO2 composite in the
CQDs at 264 nm was represented to the π-π* transition of the aromatic
C––C bond from the carbon core, which is similar to that of polycyclic aromatic hydrocarbons. The other absorption peak of CQDs at 340 nm was attributed contribution of the n-π* transition [52,53]. Fig. 6b was
shown the PL spectra of the synthesized CQDs with excitations at 300, 320, 340, 360, 380, 400, 420 and 440 nm. Excitation at 420 nm of CQDs at aqueous solution led to the maximum of corresponding emission peak at 479 nm. Additionally, PL spectra were shown the effect of time and amount of the CQDs to achieve optimum conditions for photocatalytic performance (Fig. 6c–d). Fig. 6c shows that the synthesis time of 10 min is more effective in CQD synthesis. Furthermore, Fig. 6d shows that 1 g of dried Gingko biloba has the highest CQD synthesis yield.
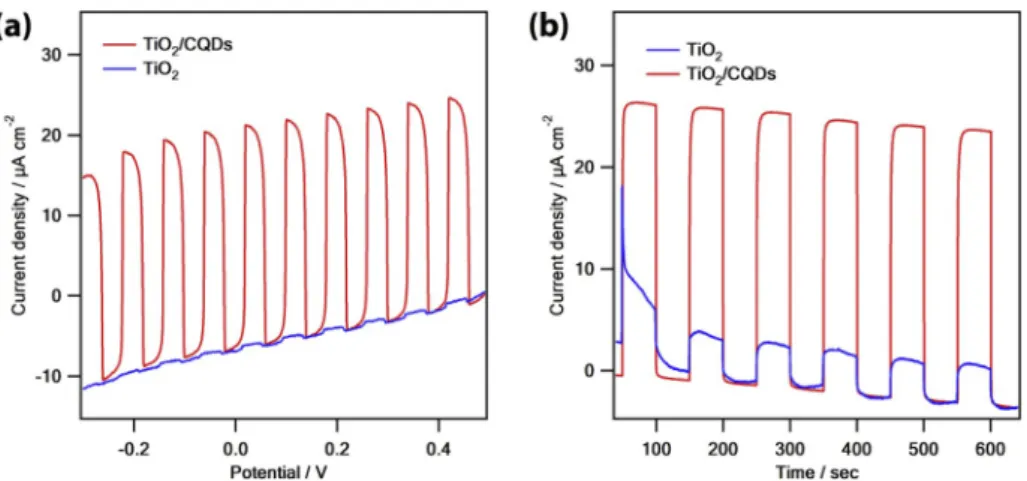
3.2. Photoelectrochemical hydrogen evolution of CQDs and CQDs/TiO2 composite
In order to verify the enhancing photocatalytic H2 activity of CQDs/
TiO2, photoelectrochemical HERs have been performed by linear sweep
voltammetry (LSV) and chronoamperometry methods (CA) in the 0.1 M Na2SO4 as an electrolyte and 0.3 M TEOA aqueous solution as an
elec-tron donor under visible light source. In the LSV measurements (Fig. 7a), the photocurrent density of TiO2/CQDs electrode was better than bare
TiO2. Secondly, chronoamperometric experiments (Fig. 7b) have been
performed after LSV experiments with several on-off cycles during 350 s (50 s light on and 50 s light off). The photocurrent values of TiO2 and
CQDs/TiO2 increased directly as soon as light was turn on and then
decreased to zero the incident light was turn off. The measurements indicated that the CQDs/TiO2 composite has stronger photocurrent
density in comparison with bare TiO2 under illumination. The obtained
stable photocurrent density of CQDs/TiO2 is consistent with HER
ac-tivity. This enhanced photocurrent response of CQDs/TiO2 can be
attributed to the high amount of photoinduced carriers and enhanced the separation efficiency of holes and electrons [11,16].
3.3. Photocatalytic HERs of CQDs/TiO2 and CQDs/TiO2/Pt
The photocatalytic HERs were performed in the TEOA as an electron donor and under the visible-light irradiation. TiO2, Pt, and CQDs were
used as the proton reduction photocatalyst, co-catalyst, and photo-absorber, respectively. There is no hydrogen gas detected using only TiO2, only CQDs, Pt/CQDs and mixing of Pt/TiO2 in this photocatalytic
HER system. In order to determine optimum conditions for best photo-catalytic activity, the amount of CQDs (SI Fig. S2) and pH optimization experiments were performed. The optimum ratio was attained for 4 ml CQDs/0.4 gTiO2 (SI Fig. S2). The optimum pH was found to be as the 9,
in accordance with our previous experiments (Fig. 8a) [54]. In addition, the hydrogen amount is decreased at both more basic and acidic pH values. In the basic medium, the photocatalytic hydrogen activity of CQDs/TiO2 was diminished due to the protonation of catalyst. In case of
more acidic pH conditions, the protonation of TEOA which would lead to diminished efficiency of TEOA as a sacrificial electron donor. Then CQDs/TiO2 and CQDs/TiO2/Pt composites were irradiated in the same
hydrogen evolution system under room temperature. As shown in
Fig. 8b the HER quality of CQDs/TiO2 and CQDs/TiO2/Pt composites
were studied from 1 to 8 h. After 1 h irradiation, the HER rates of CQDs/TiO2 and CQDs/TiO2/Pt were found 665, 1502 μmol h 1g 1,
respectively. After 8 h irradiation, the HER rates of CQDs/TiO2 and
CQDs/TiO2/Pt composites were measured as a 3095, 13876 μmol g 1,
respectively. Herein, Pt metal cocatalyst was obtained by reducing chloroplatinic acid (H2PtCl6) and used to enhance the photocatalytic
hydrogen activity on TiO2/CQD surfaces. The photocatalytic hydrogen
production increased linearly both CQDs/TiO2 and CQDs/TiO2/Pt
composites from 1 to 8 h under the visible light irradiation.
The reusability test of CQDs/TiO2 composite up to fourth cycle was
also shown that the CQDs/TiO2 can be reused without reducing activity
(Fig. 9).
The mechanism of hydrogen production is related conduction band levels of TiO2, CQDs and Pt (Fig. 10). Firstly, CQDs are absorbed the
visible light and photoexcited electrons transferred to the LUMO level. Then, due to the more negative CB levels of TiO2, these photoexcited
electrons can be transferred easily from the LUMO level to the CB level. Without any addition of co-catalyst, water can be reduced by photoex-cited electrons to evolve hydrogen gas on the CB levels of TiO2. In the
presence of Pt (used as a co-catalyst) photoexcited electrons are trans-ferred from TiO2 surface to Pt surface and the hydrogen gas can be
evolved on the co-catalyst surface. TEOA plays as a hole scavenger for the regeneration of the system [32,42].
4. Conclusions
In this study, green synthesized CQDs from Gingko biloba were uti-lized for the TiO2 sensitization in the photohydrogen evolution under
visible light irradiation. The photocatalytic HER rate of CQDs/TiO2
system is found as 665 μmol h 1g 1. The photocurrent response of the
CQDs/TiO2 composite was approximately 10 times higher comparing to
bare TiO2. Moreover, when Pt co-catalyst was used, CQDs/TiO2/Pt
system showed higher photocatalytic activity (1502 μmol h 1g 1) than
CQDs/TiO2 composite. These results showed that green synthesis of
CQD by microwave assisted method and sensitization of TiO2 by
hy-drothermal method with CQDs are more advantageous and the prepared photocatalyst were more effective in hydrogen evolution reactions. This fast and environmentally friendly production of CQDs from Ginkgo
biloba will make it a preferred choice in many other energy fields.
Author statement
The whole article is realized by all authors, which are Munevver Tuna Genc, Gizem Yanalak, Prof. Dr. Gulsin Arslan and Prof. Dr. Imren Hatay Patir.
Declaration of competing interest
The authors declare that they have no known competing financial interests or personal relationships that could have appeared to influence the work reported in this paper.
Appendix A. Supplementary data
Supplementary data to this article can be found online at https://doi. org/10.1016/j.mssp.2020.104945.
References
[1] J. Mahmood, F. Li, S.-M. Jung, M.S. Okyay, I. Ahmad, S.-J. Kim, N. Park, H. Y. Jeong, J.-B. Baek, Nat. Nanotechnol. 12 (2017) 441.
[2] J. Wang, C. Li, Q. Zhou, W. Wang, Y. Hou, B. Zhang, X. Wang, Dalton Trans. 45 (2016) 5439–5443.
[3] C.-H. Liao, C.-W. Huang, J. Wu, Catalysts 2 (2012) 490–516. [4] X. Chen, S. Shen, L. Guo, S.S. Mao, Chem. Rev. 110 (2010) 6503–6570. [5] A. Fujishima, K. Honda, Nature 238 (1972) 37–38.
[6] V. Kumaravel, S. Mathew, J. Bartlett, S.C. Pillai, Appl. Catal., B: Environ. (2018). [7] K. Wenderich, G. Mul, Chem. Rev. 116 (2016) 14587–14619.
[8] M. Ge, Q. Li, C. Cao, J. Huang, S. Li, S. Zhang, Z. Chen, K. Zhang, S.S. Al-Deyab, Y. Lai, Advanced Science 4 (2017) 1600152.
[9] F. Pellegrino, F. Sordello, M. Minella, C. Minero, V. Maurino, Catalysts 9 (2019) 32. [10] Y. Li, G. Lu, S. Li, Chemosphere 52 (2003) 843–850.
[11] A. Nada, M. Barakat, H. Hamed, N. Mohamed, T. Veziroglu, Int. J. Hydrogen Energy 30 (2005) 687–691.
[12] N.-L. Wu, M.-S. Lee, Int. J. Hydrogen Energy 29 (2004) 1601–1605.
[13] Y. Li, F. He, S. Peng, D. Gao, G. Lu, S. Li, J. Mol. Catal. A Chem. 341 (2011) 71–76. [14] K. Dhanalakshmi, S. Latha, S. Anandan, P. Maruthamuthu, Int. J. Hydrogen Energy
26 (2001) 669–674.
[15] M. Saito, S. Fujihara, Energy Environ. Sci. 1 (2008) 280–283.
[16] A.S. Polo, M.K. Itokazu, N.Y.M. Iha, Coord. Chem. Rev. 248 (2004) 1343–1361. [17] Z. Wang, X. Lang, Appl. Catal. B Environ. 224 (2018) 404–409.
[18] M.R. St John, A.J. Furgala, A.F. Sammells, J. Phys. Chem. 87 (1983) 801–805. [19] G.R. Bamwenda, S. Tsubota, T. Nakamura, M. Haruta, J. Photochem. Photobiol. A
Chem. 89 (1995) 177–189.
[20] J. Gomes, A. Lopes, K. Bednarczyk, M. Gmurek, M. Stelmachowski, A. Zaleska- Medynska, M. Quinta-Ferreira, R. Costa, R. Quinta-Ferreira, R. Martins, ChemEngineering 2 (2018) 4.
[21] D.-T. Nguyen, S.-S. Hong, J. Nanosci. Nanotechnol. 16 (2016) 1911–1915. [22] J. Choi, H. Park, M.R. Hoffmann, J. Phys. Chem. C 114 (2009) 783–792. [23] M. Ni, M.K. Leung, D.Y. Leung, K. Sumathy, Renew. Sustain. Energy Rev. 11 (2007)
401–425.
[24] X. Chen, C. Burda, J. Phys. Chem. B 108 (2004) 15446–15449. [25] T. Sreethawong, S. Yoshikawa, Catal. Commun. 6 (2005) 661–668. [26] J. Yuan, M. Chen, J. Shi, W. Shangguan, Int. J. Hydrogen Energy 31 (2006)
1326–1331.
[27] Y. Li, C. Xie, S. Peng, G. Lu, S. Li, J. Mol. Catal. A Chem. 282 (2008) 117–123. [28] Y. Shi, Y. Na, T. Su, L. Li, J. Yu, R. Fan, Y. Yang, ChemSusChem 9 (2016)
1498–1503.
[29] Z. Huang, L. Fang, W. Dong, Y. Liu, Z. Kang, J. Nanosci. Nanotechnol. 14 (2014) 4156–4163.
[30] Q. Zhang, G. Zhang, X. Sun, K. Yin, H. Li, Nanomaterials 7 (2017) 130. [31] X. Yu, R. Liu, G. Zhang, H. Cao, Nanotechnology 24 (2013) 335401.
[32] H. Yu, Y. Zhao, C. Zhou, L. Shang, Y. Peng, Y. Cao, L.-Z. Wu, C.-H. Tung, T. Zhang, J. Mater. Chem. 2 (2014) 3344–3351.
[33] F. Duo, Y. Wang, C. Fan, X. Zhang, Y. Wang, J. Alloy. Comp. 685 (2016) 34–41. [34] J. Tian, R. Liu, Z. Liu, C. Yu, M. Liu, Chin. J. Catal. 38 (2017) 1999–2008. [35] L. Dong, D. Liu, X. Li, K. Wu, W. Zhang, Results in Physics 11 (2018) 482–488. [36] H. Zhu, X. Wang, Y. Li, Z. Wang, F. Yang, X. Yang, Chem. Commun. (2009)
5118–5120.
[37] V. Mishra, A. Patil, S. Thakur, P. Kesharwani, Drug Discov. Today (2018). [38] F. Lin, C. Li, Z. Chen, Front. Microbiol. 9 (2018) 259.
[39] I. Rahmawati, R. Intan, M. Zakaria, in: Journal of Physics: Conference Series, IOP Publishing, 2018, 012004.
[40] N. Vasimalai, V. Vilas-Boas, J. Gallo, M. de F�atima Cerqueira, M. Men�endez- Miranda, J.M. Costa-Fern�andez, L. Di�eguez, B. Espi~na, M.T. Fern�andez-Argüelles, Beilstein J. Nanotechnol. 9 (2018) 530.
[41] R. Das, R. Bandyopadhyay, P. Pramanik, Materials today chemistry 8 (2018) 96–109.
[42] I. Sargin, G. Yanalak, G. Arslan, I.H. Patir, Int. J. Hydrogen Energy 44 (2019) 21781–21789.
[43] W. Li, Y. Liu, M. Wu, X. Feng, S.A. Redfern, Y. Shang, X. Yong, T. Feng, K. Wu, Z. Liu, Adv. Mater. 30 (2018), 1800676.
[44] J. Bian, C. Huang, L. Wang, T. Hung, W.A. Daoud, R. Zhang, ACS Appl. Mater. Interfaces 6 (2014) 4883–4890.
[45] X. Zhang, F. Wang, H. Huang, H. Li, X. Han, Y. Liu, Z. Kang, Nanoscale 5 (2013) 2274–2278.
[46] P.S. Saud, B. Pant, A.-M. Alam, Z.K. Ghouri, M. Park, H.-Y. Kim, Ceram. Int. 41 (2015) 11953–11959.
[47] Y. Tang, R. Hao, Y. Fu, Y. Jiang, X. Zhang, Q. Pan, B. Jiang, RSC Adv. 6 (2016) 96803–96808.
[48] H. Ming, Z. Ma, Y. Liu, K. Pan, H. Yu, F. Wang, Z. Kang, Dalton Trans. 41 (2012) 9526–9531.
[49] J. Di, J. Xia, Y. Ge, H. Li, H. Ji, H. Xu, Q. Zhang, H. Li, M. Li, Appl. Catal. B Environ. 168 (2015) 51–61.
[50] S. Liu, J. Tian, L. Wang, H. Li, Y. Zhang, X. Sun, Macromolecules 43 (2010) 10078–10083.
[51] S. Liu, J. Tian, L. Wang, Y. Zhang, X. Qin, Y. Luo, A.M. Asiri, A.O. Al-Youbi, X. Sun, Adv. Mater. 24 (2012) 2037–2041.
[52] H. Li, X. He, Z. Kang, H. Huang, Y. Liu, J. Liu, S. Lian, C.H.A. Tsang, X. Yang, S. T. Lee, Angew. Chem. Int. Ed. 49 (2010) 4430–4434.
[53] K. Jiang, Y. Wang, X. Gao, C. Cai, H. Lin, Angew. Chem. Int. Ed. 57 (2018) 6216–6220.