A K-MEANS CLUSTERING BASED SHAPE RETRIEVAL TECHNIQUE FOR 3D MESH MODELS
1Mohammadhassan REZAEI, 2Erkan GUNPINAR
1,2Istanbul Technical University, School of Mechanical Engineering, Inonu Caddesi, No: 65, Gumussuyu, 34437, Istanbul, TURKEY
1[email protected], 2[email protected]
(Geliş/Received: 14.04.2017; Kabul/Accepted in Revised Form: 03.07.2017)
ABSTRACT: Due to the large size of shape databases, importance of effective and robust method in shape retrieval has been increased. Researchers mainly focus on finding descriptors which is suitable for rigid models. Retrieval of non-rigid models is a still challenging field which needs to be studied more. For rigid models, descriptors that are designed should be insensitive to different poses. For non-rigid model retrieval, we propose a new method which first divides a model into clusters using geodesic distance metric and then computes its descriptor using the area of these clusters. A skeleton-based K-means clustering method is utilized for dividing the model into clusters. Each cluster is represented by an area based descriptor which is invariant to scale and orientation. Articulated objects from human to animals are employed in this study’s experiments for the validation of the proposed retrieval algorithm. Key Words: Geodesic distance, K-means clustering, Mesh skeleton, Shape retrieval,
Üç Boyutlu Çözüm Ağları için K-Means Kümeleme Tabanlı Şekil Araması
ÖZ: Şirketlerin veri tabanlarında çok fazla şekil bulunmaktadır. İstenilen şekillerin bu veri tabanından bulunup getirilmesi için etkili ve güçlü şekil arama metodlarının kullanılması gerekmektedir. Araştırmacılar genelde rijit (esnemeyen) modellere uygun geometrik tanımlayıcılar üzerine odaklanmışlardır. Rijit olmayan modellerin bulunması daha zor olmakta ve bu konuda daha çok çalışılması gerekmektedir. Rijit olmayan modeller için tasarlanan geometrik tanımlayıcılar değişik model pozlarında (insan modeli için yürüme, oturma gibi pozlar) çalışabilmesi gerekmektedir. Rijit olmayan model araması için, öncelikle model jeodezik metrik kullanarak parçalara bölünür. Sonra her bir parçanın alanı toplam alana bölünerek geometrik tanımlayıcı hesaplar. İskelet-bazlı K-means metodu kullanarak model parçalara ayrılmıştır. Her parça alan-bazlı tanımlayıcılar kullanılarak tanımlanmıştır. Bu tanımlayıcıların ölçek ve oryantasyon değişikliklerine hassasiyeti yoktur. Çalışmanın testlerinde insandan hayvanlara eklemli canlılar kullanılmış, önerilen model arama metodunun performansı doğrulanmıştır.
Anahtar Kelimeler: Jeodezik uzaklık, K-means kümeleri, Çözüm ağı iskeletleri, Model bulma, INTRODUCTION
With the increase in the number of 3-D models in the internet or company databases, accessing desired models from databases in a shorter time becomes an open issue for research. In the last years, some 3D model search engines have been designed for accessing 3D models in databases consisting of huge data sets. Some famous search engines are Princeton University search Engine (Min et al., 2003), Taiwan National University shape retrieval engine (Shen et al., 2003) and FOX-Mier shape retrieval engine (Ansary et al., 2007). In shape retrieval, model features should be found which describe the model well which are called shape descriptors. Some of the descriptors proposed in literature are accurate, but
utilizing them in real time is time consuming. On the other side, there are some descriptors which are fast, but not robust. Researchers try to design a descriptor and balance the speed and robustness at the same time.
In a shape retrieval engine, an input model, called query, is selected and similar models to the query are listed among the models in model database. Utilizing directly the retrieval algorithm on 3D models in database is time consuming, therefore we first have a preprocessing step called off-line step in which descriptors for the query and datasets are calculated. Comparison between the query descriptor and the descriptors for models of datasets are then made in an on-line step. Search engine retrieves all similar models to the query via using pre-computed descriptors. The descriptor suggested in this paper is insensitive to different model poses and is invariant when the model is rotated, translated or scaled.
The proposed algorithm consists of three main steps. First, a 3D mesh model is partitioned into clusters via a K-means clustering technique. Geodesic distance is utilized during the clustering step. As K-means algorithm is sensitive to the initial seeds given, K-Furthest seeds are computed by means of the mesh skeleton. Model descriptor is defined based on surface area of the clusters which is not sensitive to different model poses. Models are finally retrieved using their descriptors. We form a model database for the validation of the proposed algorithm which consists of the models especially from Princeton University Benchmark.
RELATED WORKS
3D shape retrieval methods can be divided into three main categories: Feature-based techniques, graph-based techniques and view-based techniques. Here, we outline some of the proposed techniques in these categories. Paquet et al. (2000) used cord histograms. Cords were defined as the connecting center of the model to the center of each triangle faces. Zhang and Chen (2001) used surface properties like area, volume and istatistical moment to create global feature descriptors. Convex-hull based descriptors were introduced by Corney et al. (2002). Hull crumbliness, hull packing and hull compactness were defined as descriptors in their paper. Extended Gaussian Image (EGI) method was defined for the first time by Horn (1984). In this histogram-based method, normal vector of each triangle was mapped on the Gaussian sphere. Complex extended Gaussian image (CEGI) was then generalized by Kang and Ikeuchi (1991) which took the distance of faces to the origin also into consideration. Kazhdan et al. (2004) used a mirroring descriptor in their work. They calculated global descriptor by measuring the reflective symmetry of each plane of 3-D model according to the position of model’s center. Osada et al.(2002) brought distribution concept to global dissimilarity descriptors. They first extracted descriptor based on area, volume or distance. Difference of distributions then showed the amount of dissimilarity between 3D models. Ohbuchi et al. (2002) created shape histograms along with the principal axis of 3D model. They used properties such as the moment of inertia, average distance from surface to the principal axis and distance variation to the principal axis for creating histograms. Ip et al. (2002) applied the shape distribution approach for the CAD models by reforming Osada’s D2 function. This method was only useful for volume models and not for soup models. Sector and shells based disstribution histograms were used by Ankerst et al. (1999). 3D models were divided into different spatial parts by using singly concentric shells and sectors. These sector and shell unites were corresponding with each bin in the shape histogram. Vranic et al. (2001) presented a ray-based descriptor which first found the spherical extent function of the model and then created descriptor by calculating spherical harmonics of that function. The method was not rotation invariation and needs pose normalization. Kazhdan et al. (2003) described a rotation invariant method for representing 3D models. In this method, by means of concentric spheres, spherical harmonic was constructed.
For graph-based techniques, reeb graphs and skeleton-based methods are the most popular. Mathematically, reeb graphs are a kind of skeleton which descripe a 3D model topologically by using a scalar function. In reeb graphs, quotient function, f, play an important role for creating graphs. Biasotti et al. (2003) showed that applying various quotient function leaded to different reeb graphs and choosing
suitable quotient function has crucial effect in matching result. Hilaga et al. (2001) used integral geodesic distance as a quotient function. Bespalov et al. (2003) implemented Hilaga’s procedure on solid models. They concluded that reeb graph matching method was sensitive to topology of 3D models and more work should be done to inhance the method. For skeleton-based techniques, Sundar et al. (2003) used models skeleton for retrieving the models. They first voxelized 3D shape object and they then used Gagvani’s Volume Thinning algorithm (Gagvani and Silver, 1999). Sundar et al. (2003) tried to find similarity of two 3D shapes by comparing their skeletal graph by detecting the maximum cardinality, minimum weight matching between two corresponding graph. Funkhouser et al. (2003) used a view based technique for shape retrieval. They applied a two dimentional sketch as a query. Chen et al. (2003) and Shen et al. (2003) utilized a view-based technique for retrieving 3D objects by noticing the fact that 3D models are similar if they look same from all points of view.
Our technique takes different approach than the shape retrieval techniques in the literature which utilize a single cluster (i.e., whole model). However, we generate different clusters and the descriptor is defined on these clusters. We believe that it is advantageous because main focus of researchers in previous works was to finding descriptors which represent 3-D model globally. One of the weak point is that some of the retrieved models for the input model (query) are completely different, but they are globally similar to the query according to the descriptor used. To avoid this problem, we proposed a new method which divides models into clusters first and computes then descriptors on these clusters. Furthermore, using geodesic metric for K-means clustering rather than Euclidean metric makes our method insensitive to different poses.
PROPOSED METHOD Overview
In this section, we describe the flow of the proposed method. Figure 1 illustrates the main steps of the proposed algorithm. The skeleton of a given 3D mesh model is first computed. Two furthest points on the skeleton are then found. Two corresponding points on the mesh for these two points is calculated which are assigned as the first two seed points that will be used in the K-means clustering algorithm. Other k-2 seed points are then found. In the next step, K-means algorithm is utilized to partition the mesh into vertex clusters by using k seed points. K is a user-defined integer input. The mesh model is simplified using an area based shape descriptor which is a fingerprint of the model. The descriptor carries the important information of the model which is used to compare it with other shapes. Therefore, similarity rate between models is computed based on this shape descriptor.
K-means Clustering
A mesh, M, is partitioned into k sub-meshes or clusters, { }. A cluster, consists of a set of vertices and a cluster center (or centroid), , where is integer between and . Furthermore, any two cluster, and , do not share the same vertex (i.e., ). To find clusters, objective function in Formula 1 is utilized which aims to minimize the total sum of the squared distance for all vertices in each cluster with its centroid center.
(1)
Exact solution for this problem is NP hard. Lloyd’s clustering technique (Lloyd, 1982) is used extensively by many scientists and researchers in different fields (Herwig et al., 1999; Agarwal and Nabil, 2004; Gibou and Fedkiw, 2005) which our technique utilize as well. Partitioning and cluster center update phases are iterated until the cluster centers do not move anymore or if their move is negligible. Pseudo-code for the Lloyd’s K-means clustering technique is as follows
:
1. Select k vertices randomly in the mesh as initial centroids or seeds 2. Assign each mesh vertex to the closest centroid.
3. Compute mean of each cluster and select the vertex in the cluster that is closest to the mean as new centroid.
4. Iterate line 2 and 3.
5. If the centroid positions do not change anymore, algorithm stops. 6. K number of clusters are obtained.
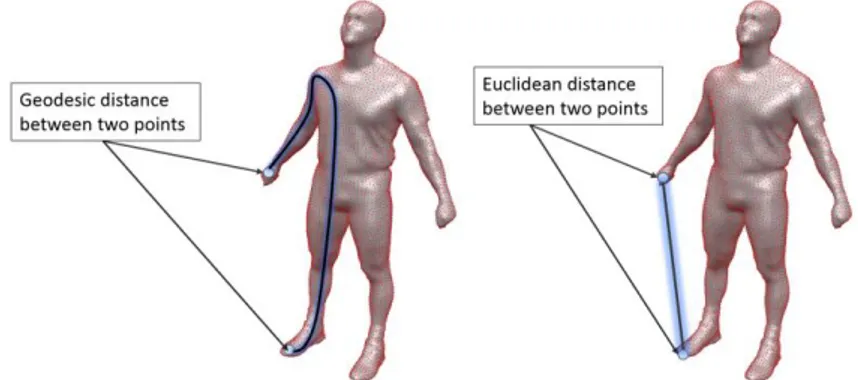
K-means clustering has a rather high speed, however this algorithm is sensitive to initial seed points (i.e., centroids) or initial centers. We tried to solve this problem by making use of mesh skeleton which will be described in the next section. Another important issue is to use of an appropriate distance metric. Geodesic distance is utilized to compute distance between two points which is the shortest path between the points on the surface model. Figure 2 shows Geodesic and Euclidean distance on a 3D mesh model.
Figure 2. Geodesic and Euclidean distance on the 3D model Skeleton-based K-means Partitioning
Weak point of K-means clustering is its sensitivity to the selected initial seed points. Shape retrieval method that will be detailed in Section 3.4 closely depends on the quality of generated clusters. Our aim is to cluster models in the way that clusters are similar in similar models. To achieve this, initial seed points should be approximately at the same position for similar models. One way is to select k furthest points on the mesh. This has, however, high computational cost for a model with a large number of vertices if Geodesic distance computation is utilized. Suppose we have a 3D model with n mesh vertices.
For finding two furthest vertices in the mesh, Geodesic distance between vertex pairs should be checked. The 3D models used in our work have mostly more than 5000 points and finding two furthest vertex for a model can take even a few days. To overcome this problem, we first create the skeleton of 3D model and then compute two furthest points in the skeleton which can help in finding two furthest points in the mesh. The problem of finding two furthest points can be solved just in a few seconds even for models with 10000 points.
There are several techniques (Au et al., 2008, Dey and Sun, 2006; Gagvani and Silver, 1999; Sundar et al. 2003; Tagliasacchi et al., 2012) existing in literature to compute the skeleton of a given shape represented using 3D mesh. The technique (Tagliasacchi et al., 2012) of Andrea Tagliasacchi et al.. is utilized to compute the skeleton for a shape represented using 3D mesh because of its high computational speed and the ability to produce good results. The method creates skeleton curve by using Mean Curvature Flow (MCF), which is negative gradient flow of the area. Area of the mesh becomes smaller by iteratively contracting mesh vertices towards the positions where curvature is maximum. Another advantage of the MCF-based methods is that it can automatically compute skeleton by just adjusting a few number of user-defined parameters (Au et al., 2008; Tagliasacchi et al., 2012).
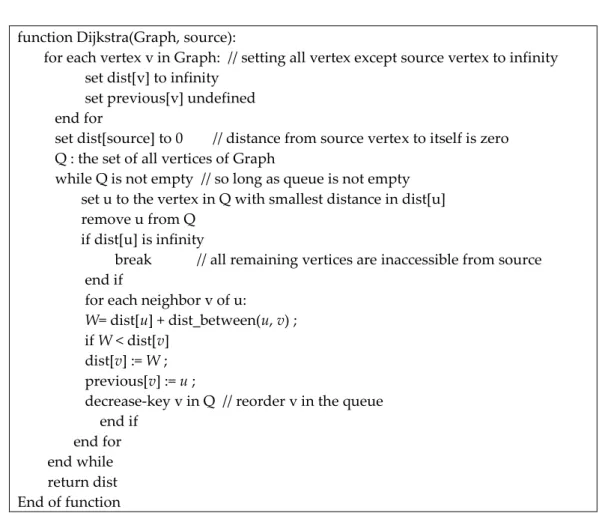
The computed skeleton is represented using an undirected graph with positive weights. A graph G = (V, E) consists of a set of vertices V and a set of edges E ⊆ V × V which are unordered pair of V. In undirected graphs all the edges are bidirectional. Figure 3 illustrates a undirected graph
.
Figure 3. An undirected graph with 15 vertices and 15 edges.
The problem to find two furthest points in an undirected graph can be formulated as a single-source shortest path problem which can be solved by the Dijkstra’s algorithm (Dijkstra, 1959). Let s and t be the source and target vertex, respectively. All possible shortest paths in the graph are computed first. A path connecting two vertices (s and t) with maximum weight (sum of all the edges of shortest path) will then be selected. These two vertices are the two furthest vertices in the skeleton. A pseudo-code for finding the shortest path from a source vertex, s∊V, to another vertices, v∈V, is given in below:
function Dijkstra(Graph, source):
for each vertex v in Graph: // setting all vertex except source vertex to infinity set dist[v] to infinity
set previous[v] undefined end for
set dist[source] to 0 // distance from source vertex to itself is zero Q : the set of all vertices of Graph
while Q is not empty // so long as queue is not empty set u to the vertex in Q with smallest distance in dist[u] remove u from Q
if dist[u] is infinity
break // all remaining vertices are inaccessible from source end if
for each neighbor v of u:
W= dist[u] + dist_between(u, v) ; if W < dist[v]
dist[v] := W ; previous[v] := u ;
decrease-key v in Q // reorder v in the queue end if
end for end while return dist End of function
Next, other k-2 seeds will be found to complete the seed set S = {s1, s2, s3, …, sk} which will be used to start K-means clustering algorithm. s1 and s2 denote the first two seed points that are computed with the help of the model skeleton in the previous step. Our objective is to find these points which are well distributed on the model. In other words, the seeds should be evenly spaced which we call space-filling seeds. Therefore, minimum pairwise distance between seeds is maximized. A greedy approach is chosen to find other seeds. To find the seed where and is integer, the vertex in the mesh should maximize the following equation: min {Dist (v,s1), Dist (v,s2),…Dist(v,si-1)} and is selected as the seed si. The seed selections will be performed until finding k seeds on the 3D mesh model. Effect of initializing K-means clustering with Skeleton-based k seeds and randomly selected seeds are given in Figure 4. Former one can generate similar clusters for the models in same groups. However, the latter one does not achieve similar clusters.
Figure 4. Clusters in the left image are obtained starting with random seeds. Clusters in the right image are obtained using the seeds generated by our method.
Model Retrieval
In shape recognition, features in a 3D model are found that describe the model well. Shape descriptors are used for this which describes the model in a mathematical way. In this work, area of each cluster is computed and divided to the whole area of the model. We then normalize the area by sorting the area values from the smallest to largest. Let denote the whole area of a given mesh M and is the area of
the cluster (recall and is integer). is a descriptor in the
vector form which denotes the sorted normalized area for clusters where Ni , and . Similarity rate between two models are computed based on Euclidean distance between two descriptors and the distance value is divided by which is the maximum possible
distance between clusters. Suppose and be the descriptors
of the model M and model N, respectively. The similarity is rate between these models are calculated by the following equation:
(2) RESULT AND DESCUSSION
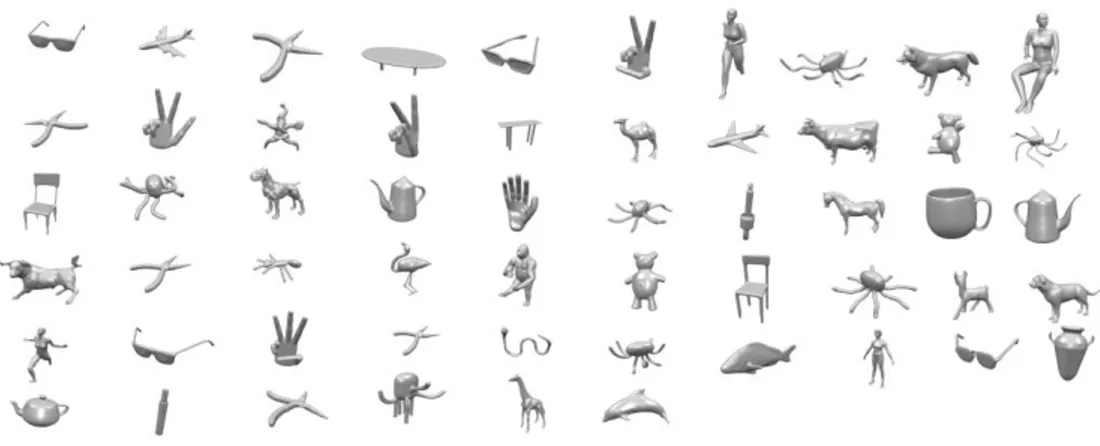
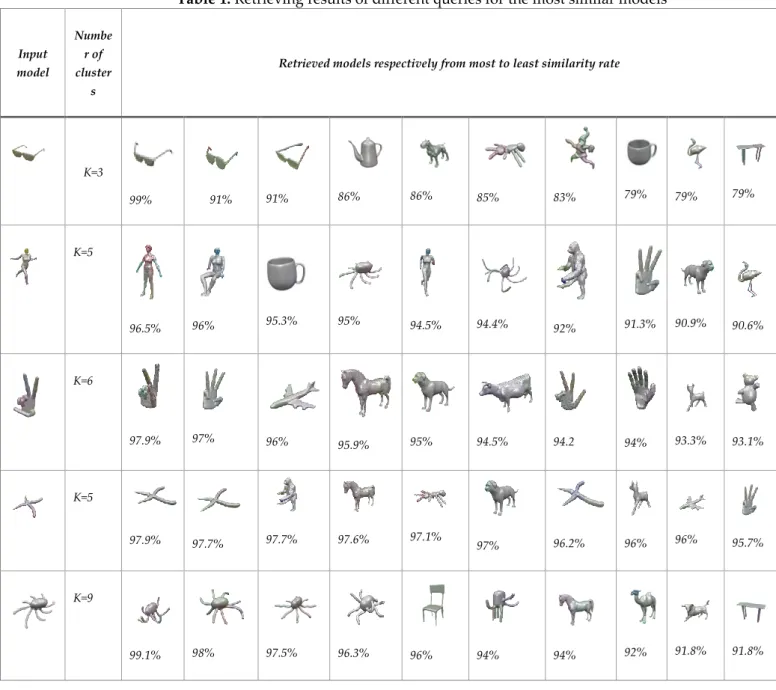
A testing model set is formed which consists of 56 3D mesh models from Princeton shape benchmark (Shilane et al., 2004) and SHREC’11 benchmark (Lian et al., 2011). Figure 5 shows our model database that is used to validate the proposed model retrieval approach. Retrieving is, in fact, the process of finding similar models to a given input model. We first calculate the descriptor of the input model. Descriptors of the test models are then computed. Using Equation 2 the similarity rate between the input model and the test models are found. We then sort models according to their similarity rate from most to least similarity rate. Five different input models are used for different number of clusters (K). Table 1 shows model retrieval results for different queries. For an eyeglass model, the most similar models are eyeglass models whose similarity rate is 99%, 91% and 91%. For a human model with different poses, the most two similar models are human models too. However, it has been observed a cup model and an octopus model are retrieved with the 95% similarity rates. It can be said that the algorithm somewhat fails in this case. For a hand model, the most two similar models are also hand models. For the simplified bird model, the most two similar models are simplified bird models too. The most four similar models to the octopus model are also octopus models. According to these experiments, it can be said that the algorithm generated successful results in most cases.
Table 1. Retrieving results of different queries for the most similar models Input model Numbe r of cluster s
Retrieved models respectively from most to least similarity rate
K=3 99% 91% 91% 86% 86% 85% 83% 79% 79% 79% K=5 96.5% 96% 95.3% 95% 94.5% 94.4% 92% 91.3% 90.9% 90.6% K=6 97.9% 97% 96% 95.9% 95% 94.5% 94.2 94% 93.3% 93.1% K=5 97.9% 97.7% 97.7% 97.6% 97.1% 97% 96.2% 96% 96% 95.7% K=9 99.1% 98% 97.5% 96.3% 96% 94% 94% 92% 91.8% 91.8%
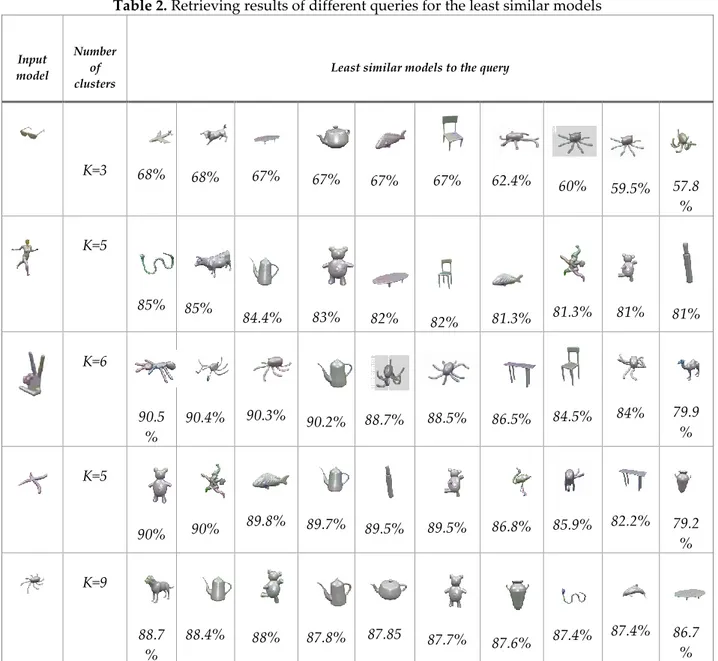
Table 2 shows the most dissimilar models to the query. For the eyeglass model, all of the most dissimilar models are octopuses with 57.8%, 59.5%, 60% and 62.4% dissimilarity rates. For the woman model, cylindrical model and panda are the most dissimilar retrieved models with 81% of similarity rates. For the hand model, the camel is the most dissimilar model, and most of the octopus models are the last 10 dissimilar models to the input hand model. According to the results in Table 2, by increasing the number of clusters, dissimilarity rate difference between most similar and the least similar model to the query decreases. For example; for the eyeglass model with the K=3 setting, similarity rate difference between the most similar (99%) and the most dissimilar model (57.8%) is 42.2%. However, this difference decreases to 18% for the hand model with the K=6 setting and to 16% for the octopus model with the K=9 setting.
Table 2. Retrieving results of different queries for the least similar models Input model Number of clusters
Least similar models to the query
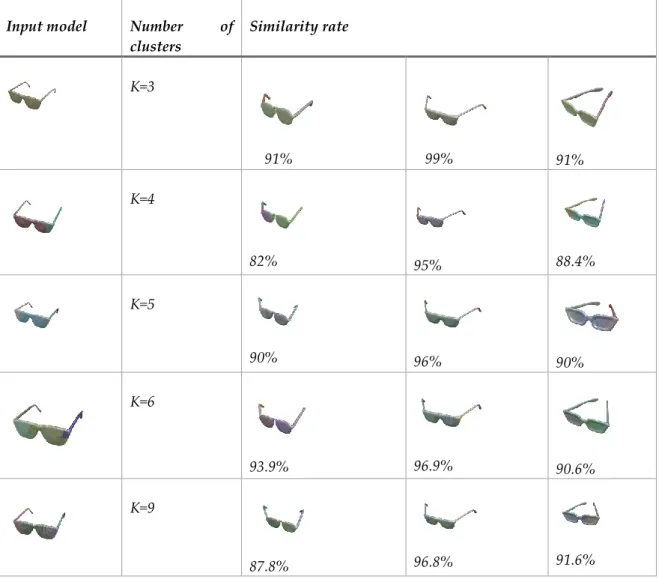
K=3 68% 68% 67% 67% 67% 67% 62.4% 60% 59.5% 57.8 % K=5 85% 85% 84.4% 83% 82% 82% 81.3% 81.3% 81% 81% K=6 90.5 % 90.4% 90.3% 90.2% 88.7% 88.5% 86.5% 84.5% 84% 79.9 % K=5 90% 90% 89.8% 89.7% 89.5% 89.5% 86.8% 85.9% 82.2% 79.2 % K=9 88.7 % 88.4% 88% 87.8% 87.85 87.7% 87.6% 87.4% 87.4% 86.7 % Parameter tuning: Here, we will show the effect of choosing different number of clusters (K) on the same group of models (eyeglasses). Experiments are done for the K values of 3, 5, 7 and 9. The retrieval results are arranged in Table 3. Average similarity rate for different number of clusters are approximately same in most of the cases. It seems that the K=3 setting gives satisfactory results for the eyeglass model and it is not required to increase the number of clusters. Note that if the number of clusters increase, more computation time is needed.
Table 3. Effect of selecting different number of clusters on the similarity rate for the eyeglass model Input model Number of
clusters Similarity rate K=3 91% 99% 91% K=4 82% 95% 88.4% K=5 90% 96% 90% K=6 93.9% 96.9% 90.6% K=9 87.8% 96.8% 91.6%
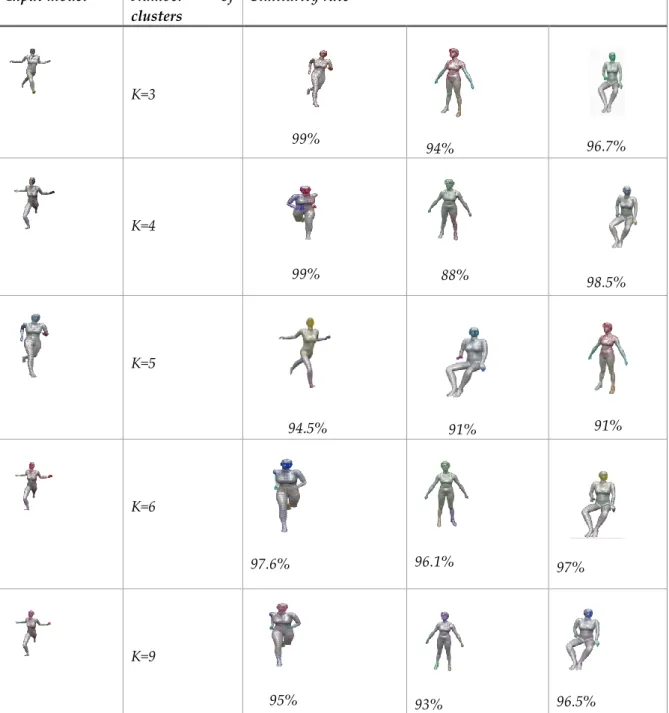
The woman model is used to test the effect of selecting different number of clusters, K, on the similarity rate. Table 4 summarizes these results. According to Table 4, results with the K=6 setting seems better than the K=3 setting, but more computation time is required for this setting. Finding optimum number of clusters will be our future goal, but we recommend to select a fewer number of clusters as much as possible.
Table 4. Effect of selecting different number of clusters on the similarity rate for the woman model Input model Number of
clusters Similarity rate K=3 99% 94% 96.7% K=4 99% 88% 98.5% K=5 94.5% 91% 91% K=6 97.6% 96.1% 97% K=9 95% 93% 96.5%
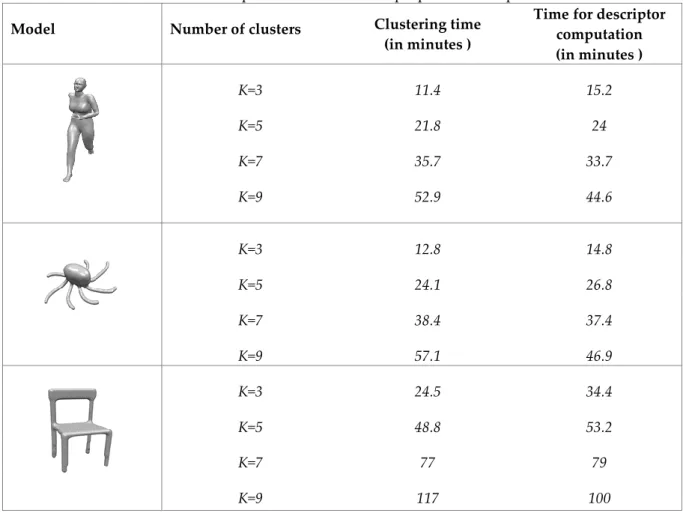
Computational time: Time required for clustering and descriptor computation is shown in Table 5. With the increase in the number of clusters (K), computational time for both of these steps increase. Ratio of clustering time to descriptor time decreases when K increases. For example, the ratio for K=3 is 0.75, whereas it increases to 1.18 for K=9. The reason behind this is that finding K furthest points on the mesh is computed based on the Geodesic distance which takes higher time. For a human model, clustering time is from 11.4 minutes to 52.9 minutes. Time taken for computing descriptor is from 15.2 to 44.6 minutes.
The woman and octopus model contains approximately 5600 and 6000 mesh vertices, respectively. Computational time for both clustering and descriptor again increases. It can be observed that computation time for models with approximately same number of points are approximately same. For octopus model, clustering time changes from 12.8 to 57.1 minutes. Ratio of clustering time to descriptor
time for the octopus model with the K=3 setting is 0.86, whereas it increases to 1.21 for the K=9 setting which is closed to those of the woman model, 0.75 and 1.18, respectively. The chair model consists of 8600 mesh vertices, and therefore computational time increases significantly. Clustering time for the K=3 setting increases from 12.8 minutes to 24.5 when compared to the octopus model. For the descriptor calculation stage, it increases from 14.8 to 34.4 minutes. Ratio of the clustering time to the descriptor time for the K=3 setting is 0.71, whereas it increases to 1.17 for the K=9 setting. When compared to the previous models, they are approximately same. According to the results, it can be concluded that the ratio of clustering time to the descriptor time for different models with same number of clusters is approximately same also for the models consisting of different number of mesh vertices. Finally, the online step, finding the most similar models based on the precomputed descriptors, for the model retrieval takes less than a minute for the test cases in this work.
Table 5. Computational time for the proposed technique
Model Number of clusters Clustering time
(in minutes )
Time for descriptor computation (in minutes ) K=3 11.4 15.2 K=5 21.8 24 K=7 35.7 33.7 K=9 52.9 44.6 K=3 12.8 14.8 K=5 24.1 26.8 K=7 38.4 37.4 K=9 57.1 46.9 K=3 24.5 34.4 K=5 48.8 53.2 K=7 77 79 K=9 117 100
CONCLUSION AND FUTURE WORKS
In this paper, we present a new method for retrieving 3D models represented using meshes. The models are divided into clusters by applying skeleton-based K-means partitioning method. In an off-line step, model descriptors are computed which are based on the cluster areas. In an online step, similarity rate between the query and other models in database is computed and similar models to the query are retrieved from the database. Performance of the proposed retrieval technique is shown via several experiments where rigid and non-rigid models are utilized. According to the results, the proposed method is successful in terms of its retrieving performance. Furthermore, it has been shown that the method is invariant to different model poses, and therefore can be used for non-rigid models.
As a future work, the proposed clustering method will be improved in order to achieve a less computation time in off-line step. One way for this can be to find an optimum number of clusters required for the K-means clustering method. The proposed algorithm fails in some cases even though it works well in most cases according to experiments. Using different geometric descriptors jointlyinstead of just one simple descriptor can lead to better retrieving performance. Additionally, it will be interesting to study on the automatic setting for the k value that is used in the clustering algorithm. Finally, we would like to extend our model retrieval technique for quadrilateral meshes (generated using mixed-integer quadrangulation (Bommes et al..,2009) which are segmented into quad partitions using motorcycle graph ( Eppstein et al., 2008; Bommes et al., 2009; Gunpinar et al., 2013; Gunpinar et al., 2014a; Gunpinar et al., 2014b.).
REFERENCES
Agarwal, P. K., Mustafa, N. H., “K-means Projective Clustering” ,In Proceedings of The Twenty-Third ACM SIGMOD-SIGACT-SIGART Symposium on Principles of Database Systems , ACM, Paris, France, pp. 155-165, 14 – 16 June 2004.
Ankerst, M., Kastenmüller, G., Kriegel, H. P. , Seidl, T., “3D Shape Histograms for Similarity Search and Classification in Spatial Databases”, In International Symposium on Spatial Databases, pp. 207-226, Springer Berlin Heidelberg, July 1999.
Ansary, T. F., Vandeborre, J. P.,Daoudi, M., “3d-Model Search Engine from Photos”, In Proceedings of the 6th ACM international conference on Image and video retrieval, Amsterdam, The Netherlands, pp. 89-92, ACM, 09 - 11 July 2007.
Au, O. K. C., Tai, C. L., Chu, H. K., Cohen-Or, D., Lee, T. Y., 2008, “Skeleton Extraction by Mesh Contraction”, ACM Transactions on Graphics (TOG), Vol.27 (3), 44.
Bespalov, D., Regli, W. C., Shokoufandeh, A., “Reeb Graph Based Shape Retrieval for CAD”, In ASME 2003 International Design Engineering Technical Conferences and Computers and Information in Engineering Conference , Chicago, Illinois, USA, pp. 229-238, American Society of Mechanical Engineers, 2–6 September 2003.
Biasotti, S., Marini, S., Mortara, M., Patane, G., Spagnuolo, M., Falcidieno, B., “3D Shape Matching Through Topological Structures”, In International Conference on Discrete Geometry for Computer Imagery ,pp. 194-203, Springer Berlin Heidelberg, November 2003.
Bommes, D., Zimmer, H., Kobbelt, L., 2009, “Mixed-integer Quadrangulation”, ACM Transactions on Graphics (TOG), Vol.28 (3), 77.
Chen, D. Y., Tian, X. P., Shen, Y. T., Ouhyoung, M., 2003, “On Visual Similarity Based 3D Model Retrieval” ,In Computer Graphics Forum, Vol. 22, No. 3, pp. 223-232, Blackwell Publishing, Inc, September 2003.
Corney, J., Rea, H., Clark, D., Pritchard, J., Breaks, M., MacLeod, R., 2002, “Coarse Filters for Shape Matching”, IEEE Computer Graphics and Applications, Vol. 22(3), pp. 65-74, 2002.
Dey, T. K., Sun, J., “Defining and Computing Curve-Skeletons with Medial Geodesic Function”, In Symposium on Geometry Processing, Vol. 6, pp. 143-152, June 2006.
Dijkstra, E. W. 1959, “A Note on Two Problems in Connexion with Graphs”, Numerische Mathematik, Vol. 1(1), pp. 269-271.
Eppstein, D., Goodrich, M. T., Kim, E., Tamstorf, R., 2008, “Motorcycle Graphs: Canonical Quad Mesh Partitioning”, In Computer Graphics Forum , Vol. 27, No. 5, pp. 1477-1486, Blackwell Publishing Ltd , July 2008.
Funkhouser, T., Min, P., Kazhdan, M., Chen, J., Halderman, A., Dobkin, D., Jacobs, D., 2003, “A Search Engine for 3D Models”, ACM Transactions on Graphics (TOG), Vol. 22(1), pp. 83-105.
Gagvani, N., Silver, D. 1999,”Parameter-Controlled Volume Thinning”, Graphical Models and Image Processing, Vol. 61(3), pp. 149-164.
Gibou, F., Fedkiw, R., “A fast hybrid k-means level set algorithm for segmentation”, In 4th Annual Hawaii International Conference on Statistics and Mathematics, Honolulu, Hawaii, pp. 281-291, 9-11 January 2005.
Gunpinar, E., Suzuki, H., Ohtake, Y., Moriguchi, M. 2013, “Generation of Bi-Monotone Patches from Quadrilateral Mesh for Reverse Engineering”, Computer-Aided Design, Vol. 45(2), pp. 440-450. Gunpinar, E., Moriguchi, M., Suzuki, H., Ohtake, Y., 2014a,”Feature-Aware Partitions from the
Motorcycle Graph”, Computer-Aided Design, Vol. 47, pp. 85-95.
Gunpinar, E., Moriguchi, M., Suzuki, H., Ohtake, Y. 2014b, “Motorcycle Graph Enumeration from Quadrilateral Meshes for Reverse Engineering” ,Computer-Aided Design, Vol. 55, pp. 64-80. Herwig, R., Poustka, A. J., Müller, C., Bull, C., Lehrach, H., O'Brien, J. 1999, “Large-Scale Clustering of
cDNA-Fingerprinting Data”, Genome Research, Vol. 9(11), pp. 1093-1105.
Hilaga, M., Shinagawa, Y., Kohmura, T., Kunii, T. L., ”Topology Matching for fully Automatic Similarity Estimation of 3D shapes”, In Proceedings of the 28th Annual Conference on Computer Graphics and Interactive Techniques, Los Angeles, CA, USA, pp. 203-212, ACM, 12 - 17 August 2001.
Horn, B. K. P., 1984, “Extended Gaussian Images”, Proceedings of the IEEE, Vol. 72(12), pp. 1671-1686. Ip, C. Y., Lapadat, D., Sieger, L., Regli, W. C.,”Using Shape Distributions to Compare Solid Models”,
In Proceedings of the Seventh ACM Symposium on Solid Modeling and Applications, Saarbrucken, Germany, pp. 273-280, ACM, 17 - 21 June 2002.
Kang, S. B., Ikeuchi, K. ,“Determining 3-D Object Pose Using the Complex Extended Gaussian Image”, In Computer Vision and Pattern Recognition, 1991. Proceedings CVPR’91, IEEE Computer Society Conference on, pp. 580-585, IEEE, June 1991.
Kazhdan, M., Chazelle, B., Dobkin, D., Funkhouser, T., Rusinkiewicz, S, 2004, ”A Reflective Symmetry Descriptor for 3D models”, Algorithmica, Vol. 38(1), pp. 201-225.
Kazhdan, M., Funkhouser, T., Rusinkiewicz, S., “Rotation Invariant Spherical Harmonic Representation of 3D Shape Descriptors”, In Symposium on Geometry Processing, Vol. 6, pp. 156-164, June 2003. Lian, Z., Godil, A., Bustos, B., Daoudi, M., Hermans, J., Kawamura, S. Dp Suetens, P., 2011, “Shape
Retrieval on Non-rigid 3D Watertight Meshes”, In Eurographics Workshop on 3D Object Retrieval (3DOR).
Lloyd, S. 1982, “Least Squares Quantization in PCM”, IEEE transactions on Information Theory”, Vol. 28(2), pp. 129-137.
Min, P., Halderman, J. A., Kazhdan, M., Funkhouser, T. A., ”Early Experiences with a 3D Model Search Engine”, In Proceedings of the Eighth International Conference on 3D Web Technology, St. Malo, France, pp. 7-ff, ACM, 09 – 12 March 2003.
Ohbuchi, R., Otagiri, T., Ibato, M., Takei, T., 2002, “Shape-Similarity Search of Three-Dimensional Models Using Parameterized Statistics”, In Computer Graphics and Applications, 2002. Proceedings, 10th Pacific Conference on, pp. 265-274, IEEE.
Osada, R., Funkhouser, T., Chazelle, B., Dobkin, D., 2002 “Shape distributions”, ACM Transactions on Graphics, (TOG), 21(4), 807-832.
Paquet, E., Rioux, M., Murching, A., Naveen, T., Tabatabai, A., 2000,”Description of Shape Information for 2-D and 3-D Objects”, Signal Processing: Image Communication, Vol. 16(1), pp. 103-122. Shen, Y. T., Chen, D. Y., Tian, X. P., Ouhyoung, M., 2003,”3D Model Search Engine based on Lightfield
Descriptors”, In Proc. Eurographics, Granada, Spain, 1–6 September 2003.
Shilane, P., Min, P., Kazhdan, M., Funkhouser, T., “The Princeton Shape Benchmark”, In Shape Modeling Applications, 2004. Proceedings, Genova, Italy, pp. 167-178, IEEE, 7-9 June 2004.
Sundar, H., Silver, D., Gagvani, N., Dickinson, S., “Skeleton Based Shape Matching and Retrieval”, In Shape Modeling International, Seoul, South Korea, pp. 130-139I, EEE, 12-15 May 2003.
Tagliasacchi, A., Alhashim, I., Olson, M., Zhang, H., “Mean Curvature Skeletons”, In Computer Graphics Forum ,Vol. 31, No. 5, pp. 1735-1744 ,Blackwell Publishing Ltd, August 2012.
Vranic, D. V., Saupe, D., Richter, J., “Tools for 3D-Object Retrieval: Karhunen-Loeve Transform and Spherical Harmonics”, In Multimedia Signal Processing, 2001 IEEE Fourth Workshop on (pp. 293-298),Cannes, France, 3-5 Oct. 2001.
Zhang, C., Chen, T., 2001, “Efficient Feature Extraction for 2D/3D Objects in Mesh Representation”, In Image Processing, 2001. Proceedings. 2001 International Conference on, Thessaloniki, Greece, Vol. 3, pp. 935-938, 7-10 Oct. 2001.