Job satisfaction of the academic
staff of the vocational schools of
the foundation and public
universities
Sample of Turkey
Nurdan C¸olakog˘lu
Faculty of Economics and Administrative Sciences, Istanbul Arel University,
I˙stanbul, Turkey, and
Esra Atabay
Vakfıkebir Vocational High School, Accounting,
Karadeniz Technical University, Trabzon, Turkey
Abstract
Purpose – This study aims to highlight the differences between the public and foundation universities determining the level of job satisfaction of academic personnel working at vocational schools within the body of public and foundation universities in Turkey.
Design/methodology/approach – In the present study, the questionnaire developed by Ardic and Bas and used in a similar study is taken as the basis for this study. Some amendments have been made to the instrument. The reliability of the questionnaire was evaluated using the Cronbach alpha coefficient and some statistical methods such as independent samples t test and chi-square test depending on the data. Differences of opinion based on demographic characteristics are presented giving the frequencies and percentages of demographic characteristics of the data.
Findings – Three questions were focused on in the present study: the first is to present the most important factor affecting the job satisfaction or dissatisfaction of the academic personnel working at the public and foundation universities; the second is to determine whether there is a difference between public and foundation universities and the third is to set forth the reasons of these differences, if any. Research limitations/implications – The current study selected 12,160 academic personnel throughout Turkey and the questionnaire was used as a data collection instrument. The instrument could not be delivered to all the personnel. This is because it was not possible to have access to the e-mail addresses of some of the academic personnel, some of the e-mail addresses were not in use or out of date while some personnel do not use the internet.
Originality/value – The aim of this study is to determine job satisfaction level of academic personnel working in vocational high schools operating under the umbrella of state and foundation universities, which offer educational services in Turkey. Since no study is encountered as a result of the literature survey made, that addressed especially the level of the job satisfaction of the academic staff working in the vocational schools in Turkey in a way to cover all public and foundation universities, such a study was made for the purpose of removing the deficiency in this subject. Keywords Foundation universities, Job satisfaction of academic personnel, Vocation high school, State universities, Turkey
Paper type Research paper
The current issue and full text archive of this journal is available at www.emeraldinsight.com/0968-4883.htm
The statistical analyses of the work were conducted by Assistant Professor Dr Nurdan C¸olakog˘lu.
Job satisfaction
of academic staff
185
Received 24 December 2012 Revised 11 June 2013 Accepted 18 September 2013Quality Assurance in Education Vol. 22 No. 2, 2014 pp. 185-206 q Emerald Group Publishing Limited 0968-4883 DOI 10.1108/QAE-12-2012-0050
1. Introduction
Current intense competition has forced institutions to make various changes to their approach to delivering their strategy. Efficiency and effectiveness of workers within the enterprise is largely dependent on workers’ job satisfaction level. Therefore, it is important on the part of institutions to determine factors influencing job satisfaction and make efforts to improve those factors. A person with no job satisfaction may complain about many factors such as actual working conditions, tools used in work, benefits obtained from the job, lack of appreciation and social prestige.
Educational/training institutions are an example of where employees should have high job performances. Higher efficiency of the educational institution and the ability to enable lecturers work in a peaceful environment important and, if necessary, adjustments should be made to ensure such conditions. It is observed that, based on current economic conditions, personnel working in educational institutions either resign, or they start to work in another job in addition to being a lecturer. This is likely to reduce educational quality and undermines the goal of a workforce with desired qualifications (Is¸ikhan, 1996, p. 117).
Fulfilling the job satisfaction of academic personnel working at vocational high schools is very important considering the contributions made by academicians both to their lives and the students educated by them and the institution where they work. This current study was conducted to determine the job satisfaction level of academic personnel working in vocational high schools operating under the umbrella of state and foundation universities, which offer educational services in Turkey, and to reveal the differences between two groups and the underlying reasons for these. In the study, definitions of job satisfaction were primarily addressed and brief information was provided on vocational high schools operating in Turkey and later, findings, methods and analyses of the study are described.
Since no study was encountered in the literature survey that particularly addressed the level of the job satisfaction of the academic staff working in the vocational schools in Turkey in a way to cover all public and foundation universities, the study was carried out for the purpose of filling this gap.
2. Job satisfaction
Many different definitions are offered by many authors for the concept of job satisfaction. The underlying reason is that there are many factors influencing or forming the job satisfaction of any individual and the definitions are largely based on those factors (Bozkurt and Bozkurt, 2008, p. 2).
It is about determining how satisfied an employee is with her/his job. Cranny, Smith and Stone (1992) defined this as the emotional reaction of the employee to the job by suggesting that there is clear consensus on the definition of job satisfaction. To clarify, job satisfaction is possible if material and non-material rewards are equal to realized ones in a workplace, while job dissatisfaction will be the case if the realized level does not align with the expectations. Likewise, a subject will have the expectation that when he/she takes a position in an organization, and he/she will be satisfied with the job and the position and her/his productivity and performance will increase as long as baseline expectations are met (Nelson and Quick, 1995, p. 116).
People want to present and realize their personal potential. Any adverse condition or perception hindering realization will lead to job dissatisfaction and accordingly to
QAE
22,2
psychological problems and complaints (Tanriverdi, 2006, p. 1). Job satisfaction increases productivity, while job dissatisfaction will decrease the productivity and performance of the employee. Lower job satisfaction of employees in organizations or in other words, the presence of job dissatisfaction will not only cause personal negative outcomes. When organizational outcomes are considered, several adverse events will be experienced including lack of desire to go to work, resigning, feeling of inadequacy, inability to cooperate, vocational errors, desire to quit the job, making wrong decisions and decreases in quality and quantity of outputs (Dilsiz, 2006, p. 39).
One of most important factors of the modern administration approach is job satisfaction, which has several managerial and behavioral outcomes. The best indicator of labor problems in an organization is the decrease in job satisfaction. Job dissatisfaction weakens the immunity system of the organization resulting in decreased reaction or no reaction to internal and external threats. Similarly, it is known that there is a close relationship between physical and mental health of employees and job satisfaction. The job dissatisfaction of employees may result in mental and physical behavioral disorders. Job dissatisfaction causes emotional and nervous disorders including but not limited to insomnia, lack of appetite, emotional burnout and disappointment. In conclusion, it may be speculated that job dissatisfaction causes many symptoms by creating vicious cycles in employee’s lives (Miner, 1992, p. 119).
Factors influencing job satisfaction can be divided into three groups of factors, namely, internal, external and personal factors:
(1) Internal factors involve the principal features of the job. These include diversity of skills required for the job, job identification, implication of the job, self-government awarded to the employee when the job is done and feedback on performance. If the job fulfills those requirements, the employee will feel greater satisfaction and take responsibility. Job satisfaction leads to motivation and increased performance lower absenteeism and labor turnover.
(2) External factors are related with conditions such as pay, physical working conditions, promotion conditions, relations with superiors and peers, creativity, occupational safety, organizational culture and organization structure. In addition to five features of internal factors, the content of external factors will ensure stronger job satisfaction. Those features are largely determined according to organizational policy, corporate culture and social conditions. (3) Personal factors involve demographics (gender, age, terms of office and
education level etc.) and qualifications such as personality, incentive, knowledge and skills (Ceyhun and O¨ zaydın, 2009, p. 49).
The subject going out to work has a particular personality and mental structure which originate from life and socialization experiences gained so far. This structure is expressed as “expectations from work life”. The beginning of work life is the process involving both the subject’s expectations from workplace and workplace’s expectations from the subject. A part of those expectations is illustrated in Table I (Aytac¸ et al., 2001, p. 58).
Moorhead and Griffin (1998) collected factors leading to job satisfaction or dissatisfaction under three titles, as it can be seen in Figure 1: organizational factors, group factors and personal factors. If those factors are considered for academicians, organizational factors include any and all types of economic rewards awarded by the
Job satisfaction
of academic staff
management of the university to academicians (particularly wages), structure and managerial policies of the university, communication, promotion opportunities and technologies and working conditions. Group factors include vertical relationships which are also referred to as hierarchical relations within the university and horizontal relationships referring to relationships with other staff of similar status. Social relations in the workplace play a significant role in job satisfaction. Personal factors are about different characteristics of academicians including, but not limited to, personality, attitude, skills and experience, age, gender, education, requirements and expectations. (Aytac¸ et al., 2001, p. 63).
A university is an education and training facility where scientific activities are performed and students are offered skills in scientific thinking in addition to vocational training and thus, lecturers of universities are involved in academic processes where these requirements must meet expectations. These include:
. Having a good level of income in exchange for doing an academic job. . Having labor protection.
. The university is equipped with modern tools and materials as well as all
advanced technologies.
Expectations of the subject from the work place Expectations of organizations from subjects
Wage An honest day’s work
Personal development opportunity Organizational loyalty A good job definition and approval Initiative, assertiveness
Safety and environmental benefits Compatibility to organizational norms Friendship and support from peers Job activity
Clear and correct effort Flexibility and willing to learn and develop Source: Kotter (1973)
Table I.
Personal and institutional expectations
Figure 1.
Underlying reasons of job satisfaction or
dissatisfaction
QAE
22,2
. An environment enabling good relationships with workmates. . Ability to have academic titles and opportunity for promotion. . The job is well regarded by every sections of the society. . Being well regarded as a lecturer.
. Having the opportunity to develop personal knowledge, skills and experiences
(Aytac¸ et al., 2001, p. 61).
3. Vocational colleges in Turkey
Vocational and technical education starts at level of secondary (high school) schools in Turkey. Vocational and technical schools (at secondary level) are affiliated to the Ministry of Education (MoE). Pursuant to Law No. 2547 (2547/3i), a vocational high school (VHS) is a college which aims to train and educate the intermediate labor force for particular professions and offers four-year education and training. VHS provide two-year degrees. The first, vocational high schools were opened in the education year 1974-1975 under the umbrella of the Ministry of Education and later, they became affiliated to universities in 1981. Accordingly, they were covered by the Committee of Higher Education. Vocational High Schools can be grouped into three types including Vocational High School, Foundation Higher Education Institute’s VCS and other VCS (Gu¨nay and Gu¨nay, 2010):
(1) VCS ¼ State University’s VCS þ Foundation Higher Education Institute’s VCS þ Other VCS.
(2) Foundation Higher Education Institute’s VCS ¼ Foundation University’s VCS þ Foundation’s VCS.
(3) Other VCS ¼ Police VCS þ Sergeant VCS (affiliated to Turkish Armed Forces). In addition to these VCSs which are established under 13 different names, there are Police VCS which are affiliated to General Directorate of Security and there are Sergeant VCS which are affiliated to Turkish Armed Forces and these last two VCS are not under the umbrella of the Higher Education Council. These are referred as “Other VCS”. Number of Other VCS is 31 as of Year 2010.
The number of lecturers working in vocational high schools was 12,160 as at 2010. As can be seen in Table II, the percentage of lecturers working in State University’s VCS is 76 percent, while corresponding figure is 10 percent for Foundation University’s VCS, 1 percent for Foundation’s VCS and 13 percent for other VCS.
VCS type VCS quantity Number of lecturers employed Percentage of total
State University’s VCS 586 9,209 76 Foundation University’s VCS 349 1,235 10 Foundation’s VCS 9 169 1 Other VCS 31 1,547 13 Total 660 12,160 100 Source: 5VHSmt.sdu.edu.tr/doc/prof.dr.durmus_gunay_acilis_konusmasi.ppt Table II. Number of lecturers per type of VCS as of year 2010
Job satisfaction
of academic staff
4. Literature review
When the studies made previously about the subject were analyzed, it was detected that the studies with respect to this subject addressing the levels of job satisfaction of the academic staff working in the universities were generally limited to the academic staff working in one or a few universities or they consider a few variables related to job satisfaction. The distinctive feature of this study was its coverage of all vocational high schools of the foundation and public universities operating in Turkey and the consideration of all variables which have an influence on job satisfaction.
There are a number of studies related to the measurement of the level of the job satisfaction of the academic staff. As the number of the studies related to the subject is high, some of the studies published in the last three years are now mentioned briefly. Aksu (2012) examined the job satisfaction levels of 114 personnel working in Bursa Police College and the demographic variables affecting job satisfaction. In general, there is a high level of job satisfaction. Significant differences were detected between the state of education and the variables of status and job satisfaction. In contrast with this, no significant interaction could be found between the variables of sex, age, marital status, seniority, rewarding and branch and the mean general satisfaction.
Naktiyok and Kaygin (2012) tried to determine the levels of burnout and job satisfaction of the Caucasian University. As a result of their studies, with respect to job satisfaction, the levels of the quality of the job and job safety were detected to be satisfactory and salary, human relations, working conditions and promotion levels were found to be partially satisfactory.
S¸ıkklar et al. (2011) researched the job satisfaction and emotional burnout of the academic staff of the Osmangazi University and Anadolu University using gender and academic staff level. According to the results obtained from the study, it was established that there were not any relationships between the increase in the level of the academic staff and performance and reward, and that this opinion was supported by the male academicians. With regard to the expression “regarding oneself as a part of the team” male academicians do not regard themselves as a part of the team, and females were found not to support that view and they demonstrated medium level participation.
Berberog˘lu and Sag˘lam (2010) tried to determine the current levels of the burnout and job satisfaction of the academic staff in vocational high schools, the factors affecting these and the precautions which must be taken, by keeping the academic staff who work in the vocational high schools in the eastern Black Sea Region within the scope. They found significant differences between the age groups and the education level and the burnout level. Moreover, the level of the job satisfaction played an important role in the determination of the burnout level and the increase in job satisfaction of the academic staff decreases the burnout level.
C¸iivilidag˘ and Sargın (2013) examined data on 279 male and 250 female participants among the academician groups in Turkey. This study analyzed academics’ job satisfaction and clustering levels in terms of gender, type of university and title variable and to identify whether there is a relation between clustering and job satisfaction levels or not. Results indicated that clustering and job satisfaction did not show a significant difference in terms of gender. However, it was determined that the academics in state universities were exposed to clustering more than at foundation universities. Other results were that the job satisfaction of academics in foundation
QAE
22,2
universities was higher than that of those in state universities. The research assistants were exposed to clustering more than other academics. Professor with Doctorates have more job satisfaction levels than the others.
Raza (2012) tried to present the relation between job satisfaction and occupational stress in the faculty using universities in the state of Punjab as a base. The aims of the study were to examine the overall stress level of the faculty, to present the effects of the various factors on the job satisfaction, to realize the overall level of the job satisfaction of the faculty, and to examine the relation between occupational stress and job satisfaction. The results showed that most of the academicians (teachers) do not perceive the occupational stress as a great problem in the university environment. According to them, the factors making a great contribution to the job satisfaction are the factors related to the management. Finally, the conclusion obtained from the study was that there was an insignificant relation between occupational stress and job satisfaction.
Saba (2011) made a study in order to measure the level of job satisfaction of academic staff in Bahawalpur College. According to the study, important factors which have influenced job satisfaction were working on their own account, salary, promotion opportunities, working conditions, occupational safety and work colleagues. Simple ratios showed that academic staff were satisfied more with working on their own account, salary, working conditions, occupational safety and work colleagues and less with promotion opportunities.
Malik (2011) made his study using 120 faculty members in Balochistan University as a base. The major purpose of this study was to examine factors affecting job satisfaction of faculty members at the University of Balochistan using Herzberg’s job motivator and hygiene factors. The results of this study were as follows: the faculty members were generally satisfied with their jobs. However, male faculty members were less satisfied than the female faculty members. The factor “work itself” was the most motivating aspect for faculty. The least motivating aspect was “working conditions”. The demographic characteristics (age, years of experience, academic rank, degree) were negligibly related to overall job satisfaction.
Ssesanga and Garrett (2005) conducted a study to research the factors contributing the satisfaction and dissatisfaction of academic staff in higher education in the developing world. A total of 182 participants from two universities in Uganda constituted the scope of their study. This study reported that the behaviors, the control and the teaching of work colleagues of the teaching assistants are more common factors for the estimation of their satisfaction related to their internal appearance.
Okpara et al. (2005) researched the effects of sex on the job satisfaction of the academicians in the USA. According to the findings obtained, the sex differences were obvious on the job satisfaction of the university academicians. While female academicians had higher satisfaction regarding the job and working colleagues, male academicians had higher satisfaction regarding salary, promotion, control and overall job satisfaction. The results showed that the difference was statistically significant.
Ku¨sku¨ (2001) conducted research with 191 academicians in the most established and institutional public university in Istanbul. The aim of the study was to research the level of the academic personnel in the public university. According to the results of the study, although the satisfaction levels along various dimensions were not high, the “Professional satisfaction” and the “Institutional job satisfaction” were the factors with
Job satisfaction
of academic staff
which most of the participants were satisfied. These factors had a positive influence on the overall satisfaction levels of the employees.
5. Study methodology 5.1 Aim of the study
This study aimed to highlight the differences between the public and foundation universities by determining the level of job satisfaction of academic personnel working at the vocational schools within the body of public and foundation universities in Turkey.
5.2 Limitations and hypothesis of current study
The current study included a population of 12,160 academic personnel throughout Turkey and the questionnaire form used as a data collection instrument could not be delivered to all the personnel. This is because it was not possible to have access to the e-mail addresses of some of the academic personnel, some of the e-mail addresses were not in use, or updated and besides, some personnel do not use the internet.
Three questions were focused on in this study: The first question was to establish the most important factors affecting the job satisfaction or dissatisfaction of the academic personnel working at the public and foundation universities; the second was to determine whether there was a difference between public and foundation universities and the third was to set forth the reasons, if any, for these differences. 5.3 Scope of current study
The population for the present study comprised of 12160 (Table II) academics working at the Vocational Schools of Higher Education (VHS) in Turkey. The e-mail addresses of 1,216 academics, which constituted 10 percent of total, were randomly selected, sending the questionnaire to their e-mail addresses (given in the web-site of the universities they work in); however, some of the e-mails failed to be delivered (either because the e-mail address was not in use or the mailbox was full). The number of questionnaires completed was 320 and a sufficient number at 5 percent level of significance is obtained (Aytac¸ et al., 2001, p. 103). Hence, 2.5 percent of all the academics working in Vocational Schools of Higher Education (VHS) were included in the present study. The questionnaires were filled in January and February 2011. The analyses were carried out using SPSS 17.0.
5.4 Research method
In the present study, the questionnaire form developed by Ardic and Bas (2001), and used in a similar study was taken as a basis and some modifications were made to the form. 85 questions in total were included in the questionnaire, eight of which were about demography and 77 of which were about the opinions of academics on their professional lives. The opinion questions were measured using five point Likert scale (1 ¼ Strongly disagree,... 5 ¼ Strongly agree). Factor analysis was used to reveal the real causes lying behind a number of characteristics which were measured and observed i.e. the hidden dimensions which cannot be observed and measured (Hair et al., 1998, pp. 95-97). The reliability of the questionnaire was evaluated by considering the Cronbach alpha coefficient and some statistical methods such as independent samples t tests and chi-squared tests were used depending on the data to establish
QAE
22,2
statistically significant differences of opinion based on demographic characteristics by analysing the frequencies and percentages relating to the demographic characteristics. 5.5 Findings of the present study
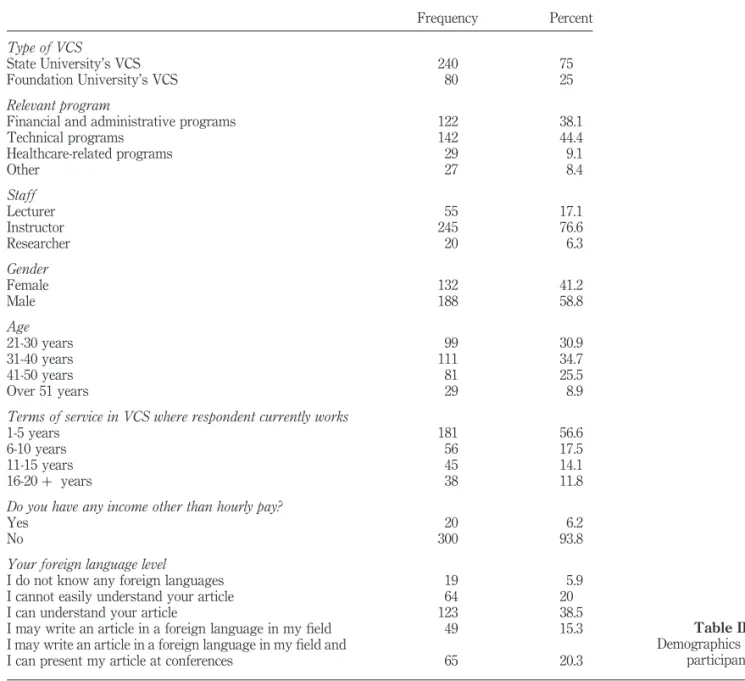
According to the reliability analysis results of the questionnaire, the Cronbach’s Alpha Coefficient was found to be 0.80, which shows that the questionnaire was very reliable (Nakip, 2006, p. 146). The demographic characteristics of the participants are given in Table III. Frequency Percent Type of VCS State University’s VCS 240 75 Foundation University’s VCS 80 25 Relevant program
Financial and administrative programs 122 38.1
Technical programs 142 44.4 Healthcare-related programs 29 9.1 Other 27 8.4 Staff Lecturer 55 17.1 Instructor 245 76.6 Researcher 20 6.3 Gender Female 132 41.2 Male 188 58.8 Age 21-30 years 99 30.9 31-40 years 111 34.7 41-50 years 81 25.5 Over 51 years 29 8.9
Terms of service in VCS where respondent currently works
1-5 years 181 56.6
6-10 years 56 17.5
11-15 years 45 14.1
16-20 þ years 38 11.8
Do you have any income other than hourly pay?
Yes 20 6.2
No 300 93.8
Your foreign language level
I do not know any foreign languages 19 5.9
I cannot easily understand your article 64 20
I can understand your article 123 38.5
I may write an article in a foreign language in my field 49 15.3 I may write an article in a foreign language in my field and
I can present my article at conferences 65 20.3
Table III. Demographics of participants
Job satisfaction
of academic staff
193
5.6 Relations analyses
In this part of the present study, the opinion questions consisting of 58 statements in the questionnaire form were subjected to factor analysis. One of the important things in factor analysis is the sample size. Sources suggest that the number of observation should be four to five times the number of variables; when it is four times, it could be regarded as very good and when it is five times, it is accepted as ideal (Malhotra, 1996, p. 647). There are 58 statements included in the factor analysis and the sample size is five times the number of variables, 320 people. The result of the KMO test (helps measure the sampling adequacy) must be 60 percent or higher. In the present study, KMO value was found to be 90 percent, Bartlett’s Test of Sphericity level of significance prove to be 0.000 and thus, the present study was found to be statistically significant. As a result of the factor analysis, 12 factors in total were obtained by selecting the factors with eigenvalues values equal to 1 and higher among 58 statements and the Eigen values and variances of these factors are given in the Rotated Component Matrix (It is noted in the Table of the Rotated Component Matrix in the Appendix (Table AI), which shows the variables included by those 12 factors). While one of the methods used in calculating the number of factors is to consider the factors, the Eigen value of which is 1 and more, another way of determining the number of factors is to see the variance ratio. It is suggested that the factors be modeled until the cumulative variance reaches a satisfactory level. This ratio is 60 percent or more in social science-related studies (Nakip, 2006, p. 432). In Table IV, it was observed that there are 12 factors, the Eigen values of which is more than 1 and their cumulative variance is 64.3 percent.
The factors were named based on the common characteristics of the variables that they included. Accordingly, the names of 12 factors were as follows:
(1) Managerial environment and communication. (2) Reliance on the leader.
(3) Relationships with workmates.
Rotation sums of squared loadings Component Total Percentage of variance Cumulative percentage Managerial environment and communication 6.512 11.037 11.037
Reliance to the leader 6.102 10.343 21.380
Relationships with workmates 4.198 7.115 28.495
Quality of work 3.925 6.653 35.148
Technical support 2.724 4.618 39.766
Social benefits 2.449 4.151 43.917
Extra workload 2.069 3.507 47.424
Academic dissatisfaction 2.057 3.486 50.910
Free working environment 2.032 3.444 54.354
Wage 2.031 3.443 57.797
Academic support 2.021 3.426 61.222
Concern to become unemployed 1.806 3.061 64.283 Note: Extraction method: Principal component analysis; 12 components extracted Table IV. Eigenvalues and variances of factors
QAE
22,2
194
(4) Quality of work. (5) Technical support. (6) Social benefits. (7) Extra workload.
(8) Academic dissatisfaction. (9) Free working environment. (10) Wages.
(11) Academic support.
(12) Concern about becoming unemployed.
A total of 64.283 percent of the job satisfaction is explained by the 12 factors and “Managerial environment and communication”, “Reliance on the leader”, “Relationships with workmates” and “Quality of work” factors were the factors which provided highest contribution. It is noted in Table IV that the contribution of “Extra workload”, “Academic dissatisfaction”, “Free working environment”, “Wages”, “Academic support”, and “Concern about becoming unemployed” to the explanation of job satisfaction is less.
As there are two independent groups, the independent sample t test was used in researching whether there is a difference between the academics working in public and foundation universities based on 12 factors that affect the job satisfaction of academics. The results are given in Table V.
The participants were administered questions on their academic environment and whether there is a difference between the academics working in public and foundation universities was tested using the independent samples t test based on these questions and the results included in Table VI were obtained.
The academics working in foundation universities stated that being an academic is not attractive, the course load is too much, they cannot find time for their own academic studies, they were not free during out-of-class time, they had difficulty in taking time-off and lecturing in other institutions, their teaching performance was not appreciated, their universities did not sufficiently encourage them to take part in scientific congresses and symposiums and did not financially support them and they cannot decide how long they taught in a class, while academics working in public universities gave more positive answers to these questions.
The academics working in public universities stated that the attitudes and behaviors of students demotivated them in their teaching. The opinions of academics on the universities they work for are presented in Table VII.
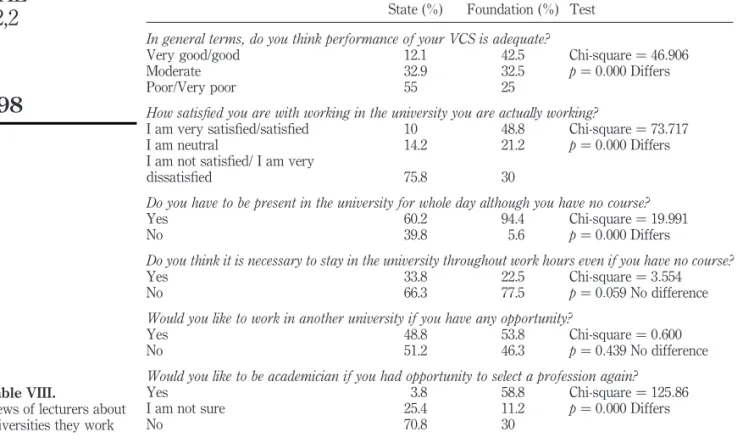
The opinions of the academics on several issues about the university they still work in were received and the results are presented in Table VIII accordingly. In the present study, it was also found that there are striking differences between the opinions of the academics working in public and foundation universities. While 55 percent of the academics working in public universities answered the question “How do you find your VHS’s performance in general?” As bad/very bad, this ratio in foundation universities is 25 percent. While 75.8 percent of the academics working in public universities answered the question “Are you content with working in this university in general?” as not content and strongly not content, 30 percent of the academics working
Job satisfaction
of academic staff
Hypotheses t Sig. (two-tailed) Decision There is no difference between views of lecturers working
in state and foundation universities in terms of
managerial environment and communication factor 1.302 0.194 Not accepted There is difference between views of lecturers working in
state and foundation universities in terms of managerial
environment and communication factor 0.268 0.789 Not accepted There is difference between views of lecturers working in
state and foundation universities in terms of relationships
with workmates factor 2 3.455 0.001 Accepted
There is difference between views of lecturers working in state and foundation universities in terms of work quality
factor 2 1.810 0.071 Not accepted
There is difference between views of lecturers working in state and foundation universities in terms of technical
support factor 5.498 0.000 Accepted
There is difference between views of lecturers working in state and foundation universities in terms of social
benefits factor 3.263 0.001 Accepted
There is difference between views of lecturers working in state and foundation universities in terms of extra work
load factor 2 1.397 0.163 Not accepted
There is difference between views of lecturers working in state and foundation universities in terms of academic
dissatisfaction factor 3.345 0.001 Accepted
There is difference between views of lecturers working in state and foundation universities in terms of free working
environment factor 0.954 0.341 Not accepted
There is difference between views of lecturers working in
state and foundation universities in terms of wage factor 0.025 0.980 Not accepted There is difference between views of lecturers working in
state and foundation universities in terms of academic
support factor 1.060 0.290 Not accepted
There is difference between views of lecturers working in state and foundation universities in terms of concern
about becoming unemployed factor 2 5.783 0.000 Accepted Table V.
Differences between state and foundation
universities with regards to 12 factors influencing job satisfaction of lecturers Factors leading to job satisfaction or dissatisfaction Mean of state university Mean of foundation university Standard deviation of state university Standard deviation of foundation university Relationships with workmates 3.91 4.23 1.137 0.845 Technical support 3.81 3.07 0.734 1.033 Social benefits 3.16 2.72 0.947 0.734 Academic dissatisfaction 2.95 3.23 0.938 1.131 Concern to become unemployed 2.87 3.12 0.623 0.788 Table VI. Means and standard deviations of factors leading to job satisfaction or dissatisfaction
QAE
22,2
Type of VCS Mean Std. Deviation t Sig. Decision A large part of my time
is spent on non-academic activities State 2.73 1.232 0.519 0.604 No difference Foundation 2.65 1.274 Profession of being academician is not prioritized in my university State 2.66 1.307 2 2.129 0.034 There is a difference Foundation 3.03 1.414 I undertake an administrative duty which I preferred State 1.78 1.187 2 1.461 0.145 No difference Foundation 2.01 1.392 I am forced to give other’s courses although I am not volunteer
State 1.53 1.014 2 1.148 0.252 No difference Foundation 1.69 1.218
Work load (courses) is extremely high
State 2.47 1.402 2 4.445 0.000 There is a difference Foundation 3.29 1.486
I am forced to give courses which are not in my field State 2.15 1.382 2 0.206 0.837 No difference Foundation 2.19 1.397 I have no time to conduct my own academic studies State 3.13 1.355 2 2.015 0.045 There is a difference Foundation 3.49 1.423
I am totally free if I have no course to give
State 2.78 1.385 3.501 0.001 There is a difference Foundation 2.16 1.326
I may take time off whenever I need State 4.04 1.145 2.712 0.007 There is a difference Foundation 3.63 1.316 I am allowed to give courses in other departments and even in other institutes
State 3.17 1.512 2.905 0.004 There is a difference Foundation 2.60 1.523
Behaviors and attitudes of students demotivates me in terms of giving courses State 3.54 1.309 3.177 0.002 There is a difference Foundation 2.99 1.471 My performance in giving courses is not appreciated
State 2.67 1.488 2 2.441 0.015 There is a difference Foundation 3.14 1.430
Participation in scientific congresses and symposiums is promoted in my university State 3.47 1.372 2.549 0.011 There is a difference Foundation 3.01 1.454 My university offers financial support to my scientific researches State 2.68 1.406 2.346 0.020 There is a difference Foundation 2.26 1.280 I am not allowed to make my decision on time for combining course hours State 2.27 1.401 2 4.634 0.000 There is a difference Foundation 3.14 1.573 I am required to offer a course book State 1.73 1.082 2 0.827 0.409 No difference Foundation 1.85 1.262 Table VII. Views on the academic environment
Job satisfaction
of academic staff
in foundation universities expressed the same opinion. While 60.2 percent of the academics working in public universities stated they have to be in school even if they do not have a class, this ratio in foundation universities increases to 94.4 percent.
While 70.8 percent of the academics working in public universities answered no to the question “If you had the opportunity, would you choose to be an academic again?”, This ratio in foundation universities falls to 30 percent. Whether there is a statistically significant difference between the opinions of the academics working in public and foundation universities was analyzed using Chi-Square test (Orhunbilge, 1997, p. 224) and it was found that there are some differences at 0.05 level of significance regarding these issues. The academics working in public (66.3 percent) and foundation (77.5 percent) universities gave similar answers to the question “Do you have to be at the university when you have no class?” replying that it was not necessary. While 51.2 percent of the academics working in public universities answered no to the question “Would you like to work in another university if you had an opportunity?” A total of 53.8 percent of the academics working in foundation universities answered yes.
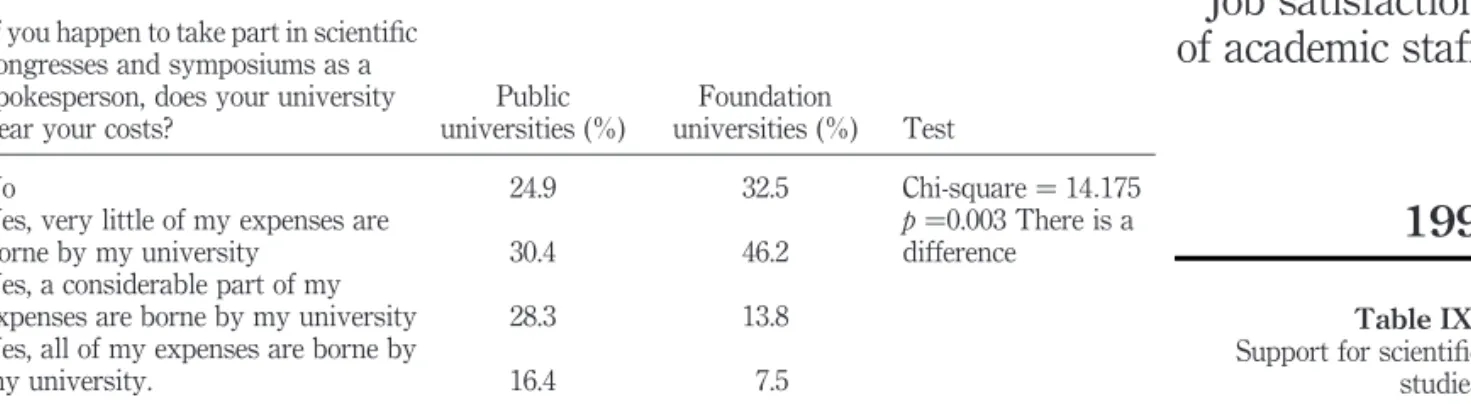
The answers to the question asked to compare the support given by public and foundation universities to scientific studies, one of the primary tasks of academics, were analyzed and results are given in Table IX.
While 44.7 percent of the academics working in public universities stated that their participation expenses attending scientific congresses and symposiums were borne by the university (the answers “yes, a considerable part of my expenses is borne by my
State (%) Foundation (%) Test In general terms, do you think performance of your VCS is adequate?
Very good/good 12.1 42.5 Chi-square ¼ 46:906
p ¼ 0:000 Differs
Moderate 32.9 32.5
Poor/Very poor 55 25
How satisfied you are with working in the university you are actually working?
I am very satisfied/satisfied 10 48.8 Chi-square ¼ 73:717 p ¼ 0:000 Differs
I am neutral 14.2 21.2
I am not satisfied/ I am very
dissatisfied 75.8 30
Do you have to be present in the university for whole day although you have no course?
Yes 60.2 94.4 Chi-square ¼ 19:991
p ¼ 0:000 Differs
No 39.8 5.6
Do you think it is necessary to stay in the university throughout work hours even if you have no course?
Yes 33.8 22.5 Chi-square ¼ 3:554
p ¼ 0:059 No difference
No 66.3 77.5
Would you like to work in another university if you have any opportunity?
Yes 48.8 53.8 Chi-square ¼ 0:600
p ¼ 0:439 No difference
No 51.2 46.3
Would you like to be academician if you had opportunity to select a profession again?
Yes 3.8 58.8 Chi-square ¼ 125:86
p ¼ 0:000 Differs
I am not sure 25.4 11.2
No 70.8 30
Table VIII.
Views of lecturers about universities they work
QAE
22,2
university” and “yes, all of my expenses are borne by my university” were considered together), this ratio is 21.3 percent for the foundation universities.
The academics working in public and foundation universities were compared in terms of job anxiety and the results given in Table X were obtained.
According to Table X, while 70.9 percent of the academics working in public universities do not have the fear of losing their jobs, this ratio for those who work in foundation universities is 31.2 percent. Therefore, the academics working in foundation universities have more fear of losing the job they have compared to those who work in public universities. The risk of non-renewal of contracts creates stress for 27.5 percent of the academics working in public universities; this ratio is 45.2 percent for those who work in foundation universities.
The academics were requested to list the factors they considered to have an influence on job satisfaction from the most important ones to the least important ones and the results are presented in Table XI.
According to Table XI, the three most important factors that create job satisfaction according to 320 academics are job security, qualification of work and academic environment of the university. While wage is listed fourth, the general management policy of the university is listed fifth, the behavior and attitudes of director is listed sixth and the prestige of the university is listed seventh. Workmates and physical working
If you happen to take part in scientific congresses and symposiums as a spokesperson, does your university bear your costs?
Public universities (%)
Foundation
universities (%) Test
No 24.9 32.5 Chi-square ¼ 14:175
Yes, very little of my expenses are
borne by my university 30.4 46.2
p ¼0.003 There is a difference
Yes, a considerable part of my
expenses are borne by my university 28.3 13.8 Yes, all of my expenses are borne by
my university. 16.4 7.5
Table IX. Support for scientific studies State universities (%) Foundation universities (%) Test I have no concerns about becoming unemployed
Completely wrong/wrong 14.1 31.3 Chi-square ¼ 40:354 p ¼ 0:000 Differs
I have no idea 15 37.5
True/completely true 70.9 31.2 Possibility of not extending the duration of contract causes stress
Completely wrong/wrong 57.1 33.8 Chi-square ¼ 20:850 p ¼ 0.000 Differs
I have no idea 15.4 21.0
True/completely true 27.5 45.2
Table X. Views about job protection
Job satisfaction
of academic staff
environment is listed as the last factors. Whether there is a difference in the academics working in public and foundation universities in terms of the factors creating job satisfaction was analyzed and no difference was found. In addition, the differences based on gender were analyzed and no difference was found again; therefore, it was identified that both male and female academics described the factors that create job satisfaction. Another question addressed to the academics was “How much do you rate your VHS out of 100?”. The academics working in public universities rated 67.58, while those working in foundation universities rated 62.99. When the average points given by male and female academics are analyzed, it was very surprising to see that the average was the same, 66 points.
6. Discussion
In the present study, the factors such as quality of work, prestige of vocational schools of higher education, job security, leadership, administrative environment, communication, academic environment, colleagues, wage and working environment were discussed in measuring the job satisfaction and dissatisfaction of the academic personnel.
Among these factors, in terms of “wage” and “colleagues”, the academics working in the vocational schools of higher education in public universities were found to be happier compared to the academics working in the vocational schools of higher education in foundation universities. However, in terms of administrative environment, leadership and working environment, the academics working in public universities have a higher job satisfaction than their counterparts.
Another factor that affects the job satisfaction of academic personnel is “academic environment”. Given these elements under this factor, being academician in foundation universities is seen as second class. This may be because the academics have a considerable workload, which is also suggested by the present study for the academics working in the VHSs of the foundation universities. The compulsory working hours for the academics working on a daytime schedule in public universities is 12 hours a week. Extra payment is made for each hour over this time. Since there is no such agreement in foundation universities (as required by the amended implementations of the foundation universities, academics work for 15-24 hours a week), academic personnel continuously spend their time teaching and cannot find time for their academic studies, which is shown by the results of the present study. It would be helpful for both job
No Factor
1 Job security
2 Qualification of work
3 Academic environment of university
4 Wage
5 General managerial policy of university 6 Behavior and attitudes of director 7 Prestige of university
8 Workmates
9 Physical working environment Table XI.
Factors ensuring job satisfaction according to lecturers
QAE
22,2
satisfaction of academic personnel and the ranking of the related university among others to revise the workload in public universities and to make it within the international standards in public and foundation universities so that the quality of education increases and the academic personnel can have more contribution to the scientific studies of the university they work in doing more research. Another factor that affects the job satisfaction of the academic personnel is undoubtedly the appreciation of their performance. The academic personnel working in VHSs within the body of foundation universities thought that their teaching performance was not appreciated. Again, some elements are included in the academic environment factor but having higher means in public universities compared to foundation universities also attracted our attention. It was concluded that the academic personnel in public universities are free when they do not have a class, they can take time off when they need it and they are allowed to teach in other institutions. Although the student profile in VHSs in public universities seems similar to the VHSs in foundation universities, the academic personnel in public universities stated that the attitudes and behaviors of the students demotivate them to teach.
The academic personnel in vocational schools of higher education in public universities evaluate the performance of the school bad or very bad and they are not content with the school. They would like to work in another university when they have the opportunity. It is the opposite in foundation universities. The academic personnel in vocational schools of higher education in foundation universities evaluate the performance of the school as good or very good and they are content with the school. They stated that they are not considering working in another university and they would prefer being an academic again if they had the opportunity to take up their profession again.
Probably the most important factor in measuring the job satisfaction is the rating by academic personnel. According to 320 academic personnel, the most important factor that creates job satisfaction is job security. While the fear of losing the job that they have is very low for the academic personnel working in VHSs in public universities, this fear was found to be high in foundation universities. However, this does not mean that the academic personnel working in public universities cannot be fired. This is because the risk of losing their job for the academic personnel in public universities creates stress as well. Although it is higher in foundation universities, ultimately, the academic personnel working in VHSs in public universities were anxious about losing their jobs. In determining job satisfaction, job security was followed by the quality of work and the academic environment of the university. The factor that the academic personnel considered in measuring the level of satisfaction was physical working environment. The sequencing of the factors affecting the job satisfaction did not differ in the academic personnel in both public and foundation universities; it also did not differ in terms of gender.
Another question addressed to the respondents was “How much do you rate your VHS out of 100?” and the public universities rated 67.58, while foundation universities rated 62.99. Based on male and female academic personnel, the rates were surprisingly the same, 66 points.
Thus, there were both similarities and differences between the perceptions of respondents from public universities and foundation universities, with the balance lying with the public universities.
Job satisfaction
of academic staff
References
Aksu, N. (2012), “I˙s¸ Tatmininin Bazı Demografik Deg˘is¸kenler Ac¸ısından I˙ncelenmesi (Investigation of the job satisfaction with some demographic variables)”, Turkish Journal of Police Studies, Vol. 14 No. 1, pp. 59-79.
Aytac¸, M., Aytac¸, S., Firat, Z., Bayram, N. and Keser, A. (2001), Working Life and Career Problems of Academicians, Uludag˘ U¨ niversitesi Aras¸tırma Fonu I˙s¸letme Mu¨du¨rlu¨g˘u¨, Proje No 99/29, Bursa.
Berberog˘lu, M. and Sag˘lam, B. (2010), “Meslek Yu¨ksekokulu Akademik Personellerinin Tu¨kenmis¸lig˘i ve I˙s¸ Tatmini U¨ zerine Bir Aras¸tırma (A research about the burnout and the job satisfaction of the academic staff of the vocational high schools)”, Gu¨ mu¨ s¸hane U¨ niversitesi Sosyal Bilimler Elektronik Dergisi, 2, June.
Bozkurt, O¨ . and Bozkurt, I˙. (2008), “A field study for evaluating internal factors influencing job satisfaction with regards to education sector”, Dog˘ us¸ U¨ niversitesi Dergisi, Vol. 9 No. 1, pp. 1-18.
Ceyhun, A.T. and O¨ zaydin, L. (2009), Akademik Personelin I˙s¸ Doyumu: Kars¸ılas¸tırmalı Bir Aras¸tırma (Job Satisfaction of Academic Staff: A Comparative Research), I.Uluslararası Meslek Yu¨ksekokulları Sempozyumu, ISBN: 978-975-448-194-5, Konya.
C¸ivilidag˘, A. and Sargın, N. (2013), “Academics’ mobbing and job satisfaction levels”, The Online Journal of Counseling and Education, Vol. 2 No. 12, pp. 56-66.
Dilsiz, B. (2006), Konya I˙lindeki Ortao¨g˘ retim Okullarında C¸alıs¸an O¨ g˘retmenlerin Tu¨kenmis¸lik Ve I˙s¸ Doyumu Du¨ zeylerinin Bo¨lgelere Go¨re Deg˘erlendirilmesinin C¸ok Deg˘is¸kenli I˙statistiksel Analizi (Multivariate Statistical Analyses of the Assessment of the Levels of the Burnout and the Job Satisfaction of the Teachers Working in the Secondary Education Schools in the Province Konya based on the Regions), Selc¸uk U¨ niversitesi Fen Bilimleri Enstitu¨su¨ Yu¨ksek Lisans Tezi, Konya.
Gu¨nay, D. and Gu¨nay, A. (2010), available at: sempozyum.sdu.edu.tr/../prof.dr.durmus_gunay _acilis_konusmasi.ppt? (accessed 10 June 2013).
Hair, J.F., Erson, R.E., Tatham, R.L. and Black, W.C. (1998), Multivariate Data Analysis, Prentice Hall, Englewood Cliffs, NJ.
Is¸ikhan, V. (1996), “Sosyal Hizmet O¨ rgu¨tlerinin I˙s¸levsellik O¨lc¸u¨tu¨: I˙s¸ Doyumu” (“Functionality criterion of the social services organizations: job satisfaction”), MPM Verimlilik Dergisi, No. 1, pp. 117-130.
Kotter, J.P. (1973), “The psychological contract: managing the joining-up process”, California Management Review, Vol. 15 No. 3, p. 91.
Ku¨sku¨, F. (2001), “Dimensions of employee satisfaction: a state university example”, METU Studies in Development, Vol. 28 Nos 3-4, pp. 399-430.
Malhotra, N.K. (1996), Marketing Research, An Applied Orientation, 2nd ed., Prentice Hall, Upper Saddle River, NJ.
Malik, N. (2011), “Study on job satisfaction factors of faculty members at University of Balochistan”, International Journal of Academic Research, Vol. 3 No. 1, p. 267.
Miner, J.B. (1992), Industrial-Organizational Psychology, McGraw-Hill, Singapore, p. 119. Nakip, M. (2006), Pazarlama Aras¸tırmaları (Marketing Researchs), 2nd ed., Sec¸kin Yayıncılık,
Ankara.
QAE
22,2
Naktiyok, A. and Kaygin, E. (2012), “Tu¨kenmis¸lik ve I˙s¸ Tatmini Du¨zeylerini Belirlemeye Yo¨nelik Akademik Personel U¨ zerinde Bir Uygulama (An application on the academic staff to determine the levels of the burnout and the job satisfaction)”, Sosyal ve Bes¸eri Bilimler Dergisi, Vol. 4 No. 1, ISSN:1309-8012 (Online).
Nelson, D.L. and Quick, J.C. (1995), Organizational Behavior: Foundations: Realities, and Challenges, Alternate ed., West Company, New York, NY, pp. 116-118.
Okpara, O.J., Squillace, M. and Erondu, E.A. (2005), “Gender differences and job satisfaction: a study of university teachers in the United States”, Women in Management Review, Vol. 20 No. 3, pp. 177-190.
Orhunbilge, N. (1997), O¨ rnekleme Yo¨ntemleri ve Hipotez Testleri (Sampling Methods and Hypotheses Tests), Avcıol Basım Yayın, I˙s¸letme Faku¨ltesi Yayın No: 270, I˙s¸letme I˙ktisadı Yayın No 405, I˙stanbul.
Ozkalp, E. and Kirel, C¸. (1997), O¨ rgu¨tsel Davranıs¸ (Organizational Behavior), Anadolu U¨ niversitesi Yayınları, Eskis¸ehir.
Raza, A. (2012), “Relationship between occupational stress and job satisfaction of faculty: the case of universities of Punjab”, Human Resource Management, Elixir Human Res. Mgmt, No. 43, pp. 6913-6920.
Saba, I. (2011), “Measuring the job satisfaction level of the academic staff in Bahawalpur Colleges”, International Journal of Academic Research in Business and Social Sciences, Vol. 1 No. 1.
Ssesanga, K. and Garrett, R.M. (2005), “Job satisfaction of university academics perspectives from Uganda”, Higher Education, No. 50, pp. 33-56, DOI 10.1007/s10734-004-6346-0. S¸ıkklar, E., Yilmaz, V. and C¸oskun, D. (2011), “Eskis¸ehir’deki U¨ niversitelerde Go¨revli Akademik
Personelin I˙s¸ Tatmini ve Duygusal Tu¨kenmis¸liklerinin Log-Linear Modeller ve Correspondence Analizi ile I˙ncelenmesi” (“Investigation of the job satisfaction and the emotional burnout of the academic staff working in the universities in Eskisehir with the log-linear models and the correspondence analysis”), Dokuz Eylu¨ l U¨ niversitesi I˙ktisadi ve I˙dari Bilimler Faku¨ ltesi Dergisi, Vol. 26 No. 2, pp. 113-134.
Tanriverdi, H. (2006), “Sanayi is¸letmelerinde c¸alıs¸anların is¸ tatminsizlig˘i sorunları u¨zerine bir aras¸tırma” (“A research about the job dissatisfaction problems of the employees of the industrial enterprises”), Ekonomik ve Sosyal Aras¸tırmalar Dergisi, Bahar Sayısı, Vol. 3 No. 1, pp. 1-29.
Further reading
Anon (n.d.), adek.balikesir.edu.tr/doc/Ogretim_Elemani_anket.doc (accessed: 10 June 2013). Eren, E. (2001), O¨ rgu¨tsel Davranıs¸ ve Yo¨netim Psikolojisi (Organizational Behavior and
Management Psychology), Beta Publications, Istanbul.
Greasley, P. (2008), Quantitative Data Analysis Using SPSS: An Introduction for Health and Social Sciences, Open University Press, Buckingham, ISBN: 9780335235148.
Weiss, H.M. (2002), “Deconstructing job satisfaction separating evaluations, beliefs and affective experiences”, Human Resource Management Review, Vol. 12 No. 2, pp. 173-194.
Corresponding author
Esra Atabay can be contacted at: [email protected]
Job satisfaction
of academic staff
Appendix Com ponent 12 3 4 5 678 9 1 0 1 1 1 2 1 3 Percent age of variance 11. 03 10.34 7.11 6.6 5 4.61 4.1 5 3.50 3. 48 3.44 3.44 3.4 2 3.06 2.1 5 Mana gerial envir onment and comm unicat ion Problems suffered academic personne l are immed iately solved in my uni versity 0 .785 A chance is giv en for new views and behaviors in my university 0. 783 Promo tion is ba sed on competence in my uni versity 0. 761 Advic es of academic per sonnel on the job are tak en into consideration in m y uni versity 0. 743 Act ivities are usually performed as planned in my university 0. 733 I may present my views in a demo cratic environment provi ded by my uni versity 0. 716 I a m informe d all is sues which are relevant for me 0. 647 I may easily comm unicate my probl ems to superiors 0. 632 My view is taken into cons ideration in all activities relevant for me such as course planning 0. 573 Relia nce to the leader I believe that my chief (dire ctor) is imparti al 0.8 65 I bel ieve th at my chief (dire ctor) is competent to fairly do her/hi s work 0.8 49 I believe that my chief (dire ctor) fully meets her /his duties and responsibilities 0.8 21 I like behaviors an d atti tudes of my chief (dire ctor) 0.8 16 I believe that my chief (dire ctor) is honest 0.8 04 I believe that my chief (dire ctor) alway s prior itizes benefits of the inst itution 0.7 47 I a m sure that my chief (directo r) will alway s provi de support to me 0.7 13 Rela tionship s with workmates My workma tes help me if I experience an y pro blem 0.894 My workma tes value my views 0.886 I have good relat ionships with my workm ates 0.850 I may conduct joint studi es with other lecturers o f the department 0.807 My workma tes are experts of relevant fie lds 0.791 (continued ) Table AI. Rotated component matrix
QAE
22,2
204
Com ponent 12 3 4 5 678 9 1 0 1 1 1 2 1 3 Percent age of variance 11. 03 10.34 7.11 6.6 5 4.61 4.1 5 3.50 3. 48 3.44 3.44 3.4 2 3.06 2.1 5 Qua lity of work I may use my creativity in my job 0.7 55 I have a job in alignm ent wi th my knowledge and skills 0.7 11 My job makes cont ribution to my per sonal developm ent 0.7 01 I a m doing a job which I like 0.6 96 My job fulfills my expectations 0.6 41 VCS is a source of prestige for me 0.4 97 I a m dealing with activities on ly if they are req uirements of my job 0.4 36 My powe r a n d res ponsibilities in my job are clearly defined 0.4 23 Techn ical supp ort Acce ss to interne t 0.749 Printing and photocopy means 0.737 Offic e 0.615 Meal se rvice 0.527 Socia l ben efits Healt hcare 0.7 03 Trans porta tion 0.6 79 Library 0.6 77 Sport facilities 0.5 55 I believe tha t m y university holds a prestigious po sition among other universities 0.4 11 Extra work load (forc ed la bor) I a m forced to giv e oth er’s cours es although I am no t volunteer 2 0.801 I a m forced to giv e cours es which are not in my field 2 0.717 Aca demic dissat isfaction I have no time to conduct my ow n aca demic studies 0. 699 Work load (c ourses) is extremel y hig h 0 .683 Behavi ors an d atti tudes of student s demot ivates me in terms of giving courses 0. 570 My performance in giving courses is not ap preciated 0. 419 (continued ) Table AI.
Job satisfaction
of academic staff
205
Com ponent 12 3 4 5 678 9 1 0 1 1 1 2 1 3 Percent age of variance 11. 03 10.34 7.11 6.6 5 4.61 4.1 5 3.50 3. 48 3.44 3.44 3.4 2 3.06 2.1 5 Free working envir onment I a m allowed to give courses in oth er departments and even in oth er institutes 0.647 I a m totally free if I have no course to give 0.628 I may take time off whenever I need 0.520 Wage Ia m suffering financ ial difficulty 0.783 I a m paid less tha n I deserve 0.753 Wage pa id for eveni ng education curses is inadequat e 0.707 Aca demic suppo rt Profe ssion of being aca demician is not pri oritized in my university 2 0.6 71 A large part of my time is spent to no n-academic activities 2 0.6 54 Parti cipation to scient ific congresses and sympos iums is prom oted in my uni versity 0.5 28 My university offers financial support to my scientific researches 0.4 88 I unde rtake an ad ministrative duty whi ch I preferred 2 0.4 20 Conc ern to beco me unemploy ed Possibility of no t extendi ng th e duration of contra ct causes stre ss 0.807 I have concerns about becoming unemployed 2 0.592 I a m not allowed to make my dec ision on tim e for combi ning course hours 0.386 Notes : Extracti on method: Princ ipal component analysis; Rotat ion met hod: V arimax with Kais er norm alization; Rotat ion conve rged in nin e itera tions Table AI.