Boz
2, Sıho Hidayet
2, Hasan Pekdemir
4Department of Cardiology – İstanbul Bilim University School of Medicine1, İstanbul, Turkey; Department of Cardiology – Malatya State Hospital2, Malatya, Turkey; Department of Cardiology – Ahi Evran University Education And Research Hospital3, Kırsehir,Turkey; Department of Cardiology – İnönü University School of Medicine4, Malatya, Turkey
Mailing Address: Özgür Kaplan •
Istanbul Bilim University Department of Cardiology. Department of Cardiology, Ýstanbul Bilim University School of Medicine, Istanbul – Turkey, Sisli – Istanbul
E-mail: [email protected]
Manuscript received May 24. 2015; manuscript revised July 15, 2015; accepted August 10, 2015.
DOI: 10.5935/abc.20150124
Abstract
Background: The association between periatrial adiposity and atrial arrhythmias has been shown in previous studies. However, there are not enough available data on the association between epicardial fat tissue (EFT) thickness and parameters of ventricular repolarization. Thus, we aimed to evaluate the association of EFT thickness with indices of ventricular repolarization by using T-peak to T-end (Tp-e) interval and Tp-e/QT ratio.
Methods: The present study included 50 patients whose EFT thickness ≥ 9 mm (group 1) and 40 control subjects with EFT thickness < 9 mm (group 2). Transthoracic echocardiographic examination was performed in all participants. QT parameters, Tp-e intervals and Tp-e/QT ratio were measured from the 12-lead electrocardiogram.
Results: QTd (41.1 ± 2.5 vs 38.6 ± 3.2, p < 0.001) and corrected QTd (46.7 ± 4.7 vs 43.7 ± 4, p = 0.002) were significantly higher in group 1 when compared to group 2. The Tp-e interval (76.5 ± 6.3, 70.3 ± 6.8, p < 0.001), cTp-e interval (83.1 ± 4.3 vs. 76±4.9, p < 0.001), Tp-e/QT (0.20 ± 0.02 vs. 0.2 ± 0.02, p < 0.001) and Tp-e/QTc ratios (0.2 ± 0.01 vs. 0.18 ± 0.01, p < 0.001) were increased in group 1 in comparison to group 2. Significant positive correlations were found between EFT thickness and Tp-e interval (r = 0.548, p < 0.001), cTp-e interval (r = 0.259, p = 0.01), and Tp-e/QT (r = 0.662, p < 0.001) and Tp-e/QTc ratios (r = 0.560, p < 0.001).
Conclusion: The present study shows that Tp-e and cTp-e interval, Tp-e/QT and Tp-e/QTc ratios were increased in subjects with increased EFT, which may suggest an increased risk of ventricular arrhythmia. (Arq Bras Cardiol. 2015; [online].ahead print, PP.0-0)
Keywords: Pericardium; Adipose Tissue; Electracardiography; Arrhythmias, Cardiac; Reference Values.
Introduction
QT interval (QT), corrected QT interval (QTc), QT dispersion and transmural dispersion of repolarization are generally used for the evaluation of myocardial repolarization. Tp-e, which is the interval between the peak and the end of T wave on electrocardiogram (ECG), is accepted as an index of transmural dispersion of ventricular repolarization1. However, it is affected by variations in heart rate and body weight. Tp–e/QT and Tp-e/ QTc ratios have been suggested as more accurate measures for the dispersion of ventricular repolarization compared to others parameters, and are independent from heart rate alterations2,3.
Growing evidence has recently suggested that epicardial fat tissue (EFT), a particular form of visceral fat deposited around the
heart, may be a new marker of visceral adiposity and an important source of inflammatory mediators4-6. Furthermore, because of the close anatomic proximity to the heart and the absence of fascial boundaries between EFT and the heart, EFT may locally interact with the coronary arteries and myocardium via production of proinflammatory adipokines, which can enhance local inflammation and directly induce myocardial remodeling6-9.
Previous studies have consistently shown an association between EFT and atrial arrhythmia such as atrial fibrillation (AF)10-12. However, there are not enough available data regarding the association between EFT and ventricular arrhythmia. Therefore, we aimed to evaluate the possible association between EFT and ventricular repolarization, which is an indicator of ventricular arrhythmia risk.
Methods
Study population
Participants were recruited among patients admitted to the cardiology department of our hospital for general control. A total of 90 consecutive subjects were included in the present study. The number of the study participants
was based on the power analysis. Patients were divided into two groups. The first group (Group 1) consists of subjects with EFT thickness ≥ 9 mm and the second group (Group 2) consists of subjects with EFT thickness < 9 mm. EFT thickness was chosen according to previous studies13-16. All patients’ baseline information including age, gender and body mass index (BMI) was recorded and cardiovascular risk factors were determined: hypertension (HT), diabetes mellitus, smoking and cardiovascular medication use [angiotensin-converting enzyme inhibitors (ACEI), angiotensin-II receptor blockers (ARB), calcium-channel blockers (CCB), β-blockers, antiarrhythmic agents and statins]. Patients with a documented history of coronary artery disease by coronary angiography or computed tomography angiography, moderate-to-severe valvular heart disease, prior pacemaker implantation, AF, heart failure, chronic lung disease, cerebrovascular disease, hepatic or renal failure (alanine aminotransferase and aspartate aminotransferase > 2-fold normal levels, serum creatinine > 1.5 mg/dL), bundle branch block and atrioventricular conduction abnormalities on ECG, abnormal thyroid function test, abnormal electrolyte values, use of β-blockers, CCBs and antiarrhythmic agents were excluded from the study. ECGs without clearly analyzable Tp-e interval and QT segment were also excluded. All patients were in sinus rhythm and none of them were taking medications affecting QT and Tp-e intervals such as antibiotics, tricyclic antidepressants, antihistaminics and antipsychotics. The study was approved by the local ethics committees and adhered to the Declaration of Helsinki, and all subjects gave written informed consent.
Echocardiographic and Electrocardiographic Examination
All echocardiographic examinations (Vivid 7 Pro, GE Vingmed, Milwaukee, Wisconsin, USA) were performed in all patients with the 4-Mhz transducer of Vivid 7 pro (GE Vingmed, Milwaukee, Wisconsin, USA). Interpretation of echocardiographic examinations was performed by two cardiologists who were blinded to ECG measurements of the study population. During echocardiographic examination, 1-lead ECG was recorded continuously, and three consecutive cycles were averaged for every measured parameter. Two-dimensional and pulsed Doppler measurements were performed according to the criteria of the American Society of Echocardiography17. The following two-dimensional echocardiographic parameters were measured: left ventricular end-diastolic diameter (LVEDD, mm), left ventricular end-systolic diameter (LVESD, mm), left ventricular ejection fraction (LVEF, %), left atrium (LA) and EFT. The LVEF was estimated using Simpson’s rule. The EFT was measured according to a previously described and validated method6. Briefly, the epicardial fat was identified as the echo-free space between the myocardium outer wall and the pericardium visceral layer and it was measured perpendicularly on the free wall of the right ventricle at the end diastole in the transthoracic parasternal long-axis view in three cardiac cycles (Figure 1). The maximum value at any site was measured and the average of 3 values was calculated.
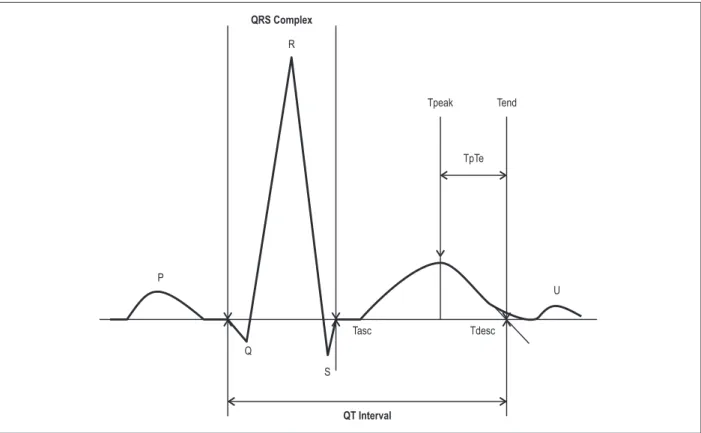
The 12-lead ECG was performed at a paper speed of 50 mm/s with the subject at rest in the supine position. The resting heart rate was then measured from the ECG data. ECG measurements of QT and Tp-e intervals were performed manually by two different cardiologists, using calipers and a magnifying glass to decrease measurement errors. The cardiologists were blinded to the echocardiographic measurements of the study population. Subjects with U waves on their ECGs were excluded from the study. The average value of three examinations was calculated for each lead. The QT interval was measured from the beginning of the QRS complex to the end of the T wave, and corrected for heart rate using the Bazett formula18. The QTd was defined as the difference between the maximum (QTmax) and minimum QT (QTmin) intervals of the 12 leads. The difference between the corrected QTmax (cQTmax) and corrected QTmin (cQTmin) was defined as corrected QTd (cQTd)19. The Tp-e was measured in each precordial lead and obtained from the difference between QT interval and QT peak interval; measured from the beginning of the QRS until the peak of the T-wave (Figure 2). In case of negative or biphasic T waves, QT peak was measured to the nadir of the T-wave. T waves smaller than 1.5 mm in amplitude were not measured. The reported Tp-e value was the maximum obtained by two observers in all precordial leads20.
Statistical Analysis
SPSS 17.0 statistical program (SPSS Inc., Chicago, IL, USA) was used for the statistical study. All parametric values were shown as means with standard deviation. Continuous variables were compared between groups using the Student’s t test or Mann–Whitney U test, according to whether normally distributed or not, as tested by the Kolmogorov–Smirnov test. The chi-square test was used to assess differences between categorical variables. Pearson’s correlation analysis was used to examine possible associations between EFT and ventricular repolarization parameters. A p value of less than 0.05 was considered significant.
Results
In all, 102 patients were enrolled in the present study, of which 12 were excluded for reasons such as ECGs without clearly analyzable Tp-e interval and QT segment. Baseline clinical, demographic and echocardiographic parameters of the study participants are listed in Table 1. Age, gender, BMI, smoking status, HT and dyslipidemia were similar between the two groups, as were LVEDD, LVESD, EF, LA diameter, IVS and PW. EFT thickness of Group 1 and 2 were 10.6 ± 1.1 and 6.2 ± 1.0 mm, respectively (p < 0.001).
The ECG parameters of the groups are shown in Table 2. Heart rate was similar between the two groups. The QTmax (p = 0.06), cQTmax (p = 0.01), QTmin (p = 0.03), cQTmin (p = 0.003), QTd (p < 0.001) and cQTd (p = 0.002) were significantly increased in Group 1 in comparison to Group 2. The Tp-e interval (p < 0.001), cTp-e interval (p < 0.001), Tp-e/QT (p < 0.001) and Tp-e/QTc ratios (p < 0.001) were also increased in Group 1 when compared to Group 2.
Figure 1 – Measurement of epicardial fat thickness by two-dimensional transthoracic echocardiography. RV: Right ventricle; LV: Left ventricle; Ao: Aorta; LA: Left atrium.
Table 1 – Baseline characteristics, laboratory and echocardiographic parameters of the study population
Variable EFT thickness ≥ 9 mm (n = 50) EFT thickness < 9 mm (n = 40) p value
Age, years 61.6 ± 8.6 62.2 ± 6.4 0.71 Gender, female/male 21/29 19/21 0.60 BMI, kg/m2 28.5 ± 2.7 28.1 ± 3 0.51 Dyslipidemia, n (%) 26(52) 21(52) 1.0 Hypertension, n (%) 35(70) 28(70) 1.0 Smokers, n (%) 15(30) 12(30) 1.0 Glucose, mg/dL 88.2 ± 6.4 87.6 ± 6.6 0.64 TC, mg/dL 214.5 ± 17 213 ± 20.3 0.60 Triglyceride, mg/dL 160.2 ± 18.7 162 ± 17.1 0.52 LDL-C, mg/dL 136.2 ± 9.3 135 ± 9.2 0.66 HDL-C, mg/dL 38.5 ± 2.4 38.8 ± 2.4 0.70 Statins, n (%) 13(26) 9(22) 0.70 ACEI/ARB, n (%) 23(65) 14(50) 0.20 CCB, n (%) 13(37) 15(53) 0.19 LVEDD, mm 46.4 ± 1.9 46.8 ± 2.1 0.41 LVESD, mm 29.4 ± 1.8 29.5 ± 1.9 0.75 LA, mm 35.2 ± 2.2 34.8 ± 2.2 0.72 IVS, mm 9.8 ± 0.9 10.0 ± 0.9 0.46 PW, mm 8.8 ± 0.6 8.9 ± 0.6 0,75 LVEF, % 56.1 ± 1.4 55.7 ± 1.2 0.20 EFT thickness, mm 10.6 ± 1.1 6.2 ± 1.0 < 0.001
ACEI: Angiotensin-converting enzyme inhibitor; ARB: Angiotensin receptor blocker; BMI: Body mass index; CCB: Calcium channel blocker; EFT: Epicardial fat tissue; HDL-C: High-density lipoprotein cholesterol; IVS: Interventricular septum; LA: Left atrium; LDL-C: Low-density lipoprotein cholesterol; LVEDD: Left ventricular end-diastolic diameter; LVEF: Left ventricular ejection fraction; LVESD: Left ventricular end-systolic diameter; PW: Posterior wall; TC: Total cholesterol.
Table 2 – Electrocardiographic parameters of the study population
Variable EFT thickness ≥ 9 mm EFT thickness < 9 mm p value
HR, (beat/min) 78.2 ± 12.7 78.7 ± 11.5 0.86 QTmax, (ms) 357 ± 36 370 ± 26 0.06 cQTmax, (ms) 404 ± 26 417 ± 26.2 0.01 QTmin, (ms) 316 ± 35 331 ± 27 0.03 cQTmin, (ms) 357 ± 25 374 ± 25 0.003 QTd, (ms) 41.1 ± 2.5 38.6 ± 3.2 < 0.001 cQTd, (ms) 46.7 ± 4.7 43.7 ± 4.0 0.002 Tp-e, (ms) 83.1 ± 4.3 76.0 ± 4.9 < 0.001 cTp-e, (ms) 95.1 ± 12.0 86.5 ± 8.0 < 0.001 Tp-e/QT 0.23 ± 0.02 0.20 ± 0.02 < 0.001 Tp-e/QTc 0.20 ± 0.01 0.18 ± 0.01 < 0.001
HR: Heart rate; QTmax: QTmaximum; cQTmax: Corrected QT maximum; QTmin: QT minimum; cQTmin: Corrected QT minimum; QTd: QT dispersion; cQTd: Corrected QT dispersion; Tp-e: Transmural dispersion of repolarization; cTp-e: Corrected transmural dispersion of repolarization; EFT: Epicardial fat tissue.
Table 3 – Correlations between EFT and electrocardiographic parameters
Variable EFT thickness
R p
Tp-e interval 0.548 < 0.001
cTp-e interval 0.259 0.014
Tp-e/QT 0.662 < 0.001
Tp-e/QTc 0.560 < 0.001
QTc: Corrected QT; EFT: Epicardial fat tissue; Tp-e: Transmural dispersion of repolarization; cTp-e: Corrected transmural dispersion of repolarization.
Table 4 – Reproducibility data for the measurements of echocardiographic and electrocardiographic parameters
Intraobserver (%) Interobserver (%)
EFT thickness 6.7 8.5
QTmax 2.8 3.2
QTmin 2.8 3.1
Tp-e interval 2.8 3.1
EFT: Epicardial fat tissue. QTmax: QTmaximum; QTmin: QT minimum; Tp-e: Transmural dispersion of repolarization.
Significant positive correlations were found between EFT thickness and Tp-e interval (r = 0.548, p < 0.001), cTp-e interval (r = 0.259, p = 0.014), and Tp-e/QT (r = 0.662, p < 0.001) and Tp-e/QTc ratios (r = 0.560, p < 0.001) (Table 3). Reproducibility data for the measurements of EFT thickness, QTmax, QTmin and Tp-e interval in 20 reexamined participants are shown in Table 4.
Discussion
We found that the Tp-e and cTp-e intervals, the Tp-e/QT and Tp-e/QTc ratios, were higher in patient with increased EFT thickness compared with controls. These ECG parameters of ventricular repolarization were also significantly correlated with the EFT thickness. Our finding of increased Tp-e, cTp-e, Tp-e/QT ratio, and Tp-e/QTc ratio in patients with increased EFT is important, as this is the first study evaluating the association between EFT thickness and parameters of ventricular repolarization. Our results may contribute to the knowledge of the pathophysiological mechanisms of increased prevalence of ventricular arrhythmias in patients with higher EFT thickness.
Different echocardiographic studies have adopted different cut-off values for increased EFT. Iacobellis et al showed that EFT values were increased when > 9.5 mm in men and 7.5 mm in women with metabolic syndrome13. In addition, the authors adopted EFT values as elevated when > 9.5 mm in men and above 9.5 mm in women with insulin resistance. Natale et al14 accepted cut-off values for increased EFT as those higher than 7 mm in men and higher than 7 mm in women with subclinical atherosclerosis. Eroglu et al15 adopted different cut-off values for increased EFT, as > 5.2 mm in men and > 5.2 mm in women with coronary artery disease. Pierdomenico et al16 disclosed that EFT values were 2.5-7.1 mm in the normal population in a meta-analysis. All study populations have European ethnicity. We established a cutoff value of 9 mm for increased EFT.
EFT has a smaller adipocyte size but higher rates of fatty acid uptake and secretion than other visceral fat depots21,22. However, epicardial fat has some vital benefits, such as serving as a buffer, absorbing fatty acids, and protecting the heart against high fatty acid levels. In addition, it is used as a local energy source at times of high demand by channeling fatty
acids to the myocardium22. In fact, the body of evidence shows that epicardial fat is an extremely active organ that secretes several activated pro-inflammatory cytokines, such as tumor necrosis factor-α, transforming growth factor-β (TGF-β), and interleukin-6 (IL-6)4,22. Furthermore, because of its proximity to the heart and its shared blood supply with the coronary arteries, EFT may induce electrical and structural remodeling of the heart, leading to ventricular arrhythmias. In previous studies, it was shown that epicardial fat was associated to heart failure, coronary heart disease, metabolic syndrome, HT and AF10-12,23-26.
A recent study demonstrated that pericardial fat volume was highly associated with paroxysmal and persistent AF regardless of traditional risk factors, including LA enlargement27. Furthermore, the Framingham heart study revealed that pericardial fat, but not other fat deposits, was associated with prevalent AF28. According to these previous studies we thought that there was an association between EFT and dysrhythmia and then we hypothesized that local interactions between EFT and the adjacent myocardium might cause structural remodeling and, consequently, contribute to the genesis of ventricular arrhythmias. These results suggest that the increase in regional epicardial fat might play an important role in structural remodeling. Although the mechanism underlying the association between increased EFT thickness and ventricular arrhythmias is uncertain, the present data may imply that EFT may contribute to the progression of ventricular remodeling.
After several studies showed an association between prolonged Tp-e interval and ventricular arrhythmogenesis and sudden cardiac death, this parameter has gained great popularity3,20. In addition, the Tp-e/QT ratio is considered to be a more sensitive index of arrhythmogenesis compared with the sole use of either the Tp-e or QT intervals, as it is not affected by variations in body weight and heart rate2. Furthermore, electrophysiological studies showed that a prolonged Tp-e interval was correlated with ventricular tachycardia (VT) induction and the spontaneous occurrence of VT29,30. Moreover, a higher Tp-e/QT ratio has been associated with arrhythmic events in many clinical conditions, such as Brugada syndrome, long-QT syndromes, hypertrophic cardiomyopathy, and undergoing primary percutaneous coronary intervention for myocardial infarction2.
Study limitations
We recognize that our study has limitations that warrant consideration. First, the observational and cross-sectional design does not allow us to infer causation between EFT thickness and ECG parameters. Second, the sample size of the study was relatively small and follow-up was not long enough to detect any ventricular arrhythmias in patients with higher EFT thickness. Thirdly, the cut-off values of EFT thickness between study groups are taken arbitrarily, which may affect statistical results. Nevertheless, our cut-off value of 9 mm was higher than that seen in previous studies assessing EFT in various disease groups16,23-26. Lastly, this study may provide knowledge that can be used in large prospective studies.
Conclusion
The present study showed that the Tp-e interval, and Tp-e/QT, and Tp-e/QTc ratios were elevated in patients with higher EFT thicknesses, which might imply an indicator of risk of ventricular arrhythmias in this group of patients.
Institution name and approval number: istanbul bilim university-2014/176.*
Author contributions
Conception and design of the research: Kaplan O, Gozubuyuk G; Acquisition of data and Obtaining financing: Kaplan O, Yasar E, Gozubuyuk G, Dogan C, Boz AU, Hidayet S; Analysis and interpretation of the data, Statistical analysis and Critical revision of the manuscript for intellectual content: Kaplan O, Kurtoglu E, Nar G, Pekdemir H; Writing of the manuscript: Kaplan O.
Potential Conflict of Interest
No potential conflict of interest relevant to this article was reported.
Sources of Funding
There were no external funding sources for this study.
Study Association
This study is not associated with any thesis or dissertation work.
1. Kors JA, Ritsema van Eck HJ, van Herpen G. The meaning of the Tp-Te interval and its diagnostic value. J Electrocardiol. 2008;41(6):575-80.
2. Gupta P, Patel C, Patel H, Narayanaswamy S, Malhotra B, Green JT, et al. Tp-e/QT ratio as an index of arrhythmogenesis. J Electrocardiol. 2008;41(6):567-74.
3. Zhao X, Xie Z, Chu Y, Yang L, Xu W, Yang X, et al. Association between Tp-e/QT ratio and prognosis in patients undergoing primary percutaneous coronary intervention for ST-segment elevation myocardial infarction. Clin Cardiol. 2012;35(9):559-64.
4. Mazurek T, Zhang L, Zalewski A, Mannion JD, Diehl JT, Arafat H, et al. Human epicardial adipose tissue is a source of inflammatory mediators. Circulation. 2003;108(20):2460-6.
5. Baker AR, Silva NF, Quinn DW, Harte AL, Pagano D, Bonser RS, et al. Human epicardial adipose tissue expresses a pathogenic profile of adipocytokines in patients with cardiovascular disease. Cardiovasc Diabetol. 2006;5:1. 6. Iacobellis G, Ribaudo MC, Assael F, Vecci E, Tiberti C, Zappaterreno A, et al.
Echocardiographic epicardial adipose tissue is related to anthropometric and clinical parameters of metabolic syndrome: a new indicator of cardiovascular risk. J Clin Endocrinol Metab. 2003;88(11):5163-8.
7. Iacobellis G, Ribaudo MC, Zappaterreno A, Iannucci CV, Leonetti F. Relation between epicardial adipose tissue and left ventricular mass. Am J Cardiol. 2004;94(8):1084-7.
8. Sacks HS, Fain JN. Human epicardial adipose tissue: a review. Am Heart J. 2007;153(6):907-17.
9. Iacobellis G, Corradi D, Sharma AM. Epicardial adipose tissue: anatomic, biomolecular and clinical relationships with the heart. Nat Clin Pract Cardiovasc Med. 2005;2(10):536-43.
10. Nagashima K, Okumura Y, Watanabe I, Nakai T, Ohkubo K, Kofune T, et al. Association between epicardial adipose tissue volumes on 3-dimensional reconstructed CT images and recurrence of atrial fibrillation after catheter ablation. Circ J. 2011;75(11):2559-65.
11. Mazurek T, Kiliszek M, Kobylecka M, Skubisz-Głuchowska J, Kochman J, Filipiak K, et al. Relation of proinflammatory activity of epicardial adipose tissue to the occurrence of atrial fibrillation. Am J Cardiol. 2014;113(9):1505-8.
12. Shin SY, Yong HS, Lim HE, Na JO, Choi CU, Choi JI, et al. Total and interatrial epicardial adipose tissues are independently associated with left atrial remodeling in patients with atrial fibrillation. J Cardiovasc Electrophysiol. 2011;22(6):647-55.
13. Iacobellis G, Willens HJ, Barbaro G, Sharma AM. Threshold values of high risk echocardiographic epicardial fat thickness. Obesity (Silver Spring). 2008;16(4):887-92.
14. Natale F, Tedesco MA, Mocerino R, de Simone V, Di Marco GM, Aronne L, et al. Visceral adiposity and arterial stiffness: echocardiographic epicardial fat thickness reflects, better than waist circumference, carotid arterial stiffness in a large population of hypertensives. Eur J Echocardiogr. 2009;10(4):549-55. 15. Eroglu S, Sade LE, Yildirir A, Bal U, Ozbicer S, Ozgul AS, et al. Epicardial adipose tissue thickness by echocardiography is a marker for the presence and severity of coronary artery disease. Nutr Metab Cardiovasc Dis. 2009;19(3):211-7. 16. Pierdomenico SD, Pierdomenico AM, Cuccurullo F, Iacobellis G.
Meta-analysis of the relation of echocardiographic epicardial adipose tissue thickness and the metabolic syndrome. Am J Cardiol. 2013;111(1):73-8. 17. Quiñones MA, Otto CM, Stoddard M, Waggoner A, Zoghbi WA; Doppler
Quantification Task Force of the Nomenclature and Standards Committee of the American Society of Echocardiography. Recommendations for quantification of Doppler echocardiography: a report from the Doppler Quantification Task Force of the Nomenclature and Standards Committee of the American Society of Echocardiography. J Am Soc Echocardiogr. 2002;15(2):167-84.
18. Antzelevitch C, Sicouri S, Di Diego JM, Burashnikov A, Viskin S, Shimizu W, et al. Does T peak-Tend provide an index of transmural dispersion of repolarization? Heart Rhythm. 2007;4(8):1114-6.
19. Day CP, McComb JM, Campbell RW. QT dispersion: an indication of arrhythmia risk in patients with long QT intervals. Br Heart J. 1990;63(6):342-4.
20. Castro Hevia J, Antzelevitch C, Tornes Barzaga F, Dorantes Sánchez M, Dorticós Balea F, Zayas Molina R, et al. T peak-Tend and T peak-Tend dispersion as risk factors for ventricular tachycardia/ventricular fibrillation in patients with the Brugada syndrome. J Am Coll Cardiol. 2006;47(9):1828-34.
21. Marchington JM, Pond CM. Site specific properties of pericardial and epicardial adipose tissue: the effects of insulin and high-fat feeding on lipogenesis and the incorporation of fatty acids in vivo. Int J Obes. 1990;14(12):1013-22. 22. Iacobellis G, Barbaro G. The double role of epicardial adipose tissue as pro-
and anti-inflammatory organ. Horm Metab Res. 2008;40(7):442-5. 23. Sengul C, Duman D. The association of epicardial fat thickness with blunted
heart rate recovery in patient with metabolic syndrome. Tohoku J Exp Med. 2011;224(4):257-62.
24. Mustelier JV, Rego JO, González AG, Sarmiento JC, Riverón BV. Echocardiographic parameters of epicardial fat deposition and its relation to coronary artery disease. Arq Bras Cardiol. 2011;97(2):122-9. 25. Khawaja T, Greer C, Chokshi A, Chavarria N, Thadani S, Jones M, et al.
Epicardial fat volume in patients with left ventricular systolic dysfunction. Am J Cardiol. 2011;108(3):397-401.
26. Eroğlu S, Sade LE, Yıldırır A, Demir O, Müderrisoğlu H. Association of epicardial adipose tissue thickness by echocardiography and hypertension. Turk Kardiyol Dern Ars. 2013;41(2):115-22.
27. Al Chekakie MO, Welles CC, Metoyer R, Ibrahim A, Shapira AR, Cytron J, et al. Pericardial fat is independently associated with human atrial fibrillation. J Am Coll Cardiol. 2010;56(19):784-8.
28. Thanassoulis G, Massaro JM, O’Donnell CJ, Hoffmann U, Levy D, Ellinor PT, et al. Pericardial fat is associated with prevalent atrial fibrillation: the Framingham Heart Study. Circ Arrhythm Electrophysiol. 2010;3(4):345-50. 29. Smetana P, Schmidt A, Zabel M, Hnatkova K, Franz M, Huber K, et al. Assessment of repolarization heterogeneity for prediction of mortality in cardiovascular disease: peak to the end of the T wave interval and nondipolar repolarization components. J Electrocardiol. 2011;44(3):301-8.
30. Erikssen G, Liestøl K, Gullestad L, Haugaa KH, Bendz B, Amlie JP. The terminal part of the QT interval (T peak to T end): a predictor of mortality after acute myocardial infarction. Ann Noninvasive Electrocardiol. 2012;17(2):85-94.