Differences in performance, carcass characteristics and meat
quality between fast- and slow-growing broiler genotypes
Sibel Canoğulları Doğan
1, Mikail Baylan
2, Ayşen Bulancak
3, Tugay Ayaşan
41Nigde Ömer Halisdemir University, Faculty of Agricultural Sciences and Technologies, Department of Animal Production and
Technologies, 51240, Niğde/Turkey - E-mail: [email protected]; 2Çukurova University, Agriculture Faculty,
Depart-ment of Animal Science, 01330, Adana/Turkey; 3Cyprus International University, Faculty of Agricultural Sciences and
Tech-nologies, Department of Plant Production, Nicosia/North Cyprus; 4Osmaniye Korkut Ata University Applied Science School
of Kadirli, Deparment of Organic Farming Business Management. Kadirli/Osmaniye
Summary. This study was conducted to determine the differences in performance, carcass characteristics
and meat quality between fast- and slow-growing broilers. Ross-308 genotype was used as the fast-growing genotype, while local T2-Y2 genotype was used as the slow-growing genotype. The study continued until both genotypes reached acceptable market weight (2 kg). Both genotypes consisted of 4 subgroups, each con-taining 50 broiler chicks. Fast-growing broilers reached market weight (2 kg) on day 38, while slow-growing broilers reached the same weight on day 72. Fast-growing broilers consumed less feed to attain 2 kg live weight compared with slow-growing broilers. The feed conversion ratio of the fast-growing broilers was 1.63, while that of the slow-growing broilers was 2.67. Significant differences were observed between the genotypes with regard to the percentage weights of the gizzard, liver, leg and breast. The percentage weights of the leg and abdominal fat were higher in slow-growing broilers, while the percentage weight of the breast was higher in fast-growing broilers. No difference was observed between the genotypes with regard to cooking loss in leg and breast meats, whereas differences were recorded with regard to the water holding capacity (%) in leg meat. The slow-growing genotype had lower pH values in breast and leg meats. The values of leg meat brightness (L*), redness (a*) and yellowness (b*) were higher in the slow-growing broilers, but the differences were not statistically significant. The L* and a* values of breast meat were found to be higher in slow-growing broil-ers. These results showed that in the slow-growing genotype, breast and leg meat color L, a and b value are enhanced. However, the fast-growing genotype has better performance and carcass characteristics compared to the slow-growing genotype.
Key words: growing performance, feed conversion rate, water holding capacity, meat brightness
Introduction
Poultry production is one of the fastest growing sectors in animal production business at present. The fast growth of this sector has led to an increase in the production of poultry meat. The growth was brought about by the improvement efforts aimed at increasing productivity in broilers. With the application of genetic selection in broilers, a steady increase was achieved in
growth performance, time taken to reach market weight, edible muscle and breast meat. However, such improve-ments achieved through genetic selection caused some unwanted changes with regard to animal health, welfare and, to some extent, muscle quality (1) and sensory and functional quality of the meat negatively (2).
As a result of fast growth and increased stress, problems like skeletal system and circulatory system disorders, over fattening, and increasing sensitivity to
environmental conditions and diseases, leading to low-er survival ability, have appeared in broillow-ers (3). This situation has a serious public reaction in western coun-tries with high sensitivity to animal welfare. Both the economic losses associated with the mentioned prob-lems (4) and the concerns and sensitivity of consumers towards animal welfare and safe food production led to the development of suitable genotypes (5).
Fast-growing chickens have a fast-growing rate, high feed efficiency, and high meat yield. Although the growth performance of slow-growing genotype is less efficient than that of fast-growing genotype, slow-growing genotype are more adapted to natural systems, and the quality of their meat is more appropriate for a specialty or gourmet market (6). Slow-growing geno-types reach slaughter weight later, and their feed con-version ratio, carcass yield and breast weight percentage are lower compared with fast-growing genotypes (7,8). However, in recent years, slow-growing genotypes have become the preferred choice for consumers because of their product quality and animal welfare (9,10).
Previous studies on T2-Y2 (slow-growing) chickens have mainly focused on the protection, feed-ing management of this breed. However, so far, little information is known about the meat characteristics. This study was conducted to determine the differences in performance, carcass characteristics and meat qual-ity of slow-growing genotypes at same conditions that have been provided for fast-growing broilers. For this purpose they were slaughtered at same live weight and compared in terms of meat quality and carcass charac-teristics.
Material and Method
The experiment was performed at the Research and Application Farm Poultry Unit R&D group, Faculty of Agriculture, Çukurova University. Four hundred fast- and slow-growing broiler chicks were used in the experi-ment. The slow-growing genotype comprised of chicks hatched from eggs gathered from the broiler parent line produced at the Research and Application Farm Poultry Unit (T2-Y2). Ross-308 broiler chicks were used as the fast-growing broiler genotype. Each genotype consisted of 4 subgroups comprising 50 chicks each (25 males and
25 females), and each subgroup was randomly allocated
to a 4 m2 compartment enclosed by wire in a windowed
housed. Round feeders, round drinkers and thick wood shavings, as litter material, were placed in each compart-ment. Throughout the first week, electrical heaters were used to provide 33˚C temperature, as required by chicks; thereafter, the temperature was reduced by 3˚C every week until 24˚C was reached, where it was kept stable. Throughout the experiment, feed and water were pro-vided ad-libitum, and a constant photoperiod of 24 h was provided.
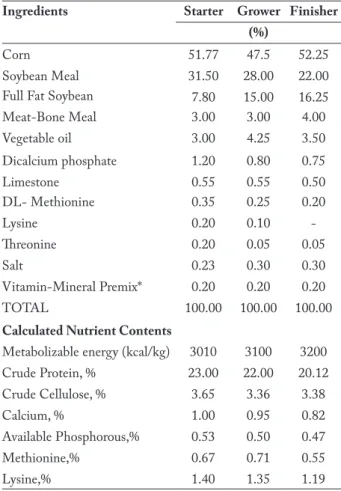
The nutrient contents of the diets used during the experiment (purchased from a commercial mill) are given in Table 1. All broiler chicks were provided with the same diets, which included starter diet, grower diet
Table 1. Ingredients and chemical composition of diets
Ingredients Starter Grower Finisher
(%)
Corn 51.77 47.5 52.25
Soybean Meal 31.50 28.00 22.00
Full Fat Soybean 7.80 15.00 16.25
Meat-Bone Meal 3.00 3.00 4.00 Vegetable oil 3.00 4.25 3.50 Dicalcium phosphate 1.20 0.80 0.75 Limestone 0.55 0.55 0.50 DL- Methionine 0.35 0.25 0.20 Lysine 0.20 0.10 -Threonine 0.20 0.05 0.05 Salt 0.23 0.30 0.30 Vitamin-Mineral Premix* 0.20 0.20 0.20 TOTAL 100.00 100.00 100.00
Calculated Nutrient Contents
Metabolizable energy (kcal/kg) 3010 3100 3200 Crude Protein, % 23.00 22.00 20.12 Crude Cellulose, % 3.65 3.36 3.38 Calcium, % 1.00 0.95 0.82 Available Phosphorous,% 0.53 0.50 0.47 Methionine,% 0.67 0.71 0.55 Lysine,% 1.40 1.35 1.19
*Per kg vitamin- mineral premix includes 15.000 IU Vitamin A, 5000 IU vitamin D3, 50 mg vitamin E, 10 mg vitamin K3, 4 mg
vitamin B1, 8 mg vitamin B2, 5 mg vitamin B6, 5mgvitamin B12,
50 mg niacin, 50 mg pantothenic acid, 20 mg folic acid, 0,25 mg biotin, 175 mg choline chloride, 100 mg manganese, 100 mg iron, 150 mg zinc, 20 mg copper, 1,5 mg cobalt, 0,20 mg selenium.
and finisher diet. Starter, grower and finisher diet was provided to slow growing genotype for 4, 4 and 2 wk, to fast growing genotype for 2, 2 and 1.5 wk respectively. All diets contained adequate nutrient levels as defined by the NRC (11).
During the experiment, feed was weighed daily, us-ing a scale with a sensitivity of ± 5 g, before beus-ing given to the animals. Also, every week, the leftover in the feed trough was weighed to calculate the feed consumption per week. Further, chicks were weighed individually every week, using a scale with a sensitivity of ±0.5 g, to deter-mine their live weights. Weekly feed consumption and live weight gain were used to determine weekly feed con-version ratio.
When the slow- and fast-growing genotypes reached 2 kg live weight, 10 males and 10 females from each group were slaughtered to determine carcass char-acteristics. The fast-growing broilers reached 2 kg mar-ket weight on day 38, while the slow-growing local stock (T2-Y2 parent line) reached the same weight on day 72.
Before slaughter, the broilers were subjected to a to-tal feed withdrawal of 8 h. Live weights before slaughter were measured after bird selection for slaughter. After-wards, the 12 selected broilers from each group (6 males and 6 females) were slaughtered, plucked using a pluck-ing machine and their internal organs were removed, after which their warm carcass weights were measured. Car-casses were kept in the refrigerator at + 4 ˚C for one day and weighed again to determine the cold carcass weight. Abdominal fat was removed by hand and weighed and the weight of surrounding the gizzard was added to ab-dominal fat. The abab-dominal fat was compared with the carcass weight to determine the percentage. The carcass yield was determined by comparing the carcass weight to the live weight. The carcasses were cut into parts accord-ing to the recommendation of the Turkish Standards In-stitute (TS 5890). The leg, breast, back, and wing weights were measured, and these weights were compared with the carcass weight to calculate their percentages.
The left leg and breast were removed from each car-cass to determine the meat quality characteristics. Meat samples were taken from different parts of the leg and breast and were homogenized by using a blender. pH values, color (Lab) values, cooking loss and water hold-ing capacity were measured in the homogenized leg and breast meat samples.
To determine the pH values of the leg and breast meats, 10 g of meat was taken from the homogenized samples; 100 ml of pure water was added; the resulting mixture was homogenized for 1 min in a homogenizer, and the pH values were measured using a pH meter (12).
To determine the breast meat, leg meat and skin col-or density, L*a*b* (L: brightness, a: redness and b: yellow-ness) values were determined using a colorimeter (Konica Minolta Colorimeter CR-300) (13).
To determine the water holding capacity, 1 g of sample was placed on a filter paper and centrifuged at 1500 rpm for 4 min. After centrifugation, the filter paper + sample were dried at 70°C overnight.
Water holding capacity (WHC) was calculated us-ing the followus-ing formula:
• WHC= (M1-M2)/m x 100 • M1: filter paper + sample weight; • M2: filter paper + post-drying weight; • m: initial sample weight (14).
Cooking loss was determined on homogenized breast and thigh meat sample of about 20 g of sample was weighed and placed in a polyethylene bag. The meat was kept in an 80˚C water bath until the internal temperature reached 72˚C. The cooked meat was removed from the water bath, cooled, and weighed. The cooking loss was estimated as the percentage of the weight of the cooked samples (cooled and dried on the surface with a paper towel) with respect to the weight of the raw samples. (15).
The analysis of the data collected from the study was analyzed using the SPSS 18.0 (Statistical Package for Social Sciences) software. The data was analyzed by the two-sample t test to determine the significance of the dif-ference between two mean values. The significance level at which differences were considered was P< 0.05. Mean ± standard error was written in tables.
Results and Discussion
The fast-growing broilers (Ross-308) reached mar-ket weight (2 kg live weight) on day 38, while the slow-growing (T2-Y2) broilers reached the same weight on day 72. As shown in Table 2, the fast-growing broilers consumed 3355.83 g of feed to attain 2 kg live weight, while the slow-growing broilers consumed 5140.72 g of feed to attain the same weight (P<0.05). The feed
conver-sion ratio of the fast-growing broilers was 1.63 , while that of the slow-growing broilers was 2.67 (P<0.05). In many studies performed with fast- and slow-growing genotypes, it was determined that feed conversion ratio was better in fast-growing genotype (7, 8,10,16). Mikul-ski et al. (17) stated that based on live weights on day 65, the slow-growing genotype had 17% lower live weight compared with the fast-growing genotype, and that the feed conversion rate was similar. Sarica et al. (7), in their study on and fast-growing genotypes, fed slow-growing broilers until day 49 and fast-slow-growing broilers until day 42 and 49, and determined that the live weights of the slow-growing broilers were lower than those of the fast-growing broilers (P<0.05). The feed consump-tion of the slow-growing broilers was similar to that of the fast-growing broilers slaughtered on day 42, and the feed conversion ratio was better in fast-growing broilers compared with slow-growing broilers (P<0.05). On the other hand, Fanatico et al. (8) reported that slow-growing broilers consume less feed compared with fast growing broilers, and that the feed conversion ratio was better in fast growing broilers.
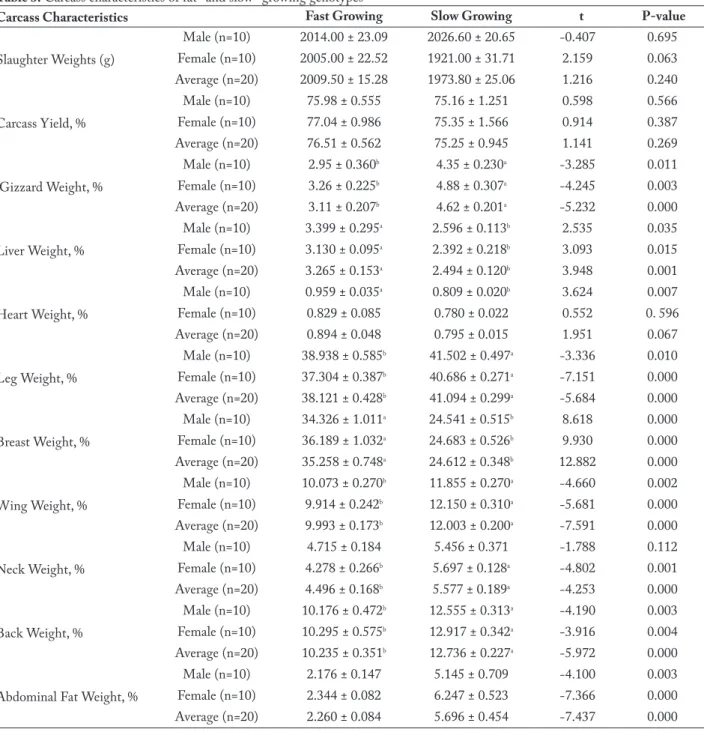
To determine the carcass characteristics, the ratio of the weight of carcass parts and internal organs to the weight of the whole carcass was taken into consider-ation (Table 3). No difference was observed between the genotypes with regard to carcass yield (P>0.05). The leg, wing, back, neck, gizzard and abdominal fat weight ratios were higher in slow-growing broilers compared with fast-growing broilers (P<0.05).
In this study, there were significant differences among the carcass characteristics of fast- and slow-grow-ing genotypes except heart weight, breast weight and car-cass yield (Table 3). The carcar-cass yield was not significant
among the groups. However the fast growing broiler had better carcass yield than slow-growing broilers. Similar results were reported by Sarica et al. (7,18), Fantico et al. (8,10) and Mikulski et al. (17). The leg, wing, back, neck, gizzard and abdominal fat weight ratios were high-er in slow-growing broilhigh-ers compared with fast-growing broilers (P<0.05). Similar results were reported by Sarica et al. (7,19) and Fanatico et al. (8). The high leg weight percentage in the slow-growing genotype in this study is similar to the high leg weight percentage in slow-growing genotypes found in different studies (8-10,18,20). Previ-ous studies established that as a result of fast growth, car-cass performance and breast weight percentage increased, while abdominal fat levels decreased in fast-growing gen-otypes (17,18,21,22). In fast-growing gengen-otypes, large breast weight percentage and low abdominal fat weight percentage are results of long term selection (7-9, 23). Coneglian et al. (16), Sarica et al. (18), and Fanatico et al. (8,10,24) stated that slow-growing broilers had lower breast weight percentage and higher leg, back and wing weight percentages compared with fast-growing broil-ers. Mikulski et al. (17) stated that breast and leg weight percentages are higher in fast-growing broilers, while ab-dominal fat weight percentage is higher in slow-growing broilers.
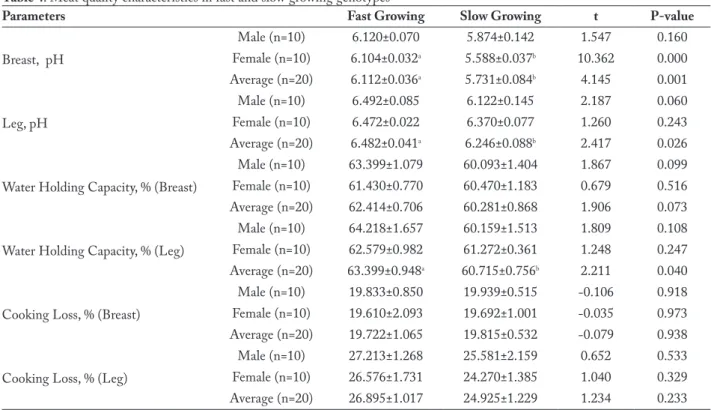
With regard to the pH level in the breast and leg meats, slow-growing genotype had lower pH values (P<0.05) (Table 4). The values of leg and breast meat cooking loss percentage and water holding capacity (%) were found to be similar between the genotypes (P>0.05). However, the only difference was found in average leg meat water holding capacity (P<0.05) (Table 4). In con-trast to the findings of this study, Mikulski et al. (17) stat-ed that there was no difference between the genotypes with regard to breast meat pH values, but leg meat pH values in slow-growing broilers kept indoors were lower than those of fast-growing broilers; the difference was statistically significant. Sarica et al. (19) stated that leg and breast meat pH were lower in fast-growing broilers, while Fanatico et al. (25) and Quentin et al. (21) found that breast meat pH was higher in fast-growing broilers compared to slow-growing broilers, similar to this study. The values of leg and breast meat cooking loss percentage and water holding capacity of breast meat were similar between the genotypes (P>0.05). Lonergan et al. (26) stated that cooking loss in slow-growing broilers was
Table 2. Feed consumption and feed conversion ratio in fast- and slow- growing genotypes
Genotypes Total Feed
Consumption (g) Feed Conversion Ratio(feed g:gain g) Fast Growing 3355.83± 47.284b 1.63 ± 0.006b
Slow Growing 5140.72±100.675a 2.67 ±0.044a
t -14.693 -20.428
P-value 0.000 0.000
a,b Means within a column with no common superscript differ
significantly (P < 0.05).
t = Independent Samples “t” test, p-value = significance level (α= 0.05)
higher compared with fast-growing broilers. Fanatico et al. (27) reported that due to the thickness of the large breast muscles, the water loss in them is lower compared with thin breast muscles. Sante et al. (28) reported that at high pH values, the water holding characteristic of myosin would be higher. In this study, leg and breast pH
values were high in fast-growing broilers, and their water holding capacity was higher than slow-growing broilers. Mikulski et al. (17) stated that breast meat water hold-ing capacity was lower in slow-growhold-ing broilers, while leg meat water holding capacity was higher, in contrast to this study. However, the differences between the
geno-Table 3. Carcass characteristics of fat- and slow- growing genotypes
Carcass Characteristics Fast Growing Slow Growing t P-value
Slaughter Weights (g) Male (n=10) 2014.00 ± 23.09 2026.60 ± 20.65 -0.407 0.695 Female (n=10) 2005.00 ± 22.52 1921.00 ± 31.71 2.159 0.063 Average (n=20) 2009.50 ± 15.28 1973.80 ± 25.06 1.216 0.240 Carcass Yield, % Male (n=10) 75.98 ± 0.555 75.16 ± 1.251 0.598 0.566 Female (n=10) 77.04 ± 0.986 75.35 ± 1.566 0.914 0.387 Average (n=20) 76.51 ± 0.562 75.25 ± 0.945 1.141 0.269 Gizzard Weight, % Male (n=10) 2.95 ± 0.360b 4.35 ± 0.230a -3.285 0.011 Female (n=10) 3.26 ± 0.225b 4.88 ± 0.307a -4.245 0.003 Average (n=20) 3.11 ± 0.207b 4.62 ± 0.201a -5.232 0.000 Liver Weight, % Male (n=10) 3.399 ± 0.295a 2.596 ± 0.113b 2.535 0.035 Female (n=10) 3.130 ± 0.095a 2.392 ± 0.218b 3.093 0.015 Average (n=20) 3.265 ± 0.153a 2.494 ± 0.120b 3.948 0.001 Heart Weight, % Male (n=10) 0.959 ± 0.035a 0.809 ± 0.020b 3.624 0.007 Female (n=10) 0.829 ± 0.085 0.780 ± 0.022 0.552 0. 596 Average (n=20) 0.894 ± 0.048 0.795 ± 0.015 1.951 0.067 Leg Weight, % Male (n=10) 38.938 ± 0.585b 41.502 ± 0.497a -3.336 0.010 Female (n=10) 37.304 ± 0.387b 40.686 ± 0.271a -7.151 0.000 Average (n=20) 38.121 ± 0.428b 41.094 ± 0.299a -5.684 0.000 Breast Weight, % Male (n=10) 34.326 ± 1.011a 24.541 ± 0.515b 8.618 0.000 Female (n=10) 36.189 ± 1.032a 24.683 ± 0.526b 9.930 0.000 Average (n=20) 35.258 ± 0.748a 24.612 ± 0.348b 12.882 0.000 Wing Weight, % Male (n=10) 10.073 ± 0.270b 11.855 ± 0.270a -4.660 0.002 Female (n=10) 9.914 ± 0.242b 12.150 ± 0.310a -5.681 0.000 Average (n=20) 9.993 ± 0.173b 12.003 ± 0.200a -7.591 0.000 Neck Weight, % Male (n=10) 4.715 ± 0.184 5.456 ± 0.371 -1.788 0.112 Female (n=10) 4.278 ± 0.266b 5.697 ± 0.128a -4.802 0.001 Average (n=20) 4.496 ± 0.168b 5.577 ± 0.189a -4.253 0.000 Back Weight, % Male (n=10) 10.176 ± 0.472b 12.555 ± 0.313a -4.190 0.003 Female (n=10) 10.295 ± 0.575b 12.917 ± 0.342a -3.916 0.004 Average (n=20) 10.235 ± 0.351b 12.736 ± 0.227a -5.972 0.000
Abdominal Fat Weight, %
Male (n=10) 2.176 ± 0.147 5.145 ± 0.709 -4.100 0.003 Female (n=10) 2.344 ± 0.082 6.247 ± 0.523 -7.366 0.000 Average (n=20) 2.260 ± 0.084 5.696 ± 0.454 -7.437 0.000
a,bMeans within a line with no common superscript differ significantly (P < 0.05).
types were not statistically significant. In the study by Fa-natico et al. (25), it was found that slow-growing broilers had lower water holding capacity, while Sarica et al. (19) found that the leg and breast meat water holding capaci-ties were lower in fast-growing broilers, in contrast to this study.
With regard to leg meat L*, a* and b* values, the slow-growing genotype had higher values, but no sig-nificant difference was found between the genotypes (P>0.05) (Table 5). Some differences were observed in leg skin with regard to a* value, with the fast-growing
geno-type demonstrating a redder skin color compared with the slow-growing genotype (P<0.05). Leg skin L* and b* values were found to be higher in the slow-growing genotype (P>0.05).
Consumers pay attention to color while buying broiler products. Particularly, in whole carcass purchases, skin color has a significant effect on consumer preference. Skin color in chicken depends on the genetic ability to produce melanin pigments in the dermis and epidermis and the absorption and storage of carotenoid pigments in the epidermis (29). A study by Fanatico et al. (25)
re-Table 4. Meat quality characteristics in fast and slow growing genotypes
Parameters Fast Growing Slow Growing t P-value
Breast, pH Male (n=10) 6.120±0.070 5.874±0.142 1.547 0.160 Female (n=10) 6.104±0.032a 5.588±0.037b 10.362 0.000 Average (n=20) 6.112±0.036a 5.731±0.084b 4.145 0.001 Leg, pH Male (n=10) 6.492±0.085 6.122±0.145 2.187 0.060 Female (n=10) 6.472±0.022 6.370±0.077 1.260 0.243 Average (n=20) 6.482±0.041a 6.246±0.088b 2.417 0.026
Water Holding Capacity, % (Breast)
Male (n=10) 63.399±1.079 60.093±1.404 1.867 0.099 Female (n=10) 61.430±0.770 60.470±1.183 0.679 0.516 Average (n=20) 62.414±0.706 60.281±0.868 1.906 0.073 Water Holding Capacity, % (Leg)
Male (n=10) 64.218±1.657 60.159±1.513 1.809 0.108 Female (n=10) 62.579±0.982 61.272±0.361 1.248 0.247 Average (n=20) 63.399±0.948a 60.715±0.756b 2.211 0.040
Cooking Loss, % (Breast)
Male (n=10) 19.833±0.850 19.939±0.515 -0.106 0.918 Female (n=10) 19.610±2.093 19.692±1.001 -0.035 0.973 Average (n=20) 19.722±1.065 19.815±0.532 -0.079 0.938 Cooking Loss, % (Leg)
Male (n=10) 27.213±1.268 25.581±2.159 0.652 0.533 Female (n=10) 26.576±1.731 24.270±1.385 1.040 0.329 Average (n=20) 26.895±1.017 24.925±1.229 1.234 0.233
a,bMeans within a line with no common superscript differ significantly (P < 0.05).
t = Independent Samples “t” test, P-value = significance level (α= 0.05)
Table 5. Leg meat and skin color in fast and slow growing (Lab values)
Leg meat Leg skin
L* a* b* L* a* b*
FG 62.344±0.892 5.448±0.310 17.663±1.756 70.388±0.851 4.742±0.658a 11.843±0.885
SG 64.386±0.775 5.730±0.335 19.280±0.516 72.178±0.643 2.819±0.472b 11.945±0.842
t -1.727 -0.617 -0.883 -1.676 2.373 -0.083
P-value 0.101 0.545 0.389 0.111 0.029 0.934
a,b Means within a column with no common superscript differ significantly (P < 0.05).
FG: Fast growing; SG: Slow growing; L: brightness; a: redness; b: yellowness t = Independent Samples “t” test, P-value = significance level (α= 0.05) * L: brightness, a: redness and b: yellowness
ported that L* and b* values in leg skin were higher in slow-growing broilers compared with fast-growing broil-ers, while a* value was higher in fast-growing broilers. Contrary to this study, Kucukyılmaz et al. (30) reported that leg meat redness values were higher in slow-growing broilers compared with fast-growing broilers. However, leg meat brightness and yellowness values were in accor-dance with this study. Mikulski et al. (17) stated that, similar to this study, leg meat L*, a* and b* values did not differ between slow- and fast-growing broilers.
In breast meat, L* and a* values were higher in slow-growing broilers. Breast skin L* value was lower in fast-growing broilers, and a* value was lower in slow-fast-growing broilers (P<0.05) (Table 6). Even though breast meat and skin b* values did not show any significant difference be-tween the genotypes, slow-growing broilers had yellower skin and meat color compared with fast-growing geno-type (P>0.05). Contrary to this study, Nielsen et al. (31) found that breast meat was redder in fast-growing broil-ers, while Quentin et al. (21) determined that the bright-ness value of breast meat was lower in slow-growing broilers. Mikulski et al. (17) stated that breast meat yel-lowness value was higher in slow-growing broilers com-pared with fast-growing broilers (P>0.05). These findings are in accordance with the findings of this study. Quentin et al. (21) stated that the yellowness value of breast meat was higher in fast-growing broilers, while the redness value was higher in slow-growing broilers. Many stud-ies stated that slow-growing broilers had lower redness in meat compared with fast-growing broilers (25,30).
Baeza et al. (32) as well as Gordon & Charles (33) stated that the heme pigment increased in poultry with age, while Gordon & Charles (32) reported that due to the older age and high myoglobin content of
slow-grow-ing broilers, they had a redder meat color compared with fast-growing broilers. Touraille et al. (34) stated that the myoglobin content of the breast muscle of broilers in-creased between weeks 9 and 12, and that the difference between the genotypes could be as a result of the slaugh-ter age. The findings of these researchers are in agreement with this study.
Conclusion
In conclusion, our results show that in slow-grow-ing broilers, breast and leg meat color are enhanced, but fast-growing broilers have better performance and carcass characteristics.Water holding capacity in breast and leg meat and cooking loss in leg meat was higher in fast growing broilers.
References
1. Hocking PM. The effect of genetic selection on meat quality in broiler. 3th International Poultry Meat Congress. 2015;
22-26 April 2015 Starlight Convention Center & Sunrise Park Resort Antalya/TURKEY..
2. Le Bihan-Duval E. Genetic variability of poultry meat. 52nd Annu. Natl. Breeders Roundtable, 2003; May 8–9, 2003, St. Louis, MO. US Poult. Egg Assoc., Tucker, GA. Pages 11–20. 3. Whitehead CC, Fleming RH, Julian RJ. Skeletal problems
associated with selection for increased production. 2003;. (Ed. W.M., Muir, S.E., Aggrey) Poultry Genetics, Breeding and Biotechnology, CABI Publishing, Cambridge, USA, 29-52. 4. Soboyejo ABO, Nestor KE. A new statistical biomechanics
approach to modeling bone strength in turkeys and broiler chickens. Trans Am Soc Agric Eng. 2000; 43:1997-2006. 5. Hall C, Sandilands V. Public attitudes to the welfare of broiler
chickens. Anim Welf 2007;16: 499-512. Table 6 Breast meat and skin color in fast and slow growing (Lab values)
Breast Meat Breast Skin
L* a* b* L* a* b*
FG 60.858±0.852b 5.352±0.338b 19.555±0.531 67.673±0.475b 5.138±0.638a 14.363±0.958
SG 65.062±0.416a 6.569±0.242a 20.529±0.347 71.896±0.591a 2.838±0.319b 14.819±0.982
t -4.431 -2.919 -1.533 -5.566 3.224 -0.332
P-value 0.000 0.009 0.143 0.000 0.005 0.744
a,b Means within a column with no common superscript differ significantly (P < 0.05).
FG: Fast growing; SG: Slow growing; L: brightness; a: redness; b: yellowness t = Independent Samples “t” test, P-value = significance level (α= 0.05) * L: brightness, a: redness and b: yellowness
6. Castellini C, Mugnai C, Dal Bosco A. Meat quality of three chicken genotypes reared according to the organic system. Meat Sci. 2002; 60:219–225.
7. Sarıca M, Ceyhan V, Yamak U, et al. Comparison of Slow Growing Synthetic Broiler Genotypes with Commercial Broilers in Terms of Growth, Carcass Traits and Some Eco-nomic Parameters. J Agricul Sci. 2016; 22:20-31
8. Fanatico AC, Pillai PB, Hester PY, et al. Performance, liv-ability, and carcass yield of slow- and Fast-Growing Chicken Genotypes Fed Low-Nutrient or Standard Diets and Raised indoors or with outdoor access. Poult Sci. 2008; 87:1012-1021. 9. Castellini C, Berri C, Le Bihan-Duval E, et al. Qualitative
attributes and consumer perception of organic and free-range poultry meat. Worlds Poultry Sci J. 2008; 64:500-512. 10. Fanatico AC, Pillai PB, Cavitt LC, et al. Evaluation of
slow-growing broiler genotypes grown with and without outdoor access: Growth performance and carcass yield. Poult Sci. 2005a; 84(8):1321-1327.
11. NRC. Nutrient Requirements of Poultry. 1994; 9th rev. ed. Natl. Acad. Press, Washington, DC.
12. AOAC. Official methods of analysis (15th ed.) Association of Official Analytical Chemistry. 1990; Inc., Arlington, Vir-ginia, USA.
13. Hunt MC, Acton JC, Benedict RC, et al. Guidelines for meat colour evaluation. 1991; Chicago: American Meat Sci. Assoc. and National Live Stock and Meat Board .
14. Castellini C, Dal Bosco A, Bernardini M, et al. Effect of di-etary vitamin E on the oxidative stability of raw and cooked meat. Meat Sci. 1998; 50(2):153-161.
15. Kondaiah N, Anjaneyulu ASR, Keseva Rao V, et al. Effect of salt and phosphate on the quality of buffalo and goat meats. Meat Sci. 1985; 15(3):183-192.
16. Coneglian JLB, Vieira SL, Berres J, et al. Responses of fast and slow growth broilers fed all vegetable diets with variable ideal protein profiles. R Bras Zootec. 2010; 39(2):327-334. 17. Mikulski D, Celej J, Jankowski J, et al. Growth performance,
carcass traits and meat quality of slower-growing and fast-growing chickens raised with and without outdoor access. Asian-Australas J Anim Sci. 2011; 24(10):1407-1416. 18. Sarica M. Yamak US, Boz MA, et al. The Comparison of
Growth, Slaughter and Carcass Traits of Meat Chicken Genotype Produced by Back-Crossing with A Commercial Broiler Genotype. Poult Research J. 2014a; 11(1):5-9. 19. Sarica M, Yamak US, Turhan S, et al. Comparing slow-growing
chickens produced by two- and three-way crossings with com-mercial genotypes. 2. Carcass quality and blood parameters. European Poult Sci 2014b; 78. DOI: 10.1399/eps.2014.XX 20. Yamak US, Sarica M, Boz MA. Comparing slow-growing
chickens produced by two- and threeway crossings with com-mercial genotypes. 1. Growth and Carcass Traits. European Poult. Sci. 2014; 78. DOI: 10.1399/eps.2014.XX
21. Quentin M, Bouvarel I, Berri C, Le Bihan-Duval E, et al. Growth, carcass composition and meat quality response to dietary concentrations in fast-, mediumand slow-growing commercial broilers. Anim Res. 2003; 52:65–77
22. Abdullah AY, Al-Beitawi NA, Rjoup MMS, et al. Growth performance, carcass and meat quality characteristics of dif-ferent commercial crosses of broiler strains of chicken. J Poult Sci. 2010; 47:13-21.
23. Phongpa-ngan P, Jung J, Antony NB, et al. Quality attributes in breast muscle from broilers of an Arkansas randombred line varying in growth rate. Poult Sci. 2014; 93:187-193. 24. Fanatico AC, Pillai PB, Cavitt LC, et al. Evaluation of
slow-er-growing broiler genotypes grown with and without out-door access: Sensory Attributes. Poult Sci. 2006; 85:337-343. 25. Fanatico AC, Pillai PB, Emmert JL, et al. Meat quality of
slow- and fast-growing chicken genotypes fed low- nutrient or standard diets and raised indoors or with outdoor access. Poult Sci. 2007; 86:2245-2255.
26. Lonergan SM, Deeb N, Fedlet CA, et al. Breast meat qual-ity and composition in unique chicken populations. Poult Sci 2003; 82:1990-1994.
27. Fanatico AC, Cavitt LC, Pillai PB, et al. Evaluation of slow-er-growing broiler genotypes grown with and without out-door access: Meat Quality. Poult Sci. 2005b; 84:1785-1790. 28. Sante´ V, Sosnicki AA, Greaser MI; et al. Impact of
tur-key breeding and production on breast meat quality. Pages 151–156 in: Proceedings of the XII European Symposium on the Quality of Poultry Meat 1995; Zaragoza, Spain.
29. Fletcher DLPoultry Meat Colour. Pages 159–176 in Poultry Meat Quality. R. I. Richardson and C. Mead, ed. CAB Publ., New York, NY. 1999.
30. Kucukyılmaz K, Bozkurt M, Catlı AU, et al. Chemical com-position, fatty acid profile and colour of broiler meat as af-fected by organic and conventional rearing systems. S Afr J Anim Sci. 2012; 42(4):360-368.
31. Nielsen BL, Thomsen MG, Sørensen P, et al. Feed and strain effects on the use of outdoor areas by broilers. Br Poult Sci. 2003; 44:161-169.
32. Baeza E, Dessay C, Wacrenier N, et al. Effect of selection for improved body weight and composition on muscle and meat characteristics in Muscovy duck. Br Poult Sci. 2002; 43:560-568.
33. Gordon SH, Charles DR. Niche and Organic Chicken Prod-ucts. Nottingham Univ. Press, Nottingham, UK. 2002. 34. Touraille PC, Kopp J, Valin C, et al. Chicken meat quality. 1.
Influence of age and growth rate and physico-chemical and sensory characteristics of the meat. Arch Geflugelkd. 1981; 45:69-76.
Correspondence: Sibel Canoğulları Doğan
Nigde Ömer Halisdemir University, Faculty of Agricultural Sciences and Technologies,
Department of Animal Production and Technologies 51240, Niğde/Turkey