KADIR HAS UNIVERSITY
GRADUATE SCHOOL OF SCIENCE AND ENGINEERING
AN EVALUATION OF ENERGY AND ELECTRICITY IN PAKISTAN
GRADUATE THESIS
MUHAMMAD JASIM HUMAIYUN February, 2016
ii M u h am m ad Jasi m Hu m aiy u n M .S 2 01 6 Stu d ent’s Fu ll Na m e P h .D. (o r M .S . o r M .A .) The sis 20 11
iii AN EVALUATION OF ENERGY AND ELECTRICITY IN PAKISTAN
MUHAMMAD JASIM HUMAIYUN
Submitted to the Graduate School of Science and Engineering in partial fulfillment of the requirements for the degree of
Master of Science in
INDUSTRIAL ENGINEERING
KADIR HAS UNIVERSITY February, 2016
iv AN EVALUATION OF ENERGY AND ELECTRICITY IN PAKISTAN
MUHAMMAD JASIM HUMAIYUN
APPROVED BY:
Prof.Dr. Volkan §. Ediger (Advisor)
Dog. Dr. Aliiiiet Deniz YUCEKAYA (Co-advisor)
Assoc. Prof. Dr. Zeki BOZKUb (Jury member)
v KADIR HAS UNIVERSITY
GRADUATE SCHOOL OF SCIENCE AND ENGINEERING
APP END IX C APPENDIX B
vi
ABSTRACT
EVALUATION OF ENERGY AND ELECTRICITY IN PAKISTAN Muhammad Jasim Humaiyun
Master of Science in Industrial Engineering Advisor: Prof. Dr. Volkan Ş Ediger
February, 2016
Pakistan is a developing country and it can only move forward once the energy sector is secure and self sufficient. Right from the beginning, the country has constantly faced energy shortages in all sectors due to incompetent policies and governence. This study frames the analysis of the current energy situation, with main focus on electricity. All the factors which are hampering the growth of the energy sector are identified and potential solutions are discussed. Matching the electricity supply and demand is the ultimate goal, therefore a forecast analysis (multiple regression model) based on seasonal variation in temperature is performed in order to predict the future electric consumption and help authorities take necessary actions for fulfilment. Finally, a comprehensive detail is provided on the causes and problems of the energy crisis, and potential solutions and reforms are provided.
Keywords: Pakistan Energy, Electricity, Energy Policy, Multiple Regression Model, Demand Forecast. APP END IX C APP END IX C APPENDIX B
vii
Acknowledgements
First of all I will thank the Almighty for helping me come this far and paving the way ahead of me.
I would like to express my utmost gratitude and love towards my family, especially my parents Khurram Humaiyun and Saadiah Humaiyun, who have stood by me in difficult times and helped me for whatever I have right now. I also appreciate their patience for all the period I have been away from home.
I express my gratitude and great respect to my advisor Prof. Dr. Volkan Ş Ediger for the useful comments, remarks and engagement through the learning process of this master thesis. Furthermore, I would like to thank my co-advisor Assoc. Prof. Ahmet Yücekaya, whose vast knowledge helped me finish the thesis. I am grateful to both my advisors for their help and encouragement.
I would like to thank my dear Irsa Chaudhry, the southpaw, through whom I learned the fact that flames of hope can never burn brightest without utmost despair. I would also thank my great friend, Mr. Ain Ali for his precious support and presence throughout this difficult time, may you be at the highest of highs.
Last but not the least, a very special thanks to my family in Turkey, Serkan ışık and
Örge Tokdil along with their parents, for showing such love and hospitality. My heart is always open to you.
viii
Table of Contents
Abstract
Acknowledgements
List of Tables xi
List of Figures xiii
List of Abbreviations xv
1 Introduction 1
1.1 Statement………... 1
1.2 Scope and Outline of the Study………... 2
1.3 Literature Review ……….………. 4
1.4 Materials and Methods……… 7
2 Overview of the Energy Sector of Pakistan 9
2.1 General Outlook……… 9
2.2 Primary Energy Supply and Final Consumption……… 10
2.2.1 Resources and Reserves ……… 12
2.2.2 Primary Energy Supplies ……….. 16
2.2.3 Final Energy Consumption ………... 18
3 Electricity Infrastructure of Pakistan 21
3.1 Overview ……… 21
3.2 Structural Organization and Deregulation of the Electricity Sector………. 23
ix
3.4 Electricity Generation ..………... 35
3.4.1 Fuel Consumption and Efficiency of Thermal Plants. …….38
3.4.2 Cost of Generation ….……….. 43
3.4.3 Capacity Factor ………..……...47
3.5 Transmission and Distribution of Electricity ...……... 48
3.5.1 Transmission ………... 48
3.5.2 Distribution ………. .50
3.5.3 T&D Losses ………. 54
3.6 Demand and Consumption ………... 57
3.6.1 Demand and Supply ………. 57
3.6.2 Demand and Supply Deficit ………. 60
3.7.3 Electricity Consumption ………... 62
4 Electricity Consumption forecast using Multiple Regression 66
4.1 Introduction ……….. 66
4.2 Data and Methodology ………. 67
4.3 Results ……….. 67
5 Conclusions and Recommendations 72
5.1 Problems ……… 72
5.2 Reasons for Problematic Situation of Electricity Sector …...…… 74
5.3 Recommended Solutions and Reforms ……… 74
References 79
x
Appendix B Power Plant Specifications 90
Appendix C Electricity Generation data 95
Appendix D Multiple Regression model data 111
Appendix E Performance of the Distribution Companies 119
Appendix F Distribution company-wise losses 123
Appendix G Reasons for Problematic Situation of 124
Electricity Sector
xi
List of Tables
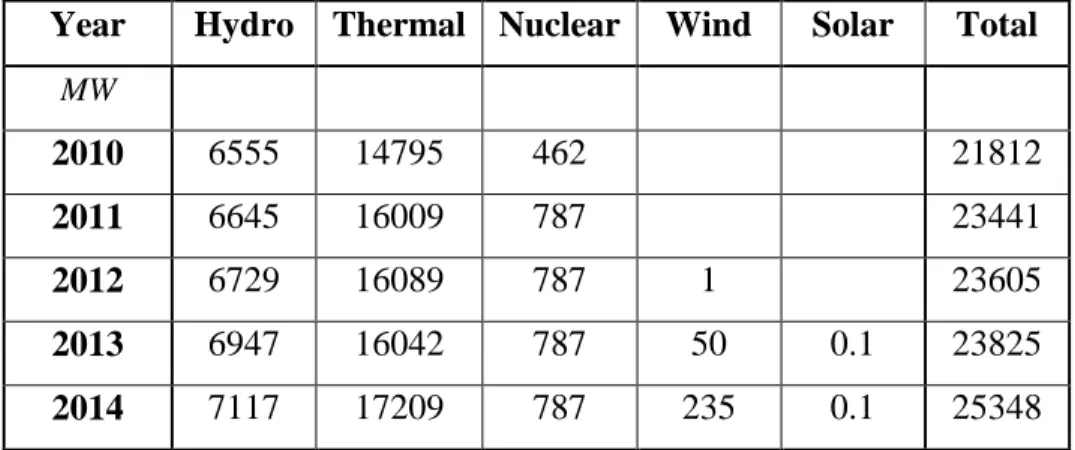
Table 3.1 Source-type installed generation capacities, 2010-2014 ... 28
Table 3.2 Fossil fuel input of thermal power plants, 2009-2013 ... 38
Table 3.3 Thermal output energy by fuel type, 2010-2014 ... 40
Table 3.4 Input vs output energy, 2010-2014 ... 42
Table 3.5 Thermal generation cost, 2010-2014... 44
Table 3.6 Hydro electricity generation cost, 2010-2014 ... 46
Table 3.7 Distribution companies in Pakistan ... 51
Table 4.1 Summary of predicted electricity consumption values ... 69
Table 4.2 Comparison of forecast results with previous studies ... 70
Table A.1 Energy budget ... 89
Table B.1 Thermal plants owned by public and private sectors ... 90
Table C.1 Installed Capacity of power plants, 1980-2014 ... 95
Table C.2 Installed capacity of public and private thermal power plants, 1990-2014 ... 96
Table C.3 Installed capacity of public and private hydro power plants, 1999-2014 ... 97
Table C.4 Electricity generation, 1980-2014 ... 98
Table C.5 Capacity factor of hydro, thermal and nuclear, 1980-2014 ... 99
Table C.6 Generation and installed capacity of power plants, 2010-2014 100 Table C.7 Capacity factor of power plants, 2010-2014 (NEPRA 2014) ... 103
xii
Table C.9 Technical specifications of thermal plants ... 108
Table D.1 Industrial production index of Pakistan 2009-2014 ... 111
Table D.2 Regression model data (temp, IPI, GDP, population) ... 112
Table D.3 MS Excel summary output of regression model ... 117
xiii
List of Figures
Figure 2.1 Energy reserve utilization of Pakistan till 2030 ... 12
Figure 2.2 Coal reserves of Pakistan ... 13
Figure 2.3 Oil and gas reserves of Pakistan... 14
Figure 2.4 Primary energy supply by fuel type, 2009-2013 ... 16
Figure 2.5 Energy mix, 2013 ... 17
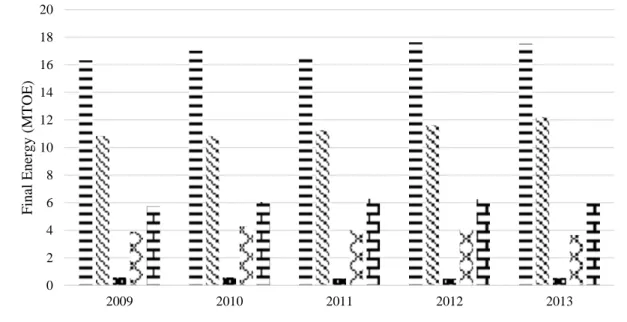
Figure 2.6 Final energy consumption by fuel type, 2009-2013... 18
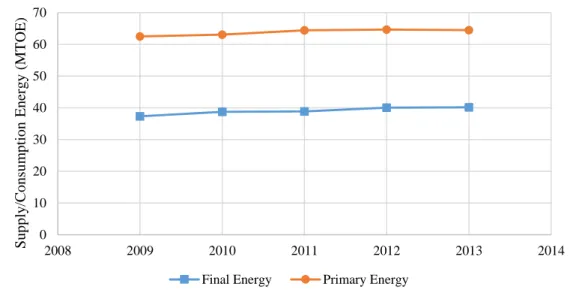
Figure 2.7 Supply vs consumption of energy, 2009-2013 ... 19
Figure 2.8 Sector-wise energy consumption, 2013 ... 20
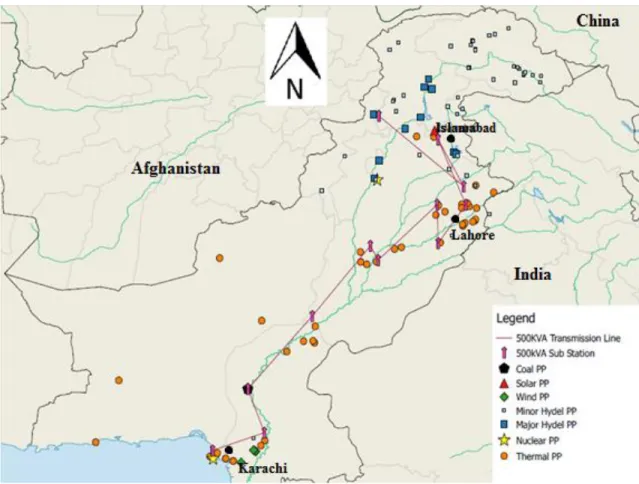
Figure 3.1 Electricity infrastructure map, 2015 ... 21
Figure 3.2 Correlation between electricity and GDP growth, 2001-2013 .... 23
Figure 3.3 Timeline of major historic developments ... 24
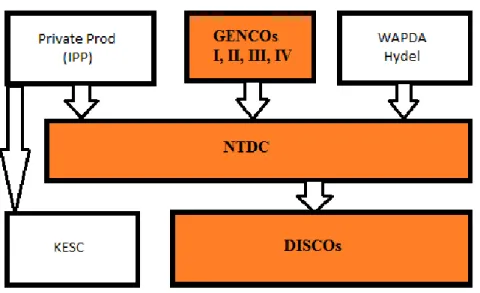
Figure 3.4 Managerial structure of Pakistan’s electricity sector, 2015 ... 25
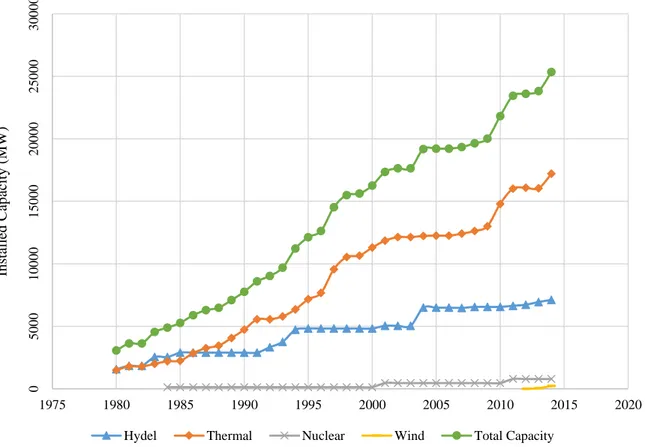
Figure 3.5 Capacity growth, 1980-2014 ... 29
Figure 3.6 Public-Private total capacity ownership, 1990-2014 ... 31
Figure 3.7 Public-Private thermal capacity ownership, 1990-2014 ... 32
Figure 3.8 Public-Private hydro capacity ownership, 1999-2013 ... 34
Figure 3.9 Electricity generation, 1980-2014 ... 35
Figure 3.10 Generation source comparison 1980 and 2014 ... 37
Figure 3.11 Input fuel energy for thermal electric generation, 2009-2013 ... 39
xiv
Figure 3.13 Improvement in plant efficiency world-wide ... 42
Figure 3.14 Thermal generation cost comparison between GENCOs, IPPs and KESC, 2009-2014 ... 45
Figure 3.15 Source-wise capacity factor, 1980-2014... 47
Figure 3.16 Transmission line network in Pakistan map ... 50
Figure 3.17 Distribution companies operating areas map ... 53
Figure 3.18 Units generated vs transmission losses, 2004-2014 ... 55
Figure 3.19 Units for distribution vs distribution losses, 2004-2014 ... 56
Figure 3.20 Transmission, distribution and total losses, 2004-2014... 56
Figure 3.21 Electricity demand per day, 2009-2014 ... 58
Figure 3.22 Hourly demand in summer and winter time, 2013 ... 59
Figure 3.23 Weekday vs weekend hourly demand in summer and winter time ... 59
Figure 3.24 Generation capacity vs average demand per day (MW) ... 60
Figure 3.25 Electricity demand and supply deficit ... 61
Figure 3.26 Electricity generated vs electricity consumed, 2010-2014 ... 62
Figure 3.27 Per capita energy consumption Pakistan vs India vs Turkey, 2010-2013 ... 63
Figure 3.28 Sector-wise electricity consumption, 1990-2014 ... 64
Figure 3.29 Sector-wise energy mix, 2014 ... 65
xv
List of Abbreviations
ADB ... Asian Development Bank AEAI ... Advanced Engineering Association International AEDB ... Alternate Energy Development Board BTPL ...Bahria Town Pvt Ltd. Co. CHASNUPP ... Chashma Nuclear Power Plant CNG ... Compressed Natural Gas CPPA ... Central Power Purchasing Authority DISCOs ... Distribution Companies FESCO ...Faisalabad Electric Supply Co. GENCOs ... Generation Companies GEPCO ... Gujranwala Electric Supply Co. GOP ... Government of Pakistan GWh ... Gigawatt-hour HESCO ... Hyderabad Electric Supply Co. IESCO ... Islamabad Electric Supply Co. IMF ... International Monitory Funds KANUPP ... Karachi Nuclear Power Plant KESC ... Karachi Electric Supply Co. LESCO ... Lahore Electric Supply Co. MEPCO ... Multan Electric Supply Co. MW ... Megawatt NTDC ... National Transmission and Dispatch Company PAEC ... Pakistan Atomic Energy Commission PEPCO ... Pakistan Electric and Power Co. PESCO ... Peshawar Electric Supply Co. PPIB ... Private Power Infrastructure Board QESCO ... Quetta Electric Supply Co.
xvi SEPCO ... Sukkur Electric Supply Co. TESCO ...Tribal Areas Electric Supply Co. WAPDA ... Water and Power Development Authority
1
Chapter 1
Introduction
1.1 Statement
As the world stepped into the age of industrial revolution, it has turned into a power house with rapid industrialization and automation. This transformation started with first phase of the industrial revolution in late 18th century with the advent of the steam engine which targeted a chain reaction of industrial processes. Gradually, people started to look for a more convenient form of energy which could be easily transformed from one form to the other and transmitted. Hence the second phase of industrial revolution saw the discovery of electricity as a form of energy (Britannica 2015). With the works of scientists like Tesla and Edison, electricity became the main source of energy for all sectors. Consequently, after 1970s the age of computers emerged, followed by robotics. Now, almost everything we own or use requires energy to run, and most important form is the electric energy. Electricity is one of the most vital type of final energies for socioeconomic development of the society. It nurtures the world as we know and is the very basic fragment of a developed world. It is the input power for machineries in factories and industries, for household gadgets, for lighting our cities and running the vehicles. The ever growing global competitiveness in science and technology requires any country to possess a sound energy profile. Therefore, for developing countries like Pakistan, the top priority should be to gain a sustainable electricity sector in order to promote advancement. Without it, the whole industrial sector will shut down, resulting in a dead trade and economy. There will be no metropolitan activities, no research and development, no educational activities and hence leading the country towards a ‘stone age’ like era.
When Pakistan gained independence in 1947, the energy infrastructure was almost non-existent. There was only a small hydro power availability, and no energy was being utilized through fossil fuels (Ullah 2013). As time passed, the government realized the importance of a developed energy sector, and hence Water and Power Development
2 Authority (WAPDA) was created in 1959 to handle the growing energy needs of the country. Numerous hydro projects were initiated and new oil and gas reserves were discovered. A sound infrastructure based on power generation by hydro and thermal resources was laid out and the sector continued to grow up until 1980s, after which the energy crisis started to emerge (Rauf et al. 2015). To tackle this problem, energy policies in 1985, 1994 and 1998 were developed but apparently none of them have been successful till date. Consequently, all the energy demanding sectors of Pakistan are severely suffering. There is extreme shortage of electricity resulting in lost industrial production and development, suffering commercial and domestic sectors and downfall in trade, economy and GDP. The country’s economy is largely based on textile production and agriculture with exports more than 60% of the total (Kalsoom 2008). Both these sectors require an unhampered flow of electricity in order to fulfill production potential, which is obviously not present at current conditions. If the country wants to achieve any success, it needs to feed the industrial and commercial sector with sufficient power supply. In this thesis, we will study all the pros and cons of the sector, and try and identify the main problems and suggest possible solutions, keeping in view the present status of the infrastructure.
1.2 Scope and Outline of the Study
In this study, firstly I have identified the overall energy sector, mainly the primary and final energies. Then focused on the electricity sector, highlighting all the key factors included from production till consumption. Analysis based on changes in trends, historic comparison and major developments are discussed. I then provided a mathematical model to identify the future consumption of electricity in the country and compared my results with other studies for validation. Finally, keeping in view the performance inspection done in this report, I proposed possible solutions and reforms which can help the sector to reincarnate.
3 Chapter 1 provides introduction, including history and importance of energy and electricity in this era. Also provides the basic structure of this thesis and a brief detail about previous studies done on electricity sector of Pakistan.
Chapter 2 includes the overview of the energy sector of Pakistan. It provides the basic numbers concerning primary energy production, imports, exports and conversion to final energy. Consumption of final energy in the form of electricity is also discussed.
Chapter 3 is based on the electricity infrastructure of Pakistan. It gives the governing structure details, types of power plants and fuels, installed capacity, generation (including costs), transmission and distribution, electricity consumption and matching of supply and demand.
Chapter 4 contains forecasting of electricity consumption on monthly basis with seasonal variations. The method used is multiple regression model with independent variables including population, GDP, industrial production index and temperature. The results are compared with a number of other studies and reports.
Chapter 5 outlines the crisis faced by the country in terms of shortage of energy. Problems
and their causes are discussed in details, and possible solutions are provided to help Pakistan pull itself out of this crisis. Finally, the conclusion based on the overall status of the energy infrastructure is provided.
4
1.3 Literature Review
There is an extensive literature available on the energy and electricity sector of Pakistan, ranging from detailed energy outlook to forecasting to renewable energy integration. The current crisis has led many researchers and scientists to take part in the energy battle, and try to find a final solution once and for all. Almost all of the studies are published with the energy shortages as the main issue of discussion. Some of the most recent publications on electricity sector of Pakistan are reviewed below.
Zaman et al. (2012) proposed a multivariate electricity consumption function for Pakistan with economic and population growth being the input variables. They used Wald-F statistics and concluded that population growth, foreign investment and income are positively correlated with the electric consumption but with different levels of impact (1% increase in income, international investment or population increases electricity consumption by 0.973%, 0.056% and 1.605% respectively).
Ullah (2013) explained the overall value chain of electricity infrastructure from production to consumption. The existing problems and future measures to improve the system are highlighted. Causes including governance failure, inadequate policies, and non-implementation of reforms are mentioned. Finally, the Theory of New Institutional Economics is applied for further research on the power sector.
Iqbal et al. (2013) estimated the electricity demand function for Pakistan using smooth transition autoregressive (STAR) model. This model correlates the consumption with variation of the GDP. They pointed out that continuous investment in the power sector is required to meet the increasing demand of electricity for a resultant increase in GDP. They concluded the results with analysis of using cheap resources for power generation, and the effect on pricing and tariffs.
5 Kessides (2013) points out the hardships that are being faced by the individuals and businesses in Pakistan due to the electricity deficits. He mentions that it is the main reason of the socio-economic failure of the country and has emerged due to institutional and governance failures. He drafted an improved potential policy in order to end this energy bankruptcy.
Ali et al. (2013) used ARIMA model to forecast the electricity consumption with varying in seasonal temperature in Pakistan until 2020. Their model displayed that with increase in temperature, the consumption will also increase and July 2020 will see the highest demand of 6785.6 GWh.
Nayyar et al.(2014) in their publication, ‘Assessment of present conventional and non-conventional energy scenario of Pakistan’, reviewed and assessed the demography of the country versus energy sectors, supplies, consumption, reserves, electricity generation and demand supply. They mostly concluded that conventional resources are not enough to satisfy the growing energy needs, and a well-planned renewable energy setup is required to solve the energy problem.
Satti et al. (2014) attempted to evaluate the relation between coal consumption and economic growth of Pakistan. They applied the VECM Granger causality approach and concluded that there is a bidirectional Granger Causality between the two factors.
Mahmood et al. (2014) proposed some methods in order to minimize the energy deficits. They analyzed the effects of energy imports on fulfilling the energy supply and demand gap. They discussed the proposed projects including Turkmenistan, Afghanistan, Pakistan and India (TAPI) project; Iran, Pakistan and India (IPI) gas pipelines; Liquefied Natural Gas (LNG) import from Qatar. They also proposed the development of infrastructure on basis of renewable energy.
6 Perwez et al. (2015) established the overview of the electricity sector of Pakistan with historical summary of supply and demand. They used a Long-range Energy Alternate Planning (LEAP) model to forecast the demand of electricity. They divided the future scenario into three parts; i) Business-as-usual, in which they assumed the future electricity sector to maintain the current growth status; ii) New Coal (NC), in which they assumed the future electricity production to be mainly based on the coal resources of Pakistan; and iii) Green Future (GF), in which the forecast with renewable energy integration in mind. They concluded with policy implications of model for future electricity generation and environmental policies.
Rauf et al. (2015) gave a comprehensive details on the energy sector of the country from establishment, history and achievements to energy reserves, electricity generation/consumption, and renewable energy potential. Finally, they pointed out the causes of the energy crisis and provided solutions.
Shaikh et al. (2015) diagnosed the overall conditions of the Pakistani electricity sector with potential and planned developments to improve the overall situation. They evaluated the implementation of the National Energy Security Plan, a government proposed plan to rejuvenate the energy infrastructure of the country, and came to the conclusion that no progress has been done in practicing this plan. Finally, they discussed the alternative energy solutions which can tackle the ongoing energy deficits.
Zakaria and Noureen (2016) in their report, ‘Benchmarking and regulation of power distribution companies in Pakistan’, used stochastic frontier analysis to determine the cost effectiveness and efficiency of the power distribution companies working under the government. Their model concluded that there is 72.5% average efficiency of this sector, and this further deteriorates the quality of service. Their results are compared to my own evaluation and close matching is found. The distribution network of the country is in the
7 worst state and rapid action needs to be taken to cut down the losses incurred by public companies.
Hussain et al. (2016) applied Holt-Winter and Autoregressive Integrated Moving Average (ARIMA) models to forecast the electricity consumption sector-wise. They came to the conclusion that the gap between electricity supply and demand will steadily increase if no appropriate actions are taken. According to their results, the residential sector will eventually have the highest demand. They recommended some solutions, which can finally eradicate the gap between supply and demand.
All these studies contains the detailed information on the electricity sector of Pakistan. Almost all of them research about the energy shortages Pakistan is facing in one way or the other. According to my conclusion, if the best aspects of these studies can be collected into one box and implemented in the current energy policy of the country, they can act as coup de grâce to the crisis.
1.4 Materials and Methods
Most of the analysis done in this study is based on the statistics provided by the National Electric and Power Regulatory Authority (NEPRA) and the Pakistan Private Investment Board (PPIB) in the State of Industry Report 2014. The data include information about all the power plants, historic installed capacities and generation, production and consumption, etc.
Data was also collected from historic archives of plant licenses, policy reports and law papers. The main source of material and data are the government records of statistics, and also studies done on this information by various people. In addition, information was
8 collected from a number of previous studies done by researchers residing within Pakistan as well as abroad. Facts and figures were compared and the best solution was chosen to be presented in this report. The method used for forecasting of electric consumption is explained in details in chapter 4.
Chapter 2
9
2.1 General Outlook
Pakistan is richly blessed with various forms of energy resources, the effective utilization of which can boost the country’s economy. The energy setup is under direct or indirect control of the government and a number of private agencies. The end consumer include residential, industrial, commercial, transport and agriculture sectors, while the supply mix consists of oil, gas, coal, hydroelectricity and nuclear energy. When Pakistan gained independence in 1947, the energy infrastructure was almost non-existent. As time passed, the structure also developed and new gas and oil reserves were found and new projects started to emerge. Rauf et al. (2015) identifies in their study that the energy sector gained momentum after 1970s and continued to grow until 1990s, during which international investments by World Bank and other agencies were flourishing. According to them, a number of mining projects were developed and power plants were commissioned by the government, including the large hydro, thermal and nuclear setups. After 1990s, the power crisis started to emerge due to factors like political unrest, downfall of economy and terrorist threats. The sector got stagnant and no new major developments were made for resource mining and power generation projects.
In the past decade, the problems have worsened and there is an extreme shortage of available energy. It is also a bi-product of poor management, lack of operations, lack of capital, and lack of planning and solid policies. To add more, the gas reserves of the country are diminishing which is alarming due to the fact that the energy sector is most reliant on this fuel. The country has insufficient oil reserves to substitute for gas, and it is economically impossible for Pakistan to import large amounts of oil or gas in order to meet the energy demand. A massive 186 billion tons of coal reserves were recently discovered, but there is no coal based facilities present and it may take a lot of effort and time for its proper development. Due to under-funding and absence of a sound research and development sector, the renewable energy technology is not yet established in the country, while the potential for it is impressive given the geological properties.
10 Energy shortage is the most significant player in bringing down the economy of the country. Besides lack of availability of fuel for transportation, heating and industrial use, the electricity sector is suffering the most. Kessides (2013) mentions the amount of shortfall of electric supply to have reached value of over 5000 MW, resulting in power outages of more than 20 hours per day in some villages. The reasons, he identifies include insufficient installed capacity, circular debt, revenue inadequacy, availability and efficiency of existing power plants, power losses and expensive means of production. Besides this, there are a number of studies which identify the same basic fundamentals of the problems, and provides with feasible solutions but unfortunately no substantial developments are being followed by the government as yet and the energy problems persists and getting worse day by day. Rauf et al. (2015) points out that the country can still pull itself out of this crisis with smart future planning and implementation. All available energy resources should be fully exploited, especially indigenous and renewable ones, and conservation of energy should be practiced. It is difficult, but not impossible, to implement a coherent energy policy for a sound energy security of the country
2.2 Primary Energy Supply and Final Consumption
Pakistan is dependent on oil, natural gas, coal, hydro and nuclear for its commercial supply of energy. In 2013, the total production and consumption of primary energy was 64.59 MTOE and 40.18 MTOE respectively (although the production is larger than the consumption, the difference is due to a number of losses which will be later discussed) (NEPRA 2014). Natural gas plays the most significant role in the energy mix of Pakistan, contributing to 48% of the input. It is harvested from local fields, with Sui and Mari being the largest ones. When gas was discovered in 1950’s, the reserves were thought to be virtually ever-lasting. Therefore, the energy infrastructure was molded in a way which was mainly gas dependent. It is being used for power generation, domestic heating and cooking and as vehicle fuel. Unfortunately, the accessible gas reserves are now coming to
11 an end, and with the current consumption rate, it is prone to be finished by 2025-26 (GOP 2011). Consequently, the government has taken certain actions to slow the rapid exhaustion.
The second most important fuel in the energy mix is oil, contributing about 32% of total energy. It is both produced locally and imported. There are a number of refineries which convert the crude oil into refined products. This source is used for power generation and transportation purposes. Due to the scarce reserves of oil in the country, most of it is imported and this results in a burden on the delicate economy of the country.
Coal is a major source of energy all around the world, but in Pakistan it plays an insignificant role in the energy mix. The main consumer of coal are the industries. The hydro source is abundant, especially in the north region of Pakistan. Although it is not fully utilized, but is an important source for electricity generation. As far as nuclear energy is concerned, it is used for power generation. Although the first nuclear plant was established in 1972, there has been no substantial development in this sector since then and it contributes minute energy in the mix.
Currently, Pakistan plays no role in imports or exports of electricity. Only a small amount of electricity is imported from Iran, amounting to 74 MW, for the coastal area of Makran. It is considered to be a test project, and a foundation for upcoming potential projects planned by both governments. The project is being expanded to 100 MW for now, and later will grow up to 3000 MW (The Express Tribune 2016).
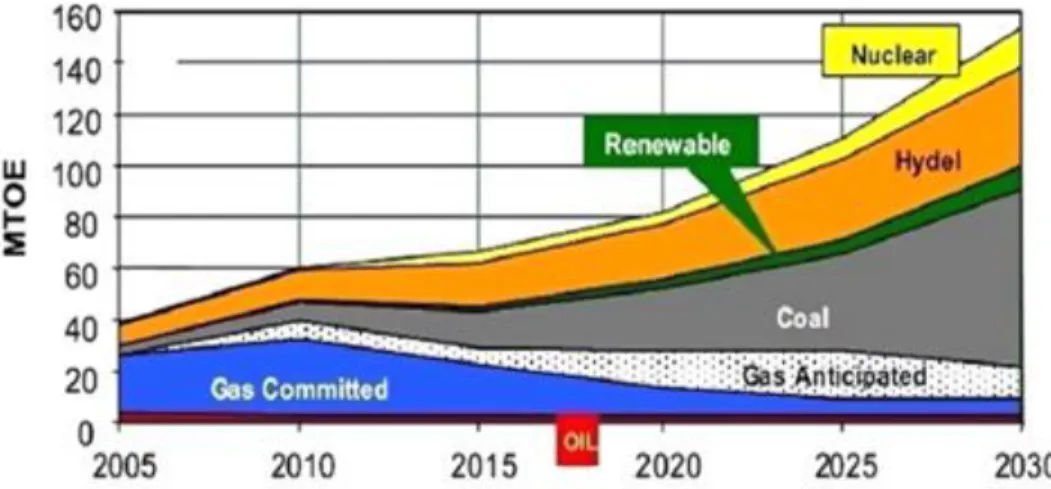
12 Rauf et al. (2015) studied the natural resource reserves in their research and will be outlined in the following text. According to the report, Pakistan has enough resources to make its energy sector self-sufficient, and even export to neighboring countries. Figure 2.1 highlights the energy reserve utilization till year 2030.
Figure 2.1 Energy reserve utilization of Pakistan till 2030 (Meyhoefer 2008)
Coal
Coal deposits in Pakistan are estimated to be 6th largest in world. Although the coal
reserves were known at the time of independence, but it was not until 1980 that detailed survey was made in economic and technical grounds. Geographic location of the coal deposits are illustrated in figure 2.2. Most of the 186 billion tons of reserve is found in Thar Desert and Lakhra in Sindh province. Coal quality ranks from lignite to sub-bituminous with a comparatively lower heating value of 6223 Btu/lb to 10288 Btu/lb. This proves the fact that there is low utilization of coal as an energy source due to high processing cost of such quality. There is only one coal-fired power plant present in Pakistan, which used 104,604 tons to produce 40 GWh of electricity in 2013, while most of the coal is consumed by the cement and brick kiln industries.
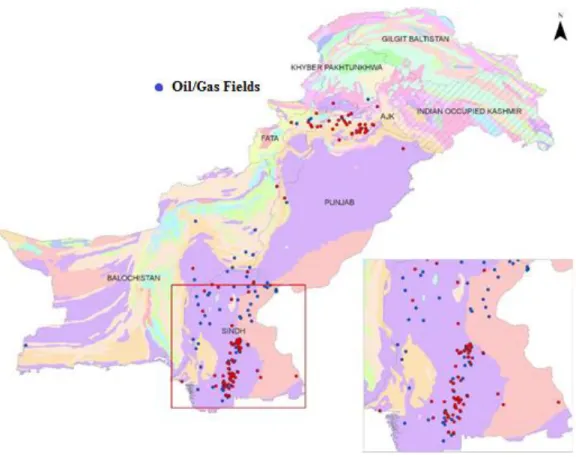
13 According to NEPRA’s State of Industry Report 2014, the recoverable reserves of crude oil in Pakistan are estimated to be 371 million barrels. In 2013, 27.84 million barrels were produced from these reserves. Figure 2.3 illustrates the oil and gas deposits, and it can be seen that most of them are present in the province of Sindh, while some can also be found in the province of KPK.
Figure 2.2 Coal reserves of Pakistan (Alhasan Systems Pvt.Ltd., 2012)
The refining capacity of the country is 18.79 million barrels/year, while 10.75 million barrels was processed in 2013. Total imports of crude oil in 2013 amounts to 7.4 million tons, costing $600 million and most of it is imported from Gulf States. The locally produced and imported crude oil is converted into furnace oil, light diesel oil, high speed diesel and motor spirit. In power generation, fuel oil and high speed diesel are used. In 2013, 7.75 million tons of these two products were used as fuel inputs in thermal plants
14 (NEPRA 2014). The main consumers of oil are the transport and the power sector, with a 90% share of the total consumption.
Figure 2.3 Oil and gas reserves of Pakistan (Alhasan Systems Pvt.Ltd., 2012)
Natural Gas
Extraction of gas requires a heavy investment, with cost recovery time of 10-15 years. In Pakistan, the obtainable reserves of natural gas are estimated to be 24.74 tcf. In 2013, 1,505,841 mcf was produced (equivalent to 32 MTOE). Most of the gas fields are present in the province of Sindh, as shown in figure 2.2, with Mari and Sui being the main ones. There are about 15 companies which are extracting gas from about 190 gas fields.
15
Hydel power
Pakistan has an ample hydel resource present in the northern areas amongst the mountainous regions. Melting of glaciers from the high peaks allows for a huge potential energy in the flowing water. In spite of this, a very low amount of this energy source is harvested for electricity generation. There are just three main hydel dams which are present in Punjab province. Hydro power is alone considered to be a sufficient source of electric generation, with 65,000 MW of identified projects and 100,000 MW potential, while only 7,117 MW is currently installed (The Express Tribune 2015).
Nuclear energy
Pakistan is among the 30 countries in the world which utilize nuclear energy. Uranium is locally harvested and imported from China. Nuclear energy is used for generation of electricity, and about 787 MW of capacity is installed in Pakistan. Although, the nuclear setup has been present for more than four decades in Pakistan, but the growth has been close to none. There are four main uranium deposit sites present in the country, with an estimated amount of 1160 tons (OECD 2010).
Renewable energy
The geological nature of Pakistan provides favorable conditions for renewable energy resources. Due to situation near the equator, there is plenty of sunshine with an estimated potential of 50,000 MW for solar power generation. The sunshine lasts about 7-8 hours per day in the provinces of Sindh and Baluchistan. Similarly, the wind potential is estimated to be 20,000 MW and the government is collaborating with a number of international companies in order to deploy wind power generation setup in the country. A number of projects are already in operation and a few major ones are pipelined and proposed. Biogas, geothermal and ocean wave energies are also abundant, but little or no work has been initiated in these fields. The government should research projects to calculate the feasibility of these renewable projects and approach investors in order grow
16 this setup for sufficient supply of energy. Alternate Energy Development Board (AEDB) has been recently setup in order to pursue development in this sector.
2.2.2 Primary Energy Supplies
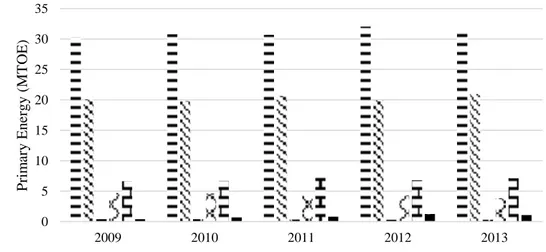
Production of primary components includes coal, crude oil, oil products, gas, nuclear and hydro. In energy budget 2013, 64.59 MTOE was the net energy supply consisting of coal, oil, gas, nuclear and hydro. Figure 2.4 illustrates the energy supplies in Pakistan. The key component in the energy mix, as mentioned earlier, is clearly natural gas with around 48% of share. It is followed by oil, with around 33% of the share. Hydro power is one of the first resources used in Pakistan for electricity generation. Although it does amount to a significant value, but if used to full potential, it can supply ample energy to the whole country alone. Coal supplies a small amount to the energy, around 6%. Nuclear energy is used for electricity generation, with around 1-2% of share in the energy mix.
Figure 2.4 Primary energy supply by fuel type, 2009-2013
0 5 10 15 20 25 30 35 2009 2010 2011 2012 2013 P rim ar y E n er g y ( MT OE )
17 Following are the import figures for 2013:
Coal: 2.557 MTOE (2.9% of total primary energy) Crude oil: 7.819 MTOE (9.1% of total primary energy Oil products: 11.651 MTOE (13.5% of total primary energy) Total imports: 22.027 MTOE (25.6% of total primary energy)
The figures show that Pakistan is not heavily reliant on imports of energy because of weak economic structure, less bilateral correspondence and extreme political corruption. This is one of the major reasons of energy shortages. As a comparison, Turkey imports more than 75% of its energy products and therefore the energy supply and demand is matched and the country faces no major power crisis.
Figure 2.5 Energy mix, 2013
Gas 48% Oil 33% Coal 6% Hydel 11% Nuclear Electricity 2%
18
2.2.3 Final Energy Consumption
The main forms of final energy are gas, oil, coal, LPG and electricity. These supplies are provided to the consumer end; including industrial, transport, residential, commercial, and agricultural sectors. In 2013, 40 MTOE of final energy was consumed. Figure 2.6 shows the final energy consumption by resource type in Pakistan. The consumption of oil and gas has a slightly rising trend between the years shown in above diagram. This can be explained by the increase in electricity generation as well as industrial and domestic consumption.
Figure 2.6 Final energy consumption by fuel type, 2009-2013
The transition of primary to final energy results in an inevitable loss in the form of heat, mechanical motion etc. Figure 2.7 shows the primary energy vs final energy, where the area in between is the loss. In 2013, 24.41 MTOE of energy accounted for wastes and losses which makes 37.7% of total energy. This energy loss can be decreased, but not fully
0 2 4 6 8 10 12 14 16 18 20 2009 2010 2011 2012 2013 Fin al E n er g y ( MT OE )
19 cancelled as the laws of thermodynamics explains. The causes of the lost energy includes auxiliary consumption by plants and refineries, heat and mechanical losses, and other miscellaneous causes like theft or unaccountability.
Figure 2.7 Primary supply vs Consumption of energy, 2009-2013
The heaviest consumer is the residential sector, shown in figure 2.8. Mostly, gas and electricity are the two main components in this sector. The transport sector includes oil and gas consumption. Industrial sector includes coal, oil, gas and electricity consumption. The non-energy uses are mostly for chemical productions like mobile oil etc.
0 10 20 30 40 50 60 70 2008 2009 2010 2011 2012 2013 2014 Su p p ly /C o n su m p tio n E n er g y ( MT OE )
20 Figure 2.8 Sector-wise energy consumption, 2013
Pakistan only exports 0.8 MTOE of crude oil, which is a minute number. The overall production and consumption scenario can be explained by the energy budget, which provides the balancing of production, imports/exports and consumption. A detailed statistics of the energy budget of 2013 are given in tabular form in table A.1 in Appendix A (International Energy Agency 2014).
Industry 24% Transport 18% Residential 50% Commercial and public Services 3% Agriculture/forestry 1% Non-energy use 4%
21
Chapter 3
Electricity Infrastructure of Pakistan
3.1 Overview
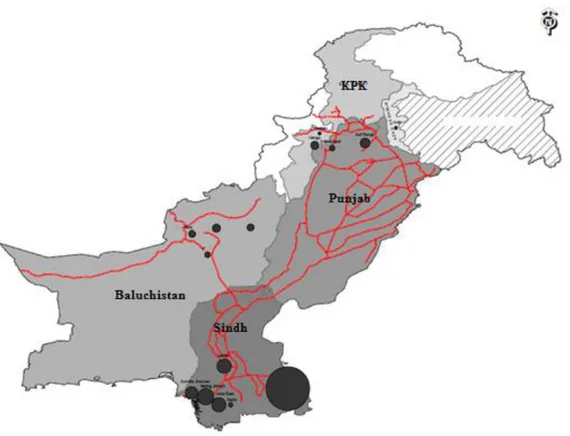
In 1947, the newly formed state of Pakistan inherited an intalled capacity of 60 MW of power plants for a population of 31.5 million (ICCI 2011). Figure 3.1 shows the details of the electricity system of Pakistan. Electricity sector in Pakistan consists of power plants including thermal, hydro and nuclear with a transmission and distribution system. All of the hydro plants are present in the provinces of KPK and Punjab, which is in the northern part of the country. The thermal plants are situated mostly in the main areas, including provinces of Punjab and Sindh.
22 It can be seen in the figure that only four thermal plants are present in the province of Baluchistan (east side of the country). The main transmission line of 500 kVA runs from lower KPK, through Punjab and ends up in Sindh. Rest of the areas are served by smaller transmission network. Karachi Electric Supply Co. (KESC) and rest of Sindh is delivered with electricity from the northern Pakistan through this main transmission line. Generally, the country has a biased distribution of the electric sector components, with Punjab and Sindh being the most favored areas. The reasons for this are the population density and the presence of metropolitan cities.
The country has been facing electricity shortages right from its inception to present day. Initially, the industries were hit by the crisis, and now the whole country is suffering. The Power Policy 1994 was aimed to overcome this newly built crisis. It was identified that the demand growth has risen from 4% per annum to 7% per annum from 1990s to 2000s, but the policy failed to fulfill this demand growth in every aspect (Rauf et al. 2105). Throughout this study, factors leading to the shortages will be identified.
Change in economy and electricity generation are strongly correlated and the figure 3.2 shows that the growth rate of GDP remain low with those of power generation. Trade and economy have been severely affected by this drop in GDP and industrial output has dropped by 15-35% in recent years (Iqbal et al. 2013). Rauf et al. (2015) also identifies the importance electricity and GDP. They mention in their report that for 1% increase in GDP, an increase of 1.25% in electricity generation is required.
23 Figure 3.2 Correlation between electricity and GDP growth, 2001-2013 (Iqbal et al. 2013)
3.2 Structural Organization and Deregulation of the Electricity Sector
Timeline showing major development in the electricity structure of Pakistan is given in the figure 3.3. Before independence, Karachi was one of the main cities of India and in 1913, the government formed KESC to provide power to the city and its adjoining areas. After independence in 1947, there was no distinguished authority for regulation of the power sector. As the power needs increased, the country needed a body to administer the sector, hence Water and Power Development Authority (WAPDA) was formed in 1959 (Iqbal et al. 2013). The sector saw satisfactory performance and growth but the country started to face electricity shortages in mid 1980s
The effort to restructure Pakistan’s power sector in mid 1980s was hence initiated in order to cope up with the power shortages. Incompetent governance and heavy losses within the system were becoming a hindrance to an uninterrupted supply of electricity, therefore it was realized that power capacity, generation and transmission efficiency and expansion could only be achieved by intervention of the private sector (Malik 2010). Prior to this, power generation in Pakistan was a monopoly, completely state-owned and operated (Hagler Bailly Pakistan 2003). The first private power policy was instituted in 1985, and was aimed to encourage private investors to take part in electricity generation.
24 Figure 3.3 Timeline showing major developments in the electricity structure
In 1986, the government introduced BOO (Build-Own-Operate) investment model, but there was a lack of sufficient incentives to attract the private investors (Ullah 2013). At this stage, the electricity infrastructure was exclusively under the government bodies, the WAPDA and KESC. All segments of value chain were concentrated within these entities.
Later, the Asian Development Bank (ADB), International Monetary Funds (IMF) and World Bank motivated the restructuring of this system through institutional changes to improve the efficiency and the quality of the system. Consequently, major steps towards deregulation were taken in the Power Policy of 1997-98. Privatization of the structure was initiated and WAPDA was unbundled, however only generation sector was opened to market competition while transmission and distribution were separated from WAPDA into public companies (Ullah 2013). KESC remained intact, and was privatized as it is (25.6% still under GOP, while 71.2% was transferred to a foreign consortium) and is linked to the remaining system for electricity purchase only (KESC 2012).
1913 Creation of KESC 1947 Independen ce of Pakistan 1959 Creation of WAPDA 1985 Private power policy 1986 BOO model NEPRA Act 1997-98 2002 Power Policy 2006 Renew able Power Policy 2008 Power Policy 2010 Power Policy 2013 Power Policy
25 Unbundling of WAPDA resulted in creation of 10 distribution companies (DISCOs), 4 generation companies (GENCOs), with thermal power generation license, and a transmission company, National Transmission and Dispatch Company (NTDC) (ICCI 2011). However, hydel generation was still under the control of WAPDA. The figure 3.4 illustrates the surgery in a simplified manner. At present, components in dark background are the unbundled parts of WAPDA. Electricity is generated by independent power producers (IPPs), GENCOs and WAPDA and sent to NTDC grid, after which it is distributed by the DISCOs to the consumer end.
Figure 3.4 Managerial structure of Pakistan’s electricity sector 2015
Regions of Pakistan are sub-divided into 10 DISCOs of each division which supply electricity to their corresponding areas. The KESC handles its own distribution and transmission responsibilities, and is connected to a few private thermal plants (IPP’s) for electricity purchase. Besides the efforts of the government to utilize the benefits of privatization, only thermal generation is subjected to privatization, even to this day.
26 To manage this whole newly formed system under the Power Policy of 1997-98, Pakistan Electric and Power CO. (PEPCO), a separate agency within WAPDA, was created in the same year. It was aimed to consolidate the organizational setup, and induce coordination and integration between the thermal generation (GENCO’s), distribution (DISCO’s) and transmission (NTDC) bodies. All the thermal power plants operated by the GENCO’s comes under the command of PEPCO. The Central Power Purchase Agency (CPPA) was also setup in 1998 to coordinate the payments within the structure. Again, under the 1997-98 law, private investments in thermal generation were promoted. Hence, the system remained to be a public monopoly therefore, another body was formed to regulate the public sector entities in 1997 i.e., National Electric Power and Regulatory Authority (NEPRA). Malik (2010) noted that “National Electric Power Regulatory Authority
(NEPRA) was created under the NEPRA Act 1997-8 to ensure fair competition and consumer, producer and seller protection”. Coherently, to monitor the side of private
sector of power, Power Infrastructure Board (PPIB) was formed, providing added security and incentive measures to the private entrepreneurs, both existing and potential. The deregulation of the sector has been assessed in a number of studies, but the conclusion remains the same that although the expectation was positive, but the results have been almost fruitless.
After the Power policy of 1998, a number of new policies were introduced in 2002, 2006, 2008 and 2013 consisting mainly of promotions to attract private sector for mining indigenous resources (mainly hydel) and to facilitate public as well as public-private partnerships. According to my assessment of these policies, only minor changes have been made from the original Power Policy of 1998 which was discussed in details. It is not much worth going into the details of these policies.
Recently, a U.S based company known as Hagler Bailly Pakistan Ltd. is working with the GOP and private power producers to propose insightful endeavors, both in generation and
27 transmission sector. Evaluation is being conducted by Hagler Bailly with other firms to privatize three of the GENCO’s, including GEPCO, LESCO and IESCO. Also a new power system model is being developed by Advanced Engineering Association International (AEAI) and Hagler Bailly to improve the overall electricity structure (Hagler Bailly Pakistan 2014).
As far as the nuclear setup of Pakistan is concerned, the Pakistan Atomic Energy Committee (PAEC) was established in 1955. It is a government authority which owns and operates the three existing nuclear power plants. Construction of the first plant started in 1965 and the production commenced in 1972. After this, two more plants were established in 2000 and 2011. Pakistan is yet to reach its ambition on developing 8000+ MW of nuclear capacity.
3.3 Power Plants and Installed Capacity
A power plant is a unit which converts primary energy into electricity through mechanical motion. In Pakistan, fossil fuels such as coal, oil, and gas, hydro, nuclear, renewables such as wind and solar are used to generate electricity. Generally, almost all the Hydro plants are owned by the government. For thermal plants, the IPP’s have a larger share (in terms of number of plants as well as installed capacity). The nuclear plants present in Pakistan are under the ownership of PAEC. As for now, there is no notable development in the renewable sector (wind and solar) but the GOP is actively working on new frameworks to bring in the use of renewable energy to make the energy mix more sustainable. Most of the data in this section is collected from the State of Industry Report 2014 by NEPRA. The details of some major power plants are given in the Appendix B. More details including power plant-wise generation, capacity, capacity factor and cost of generation are all included in table C.6 in Appendix C. Technical specifications of thermal plants are provided in table C.7 in Appendix C.
28 A considerable growth of generation capacity can be seen during the lifetime of the country from 60 MW in 1947 to 25348 MW in 2014. The main sources of power generation are thermal and hydro, while the minor ones include nuclear and renewables. In 2014, thermal was 68%, hydro 28%, nuclear 3%, wind 1% and solar <1% of the total installed capacity. Table 3.1 gives the installed capacities from 2010 to 2014 of each type of power plants.
In thermal power plants, the major chunk of power generation resource is furnace oil, diesel and natural gas. This means that Pakistan’s electricity is mostly produced from an expensive means, as most of the crude oil and oil products are imported. After the privatization law of 1985, the GOP had amended the power law in such a way as to attract a market based power economy, which flooded investments in power plants that use fossil fuels such as oil and gas (NEPRA 2014).
Meanwhile, only minor hydro generating units are open for privatization which resulted in a stunted growth of this sector. The nuclear alternate is totally in the hands of the government and the sector could not grow due to continuous economic and political crisis. As for the renewable energy resources, such as wind and solar, only recently the Alternate
Year Hydro Thermal Nuclear Wind Solar Total
MW 2010 6555 14795 462 21812 2011 6645 16009 787 23441 2012 6729 16089 787 1 23605 2013 6947 16042 787 50 0.1 23825 2014 7117 17209 787 235 0.1 25348
29 Energy Development Board (AEDB) has been established to help promote sustainability with integration of these renewable resources into the energy mix.
Figure 3.5 indicates that there was a satisfactory growth in both hydro and thermal power generating capacities until around 1995. After this period, it can be seen that increase in only thermal capacity is present, while the rest are almost stagnant.
In fact, the graph of overall capacity is similar to that of thermal capacity, which tells the close dependence of power generation on fossil fuels. Up until 1988, thermal and hydro
0 5 0 0 0 1 0 0 0 0 1 5 0 0 0 2 0 0 0 0 2 5 0 0 0 3 0 0 0 0 1975 1980 1985 1990 1995 2000 2005 2010 2015 2020 In stalled C ap ac ity ( MW )
Hydel Thermal Nuclear Wind Total Capacity
Figure 3.5 Capacity growth, 1980-2014 (tabular data provided in table C.1 in Appendix C)
30 installed capacities were approximately the same but thermal capacity started to rise and the gap started to increase further and further as new thermal plants were developed while nothing new was being done in the hydro sector. The gradient of total capacity increases after 1993 due to commissioning of new IPP power plants, and continues up until 2004, after which the country started to face major power shortages. A stunted economic advancement and unsteady government hampered the growth of power sector explained by the low gradient between 2004 and 2009, when no major additions were made to the total installed capacity. With the change of government, the period between 2010 and 2012 saw improvements and can be seen by the increasing gradient. About 10 new thermal power plant projects were commenced in this period, giving considerable rise to the installed capacity.
The small rise in hydro capacity at around 2003 is due to building of the Ghazi Barotha dam in 2003, and after that no major projects have been developed except small private hydro plants. The nuclear capacity line shows that there has been almost no increase in this sector. Only recently there has been some development in the renewable sectors of solar and wind after the establishment of the AEDB. The total capacity shows a general rise, but this amount of expansion has been insufficient to meet the demand and supply. In hypothetical sense, this line should match the characteristics of an exponentially growing one (a continuously increasing gradient) in order to maintain continuous electricity supply to the ever-growing population and demand of the country. The data shows an average increase of 655 MW of capacity per year.
Figure 3.6 shows the share of total generating capacity between public and private sector in the PEPCO area (KESC is excluded). Tabular data provided in table C.2 in Appendix C. In the PEPCO area (all Pakistan except Karachi), generation is contributed by thermal, hydro and nuclear. Although there are over 30 thermal IPP’s in the PEPCO area, still the larger share of total generating capacity belongs to the government. This is due to the government ownership of all the hydro plants present in the country.
31 Major contribution of IPP’s generation into the electric grid started in 1997, with the commissioning of KAPCO and HUBCO power plants. The trend continued to increase up until 2003, where the capacity share of private ownership decreased due to the commencement of the new public owned Ghazi Barotha hydro plant, which contributed 1450 MW capacity. The trend again started to increase as new IPP’s were adding to the grid till 2011, after which there has been no new private investment in the thermal sector. Meanwhile a few additions were made to the publicly owned power plants (CHASNUPP nuclear Extension, Khan Khwar hydro plant and Jinnah hydro plant) which explains the slight downfall of IPP share and increase in public share of the total capacity after 2011. Currently, 41% of share is held by the IPP’s and 59% by government in the PEPCO area.
Thermal Generation Capacity
Thermal power generation has a capacity of 17,209 MW and contributes to 67% of the total mix. This is due to the large private share, showing that the government gave impetus to private establishments. 0 10 20 30 40 50 60 70 80 90 100 1985 1990 1995 2000 2005 2010 2015 2020 T o tal In stalled C ap ac ity ( %) Government Private
32 Currently, private share is 65% compared to 35% of the public sector in terms of capacity, as shown in figure 3.7. The trend of private owner-ship is an increasing one. After mid 1990’s, the increase has been maximum. From 1995 to 2000, an increase of 4024 MW can be seen in IPP’s capacity, and in a span of 34 years, 462 MW of thermal capacity is added each year on average basis. As mentioned in the previous section, the total increase of capacity per year has been 655 MW which makes thermal contribution of 70% in terms of this increase (this only is the contribution of IPP’s in the total rise in capacity per year). The sharp increase in IPP’s capacity in the year 2006 is because of the privatization of KESC, when all their plants were handed over to a multinational firm, The Abraaj Group (Abraaj 2015). 0% 10% 20% 30% 40% 50% 60% 70% 80% 90% 100% T o tal T h er m al ca p ac ity ( %) Public Private
33 The public sector has, however, seen less development through time. From 1990 to 2014, an increase of 1588 MW is seen. This makes a per year average increase of 106 MW. A few number of power plants have been added under the GENCO’s after early 1990’s, and they generally have lesser generation efficiency compared to the IPP’s plants. The installation of a new unit in Guddu Plant and building of Nandipur Power Project contributes to the slight increase in public capacity in 2014 after 8 years. All these facts points to the direction that the GOP is not interested, or unable to, in investing into new power projects. Other facts include depletion of natural gas and expensive import of oil.
Hydro Generation Capacity
At present, the total hydro installed capacity is 7117 MW, which is a minute number compared to the so-called 65,000 MW potential. The only major exploitation of this indigenous resource are through the three main power dams namely Tarbela, Mangla and Ghazi Barotha, summing up a total generation capacity of 5928 MW. This is approximately 24% of the total installed capacity installed in the country.
WAPDA is the sole owner of the hydro capacity installed as can be seen in figure 3.8 except a mere 214 MW owned by independent parties. In a span of 15 years, the hydro capacity has risen from 4809 MW to 6733 MW, indicating an average increase of 128 MW per year. The figure indicates that the government is adamant in holding the hydro sector, as only around 3% of the capacity is owned by the independent parties. Before 2007, there was only one private hydro project in operation which is Jagran Dam of 30 MW installed capacity.
34
Nuclear Generation Capacity
Currently, the total installed capacity of nuclear is mere 787 MW. Not much development has been made in this sector since its introduction in 1972. Initially, only 137 MW of capacity was installed, which grew to 462 in 2001 when the CHASNUPP power plant was inaugurated. The latest development is the CHASNUPP Extension which provides another 325 MW summing the total to 787 MW.
Renewable Generation Capacity (Wind & Solar)
This sector is clearly yet to be exploited, as can be seen from figure 3.5. At this time, 235 MW of wind generation capacity is installed. This sector is under experimental phase, and might turn out to be one of the problem solvers for Pakistan’s energy problems. The Quaid-e-Azam solar park has a capacity of 1000 MW but it is yet to be operational. In
0% 10% 20% 30% 40% 50% 60% 70% 80% 90% 100% 1999 2000 2001 2002 2003 2004 2005 2006 2007 2008 2009 2010 2011 2012 2013 T o tal Hy d ro C ap ac ity (%) Public Private
35 2016, the total renewable capacity is to be increased to approximately 1500 MW according to the GOP.
3.4 Electricity Generation
Generation review is very much analogical to the installed capacity, which means that the main source of increase in power generation are the fossil fuels, while the hydro sector has remained pretty much unchanged since 1990. The historic power generation trend can be seen in figure 3.9. Detailed tabular data given in table C.4 in Appendix C. In the year 2014, 106,051 GWh of electricity was generated out of which 68,196 GWh was produced by thermal plants. The GOP has stopped issuing license for new natural gas power plants, which means that the oil industry will be further burdened and generation will continue to be expensive because of oil imports (GOP 2015).
Figure 3.9 Electricity generation, 1980-2014
0 20000 40000 60000 80000 100000 120000 1975 1980 1985 1990 1995 2000 2005 2010 2015 2020 E lectr icity Gen er atio n ( GW h )
36 The average increase of generation per year is 2681 GWh from 1980 to 2014. The general trend of total generation is an increasing one, other than the two crests in the year 1998 and 2009. This is not due to drop in installed capacity (which has been consistent or increasing in these years) but due to the low plant utilization factor observed in these years and lack of availability of fuel (NEPRA 2014). The total generation trend closely follows that of the thermal generation, indicating the close dependence. The thermal generation saw a slight drop in recent years due to the following reasons (NEPRA 2014):-
i) Shortage of locally harvested natural gas
ii) Increasing inefficiency in the public sector power plants iii) Non-operational units of the public sector power plants
Increase in power generation per year on average basis in the thermal sector is 1824 GWh, which is 68% of the total increase per year. The generation of hydroelectricity sector has seen less increase compared to thermal. The average increase per year is 704 GWh, which is 26% of the total increase of 2681 GWh. It can be seen that before 1989, more electricity was generated by hydro power compared to thermal. After this, the electricity structure of Pakistan started relying more on the fossil fuel based production which indicates that the government was more interested in quick solutions and short term planning rather than utilizing the indigenous hydro resource. In 2014, 32,673 GWh of electricity was produced by hydro plants which is 31% of the total generation.
The three nuclear power plants have not been a big impact on the total production statistics and produced 4501 GWh in 2014. The resources like wind and solar are yet to play a major role in the total energy mix, with a contribution of <1 GWh of generation (NEPRA 2014).
The shift from hydro based generation to thermal based can be seen in figure 3.10. Such major reliance on natural gas and oil is an alarming situation in current era, where prices are ever increasing.
37 The government has to re-route the system and balance this dependency between the other sources of generation. Building of major hydro plants is a major commitment and the GOP has clearly failed in doing so in the past two decades and hence bringing down the total share of hydro generation from 59% to 31% between 1980 and 2014.
The highest generation and the percentage share power plant-wise for the year 2014 is given as (percentages are of total generation):
i) Hydro (public): Tarbela Dam 15178 GWh (14.3%)
ii) Thermal (public GENCO): Thermal Power Station Muzaffargarh 5132 GWh (4.8%)
iii) Thermal (private IPPs): HUBCO Power Project 7086 GWh (6.7%) iv) Thermal (KESC): Bin Qasim Power Plant I&II 7405 GWh (7%) v) Nuclear (PAEC): CHASNUPP-II 2208 GWh (2.1%)
These five generators alone accounted for 35% of the total generation in 2014, indicating their vital importance in providing electricity to the country’s power grid. If any one of
Hydro 59% Thermal 41%
Generation by Source 1980
Hydro 31% Thermal 64% Nuclear 4%Generation by Source 2014
38 these generators may fail for one reason or the other, the country will face a major blackout until the error is fixed.
3.4.1 Fuel Consumption and Efficiency of Thermal Plants
This section will identify the amount of energy input, output and the overall costs involved in electricity generation. The data provided in the State of Industry Report 2014 by NEPRA contains data of only OPEX, which includes the operation costs only. By calculating energy input and output, an analysis on generation frequency is also provided in the coming sections.
Input Energy for Thermal Electricity Production
The discussion of primary fuels used to generate electricity including gas, oil and coal will be done in this section. The percentage of thermal installed capacity was 67% and generation 64% of the total in 2014. The statistics for different input fuels and their percentage shares are given in table 3.2.
Year Unit Gas Fuel Oil
Diesel
Oil Coal Total
2009 MTOE 7.83 7.21 0.17 0.05 15.26 %share 51.3 47.23 1.14 0.33 100 2010 MTOE 7.1 8.34 0.26 0.05 15.76 %share 45.08 52.9 1.67 0.36 100 2011 MTOE 6.49 7.83 0.1 0.43 14.47 %share 44.88 54.1 0.73 0.3 100 2012 MTOE 6.7 7.2 0.2 0.46 14.19 %share 47.45 50.8 1.43 0.33 100 2013 MTOE 7.08 7.34 0.22 0.28 14.67 %share 42.28 50.04 1.5 0.19 100
39 Table 3.2 shows the high input values of energy from gas and furnace oil which accounts to more than 92.32% in 2013. Although most of the electricity produced is by coal in most of the countries, in Pakistan it accounts to an insubstantial value. As for the annual growth of input energy, there is no specific trend. In 2011, the growth value dropped by 8.22% whereas the electricity produced was almost same as in the previous year. This indicates a possible decrease in losses, an improved generation efficiency or a combination of both and other key factors.
Figure 3.11 indicates that oil consumption has generally been consistent, except in the year 2010 during which electricity generation through thermal power was the highest in the history of Pakistan. The use of diesel oil is negligible compared to furnace oil and gas as there are very less generators which run on this type of fuel. There is only one coal powered generator which explains the small amount of coal used in the generation mix.
0 2000000 4000000 6000000 8000000 10000000 12000000 14000000 16000000 18000000 2009 2010 2011 2012 2013 In p u t Fu el E n er g y ( T OE )
Natural Gas Furnace Oil Diesel Oil Total
40 The consumption of gas is controlled by the government and is planned to reduce because of its increasing unavailability. Some IPP’s power plants for which the primary fuel was gas are urged to use the secondary fuel type which is diesel oil. The generation structure of the thermal sector is starting to be a less gas dependent one due to cancellation of further licenses for natural gas power plants and the government’s urge to use secondary fuel for IPP’s whose primary fuel is gas.
Output Electric Energy from Thermal Generation
The primary fuels including oil, gas and coal are directly converted to electricity by the power plants. Not all energy is converted to electricity, where heat is also a form of output. In some countries, this heat is sold for various purposes, but no such case has been seen in Pakistan. Corresponding to the inputs, the output follows the same trend, as shown in figure 3.12. Output generation from natural gas has decreased in recent years, while slightly increased from oil. Coal remains to be a negligible player in the output generation. The total output trend is almost consistent for the years between 2010 and 2014.
.
Table 3.3 Thermal output energy by fuel type (1GWh= 86.04 TOE), 2010-2014
Year Unit Gas FO + HSD Coal Total
2010 GWh 32557 35641 139 68337 TOE 2799398 3064574 11952 5875924 2011 GWh 36489 28571 109 65169 TOE 3137489 2456663 9372 5603524 2012 GWh 30162 35251 66 65479 TOE 2593465 3031040 5675 5630180 2013 GWh 28191 35804 40 64035 TOE 2423989 3078590 3439 5506018 2014 GWh 26790 41240 112 68142 TOE 2303525 3546001 9630 5859156