CAD Software Evaluation for Product Design
to Exchange Data in a Supply Chain Network
Zeki Ayağ
Industrial Engineering Department, Kadir Has University Kadir Has Campus, Cibali 34083, Fatih, Đstanbul, TURKEY
Abstract— The sharing information in a supply
chain environment, especially CAD models and drawings are so important companies. So, the selection of the most satisfying computer-aided design (CAD) software which enables to exchange data through supply chain network has been major issues for companies in a supply chain. The selection process of CAD software among the raising number of alternatives in the market has been very vital and critical issue for companies that aim to make their design and engineering related activities automated towards computer integrated manufacturing (CIM) environment. Therefore, most companies have used various methods to successfully carry out this difficult and time-consuming process. Of these methods, Analytic Hierarchy Process (AHP) has been widely used for Multiple Criteria Decision Making (MCDM) problems in both academic researches and practices. But, in some cases, due to the vagueness and uncertainty on judgments of the decision-maker(s), the crisp pair wise comparison in the conventional AHP seems to be insufficient and imprecise to capture the right judgments of decision-maker(s). Therefore, a fuzzy logic is introduced in the pair wise comparison of AHP to make up for this deficiency in the conventional AHP, called as fuzzy AHP. In this paper, a fuzzy AHP-based approach is proposed to evaluate a set of CAD software alternatives in the market to reach the best satisfying one based on the needs of company.
Keywords—Supply chain management; Computer-aided
design; multiple-criteria decision making; fuzzy logic; analytic hierarchy process.
1.
Introduction
Supply chain management (SCM) is a process of integrating/utilizing suppliers, manufacturers, warehouses, and retailers, so that goods are produced and delivered at the right quantities, and at the right time, while minimizing costs as well as satisfying customer requirements. A supply chain is a dynamic and stochastic system. The performance of any particular participant in a supply chain
depends to a large extent on the behavior of other participants. Optimizing the performance of each participant is important, but for improving the overall performance of a supply chain, it is necessary to view the system as a whole. This makes supply chain management very complicated as given the studies in literature as follows; Ref. [1] proposed a novel fuzzy multiple-criteria decision making model for sustainable supplier selection with incomplete information. Ref. [2] used a simulation based fuzzy TOPSIS approach for group supplier selection problem in a supply chain management environment. Ref. [3] also applied decision making methods for supplier selection problem. Ref. [4] used fuzzy QFD approach to determine supply chain management strategies in the dairy industry. Ref. [5] proposed an intelligent approach to prioritize logistics requirements in food industry. In addition, the sharing information in a supply chain environment, especially CAD models and drawings are so important companies. So, the selection of the most satisfying CAD software which enables to exchange data through supply chain network has been major issues for companies in a supply chain.
Computer-aided design (CAD) as critical module of a computer integrated manufacturing (CIM) system is an interaction of human and machine, working together to optimize design and manufacture activities of products in product development environment (PDE). Computers enable designers to graphically test their ideas in real-time without having to create physical prototypes. This advantage reduces engineering teat costs for any company and also results in products getting to market much faster. Non-technical team members from management to marketing of a company can work side-by-side with engineers to view, discuss, modify, and document a design in progress. This is an effective way of innovative designing in a product development environment. CAD systems also enable more via engineering analysis and a larger number of design alternatives to be investigated, saving time by minimizing of critical mistakes early in the design process.
As one of the MCDM techniques, in the conventional AHP method developed by Ref. [6], the pair wise comparisons for each level with respect to the goal of the best alternative selection are conducted using a nine-point scale. This ______________________________________________________________
International Journal of Supply Chain Management IJSCM, ISSN: 2050-7399 (Online), 2051-3771 (Print)
application of Saaty’s AHP has some shortcomings as follows; i) the AHP method is mainly used in nearly crisp decision applications, ii) the AHP method creates and deals with a very unbalanced scale of judgment, iii) the AHP method does not take into account the uncertainty associated with the mapping of one’s judgment to a number, iv) the ranking of the AHP method is rather imprecise, v)the subjective judgment, selection and preference of decision-makers have great influence on the AHP results. Naturally, if the AHP method is used in CAD software selection, decision maker (s) requirements for evaluating a set of possible alternatives may always contain ambiguity and multiplicity of meaning. Furthermore, it is also recognized that human assesment on qualitative attributes is always subjective and thus imprecise. Due to the vagueness and uncertainty on judgments of the decision-maker(s), the crisp pair wise comparison in the conventional AHP seems to insufficient and imprecise to capture the right judgments of decision-maker(s). Therefore, a fuzzy logic is introduced in the pair wise comparison of AHP to make up for this deficiency in the conventional AHP, called as fuzzy AHP. In this paper, a fuzzy AHP-based approach is proposed to evaluate a set of CAD software alternatives in the market to reach the best satisfying one based on the needs of company. Furthermore, in last section, as a case study, this approach was applied to a manufacturing organization of a leading cutting tool manufacturer in Turkey, which designs and manufactures all kinds of standard, semi-custom and custom cutting tools for various markets in-home land, as well as other parts of the world in order to prove its applicability on a real-life system.
2.
Related Research
Supply chain systems provide one of the most important applications of multiple-criteria decision making. It has been used successfully as an aid in evaluating the design options of new production facilities, warehouses, and distribution centers. The fuzzy set theory is a mathematical theory designed to model the vagueness or imprecision of human cognitive processes that pioneered by Ref. [7]. This theory is basically a theory of classes with unsharp boundaries. What is important to recognize is that any crisp theory can be fuzzified by generalizing the concept of a set within that theory to the concept of a fuzzy set [8]. Fuzzy set theory and fuzzy logic have been applied in a great variety of applications, which are reviewed by several authors [9, 10].Within the broad scope of the applications of fuzzy set theory, engineering design emerges as an important activity in today’s organizations that has lacked tools that manage the great amount of imprecise information that is usually encountered. AHP method was first developed for decision
making by Ref. [6] and extended by Ref. [11] who have developed a more specific method directly for design decision-making. The Marsh’s AHP has 3 steps ordering the factors (i.e. attributes) of a decision such that the most important ones receive greatest weight. Ref. [12] provided an extensive list of references on the AHP methodology and its applications.
Because of the accuracy of the fuzzy AHP method in the decision making process, it has been applied to many different areas. Here, some of its applications realized in various engineering fields are presented due to the fact that they are inspired how to use the fuzzy AHP in CAD software selection. Ref. [13] used fuzzy AHP to select the best supplier firm providing the most satisfaction for the attributes determined. Ref. [14] developed a decision support system using the fuzzy AHP to locate new convenience store. Ref. [15] presented a fuzzy version of AHP to country risk assessment problem. Ref. [16] developed an analytical tool using fuzzy AHP to select the best catering firm providing the most customer satisfaction. Ref. [17] used a fuzzy extension of the AHP for project selection and focused on the constraints that have to be considered within fuzzy AHP in order to take in account all the available information. Ref. [18] evaluated alternative production cycles using the extended fuzzy AHP method. Ref. [19] proposed a fuzzy AHP approach in modular product design complemented with a case example to validate its feasibility in a real company. Ref. [20] also presented an integrated approach to evaluating conceptual design alternatives in a new product development (NPD) environment. Ref. [21] used fuzzy group decision making to evaluate CIM system alternatives. Ref. [22] used group decision support system (GDSS) for a real-life CAD-system selection application for an industrial company. Ref. [23] developed an AHP-based simulation model for implementation and analysis of computer-aided systems. Ref. [24] evaluated weapon system by AHP based on fuzzy scales.
3.
Proposed Approach
In this study, a fuzzy AHP-based approach to CAD software selection is proposed using the AHP of Ref. [6] and fuzzy logic of Ref. [8] because of the reasons as follows; (1) The AHP method is selected because it consists of a systematic approach based on breaking the decision problem into a hierarchy of interrelated elements. The evaluation of selection attributes is done by using a scaling system showing that each attribute is related with another. This scaling process is then converted to priority values to compare alternatives. It is very useful tool to define problem structure. The AHP
technique is selected, on one hand, because it integrates quantative and qualitative factors and, on the other, in view of the significant number of applications already developed in similar decision contexts [25], (2) Fuzzy logic is integrated with the Saaty`s AHP: Due to the vagueness and uncertainty on judgments of the decision-maker(s), the crisp pair wise comparison in the conventional AHP seems to insufficient and imprecise to capture the right judgments of decision-maker(s). To overcome the inability of AHP to handle the imprecision and subjectiveness in the pair wise comparison process, Buckley and van Laarhoven and Pedrycz extended Saaty’s AHP [26]. Triangular or trapezoidal fuzzy numbers are used to express the decision maker’s assessments on alternatives with respect to each attribute. After the attributes are weighted, the overall utilities of alternatives, known as fuzzy utilities (represented by fuzzy numbers), are aggregated by fuzzy arithmethic using simple additive weighting method. To prioritize the alternatives, their fuzzy utilities need to be compared and ranked. Then, the attributes and alternatives for CAD software selection are defined next.
A. Defining Attributes and Alternatives
The first step in justifying a CAD system for a company is to identify what the company truly needs. Standards, personnel, and procedures may need to be redefined with a system selection, so identification becomes critical. A company must also analyze the system life cycle. The system life cycle continues to grow shorter due to new technological advances occurring rapidly. In many cases, time becomes the number one constraint. How long a system may be used and how quickly it can be utilized are a few important questions that must be asked and the answers of which can have a profound impact on selection. A cross functional committee should select the system in order to provide interdepartmental feedback that will help support the final decision. Representatives from every department should have input in order to fully define needs, and also to maximize all possible benefits. In literature, there are many criteria that have been defined for selection process of CAD systems realized in different application areas. In this study, several criteria are addressed in selecting the best CAD system for manufacturing companies as follows; System cost, Ease of Use, Compatibility, Efficiency and effectiveness, Concurrent engineering (CE), Updating: Added Features, Technical support and service. As to determining alternatives for a planned CAD system for a company, some sources such as vendors, applications in literature, personnel experiences and so on are utilized to create a list of possible
alternatives. Then, a cross-functional committee consisting of personnel from related departments of company reduces this list to reasonable number of alternatives based on the needs of company. In next section, fuzzy AHP and its steps are presented more in detail.
B. Fuzzy AHP
Fuzzy representation of pair wise comparison: Firstly, the hierarchy of CAD selection should be established. After constructing this hierarchy, the decision maker is asked to compare the elements at a given level on a pair wise basis to estimate their relative importance in relation to the element at the immediate proceeding level. In conventional AHP, the pair wise comparison is made using a ratio scale. A frequently used scale is the nine-point scale [27] which shows the participants` judgments or preferences among the options such as equally important, moderately more important, strongly more important, very strongly more important, and extremely more important preferred. Even though the discrete scale of 1-9 has the advantages of simplicity and easiness for use, it does not take into account the uncertainty associated with the mapping of one’s perception or judgment to a number.
The key idea of fuzzy set theory is that an element has a degree of membership in a fuzzy set [28, 10]. A fuzzy set is defined by a membership function (all the information about a fuzzy set is described by its membership function). The membership function maps elements (crisp inputs) in the universe of discourse (interval that contains all the possible input values) to elements (degrees of membership) within a certain interval, which is usually [0, 1]. Then, the degree of membership specifies the extent to which a given element belongs to a set or is related to a concept. The most commonly used range for expressing degree of membership is the unit interval [0, 1]. If the value assigned is 0, the element does not belong to the set (it has no membership ). If the value assigned is 1, the element belongs completely to the set (it has total membership). Finally, if the value lies within the interval [0, 1], the element has a certain degree of membership (it belongs partially to the fuzzy set). A fuzzy set, then, contains elements that have different degrees of membership in it. In this study, triangular fuzzy numbers,
~
1
to ~9
, are used to represent subjective pair wise comparisons of selection process (equal to extremely preferred) in order to capture the vagueness (table 2). A fuzzy number is a special fuzzy set( )
(
)
{
x x x R}
the real line,
R :
−∞
<
x
<
+∞
andµ
F( )
x
is a continuous mapping from R to the closed interval [0, 1]. A triangular fuzzy number denoted asM
(
l
,
m
,
u
)
~
=
, wherel
≤
m
≤
u
, has the following triangular type membership function;0 x<l
µ
F( )
x
=
l m l x − − l≤x≤m m u x u − − m≤x≤uAlternatively, by defining the interval of confidence level
α
, the triangular fuzzy number can be characterized as;] 1 , 0 [ ∈ ∀
α
[
l u]
[
(
m l)
l(
u m)
u]
Mα = α, α = −α
+ ,− −α
+ ~Some main operations for positive fuzzy numbers are described by the interval of confidence, by Ref. [29] as given below;
[
,]
,[
,]
,[ ]
0,1 , , , , ~ ~ ∈ = = ∈ ∀ + α α α α α α α L R L R R L R L m n n R M m m N n n m[
α α α α]
R R L L n m n m N M⊕ = + , + ~ ~[
α α α α]
R R L L n m n m N MΘ = − , − ~ ~[
α α α α]
R R L Ln m n m N M , ~ ~ = ⊗[
α α α α]
R R L Ln
m
n
m
N
M
/
/
,
/
~ ~=
The triangular fuzzy numbers (TFNs), ~
1
to ~9
, are utilized to improve the conventional nine-point scaling scheme. In order to take the imprecision of human qualitative assessments into consideration, the five TFNs ( ~1
, ~3
, ~5
, ~7
, ~9
) are defined with the corresponding membership function.C. Steps of Fuzzy AHP Approach
The AHP method is also known as an eigenvector method. It indicates that the eigenvector corresponding to the largest eigenvalue of the pair wise comparisons matrix provides the relative priorities of the factors, and preserves ordinal preferences among the alternatives. This means that if an alternative is preferred to another, its eigenvector component is larger than that of the
other. A vector of weights obtained from the pair wise comparisons matrix reflects the relative performance of the various factors. In the fuzzy AHP triangular fuzzy numbers are utilized to improve the scaling scheme in the judgment matrices, and interval arithmetic is used to solve the fuzzy eigenvector [24]. The four-step-procedure of this approach is given as follows; Step 1: Comparing the performance score: TFNs are used to indicate the relative strength of each pair of elements in the same hierarchy. Step 2: Constructing the fuzzy comparison matrix: By using TFNs, via pair wise comparison, the fuzzy judgment matrix
~
A
( )
a
ij is constructed as given below; = 1 .. .. .. .. .. .. .. .. .. .. .. .. .. .. 1 .. .. 1 ~ 2 ~ 1 ~ 2 ~ 21 ~ 1 ~ 12 ~ n n n n a a a a a a A where,1
~=
α ija
, if i is equal j , and=
~ α ija
1
~, ~3
, ~5
, ~7
, ~9
or 1 ~1
− , 1 ~3
− , 1 ~5
− , 1 ~7
− , 1 ~9
− , if i is not equal jStep 3.Solving fuzzy eigenvalue: A fuzzy eigenvalue,
~
λ
, is a fuzzy number solution to; ~ ~x
A
= ~ ~x
λ
(1) where is n x n fuzzy matrix containing fuzzy numbers~ ij
a
and ~x
is a non-zero n x 1, fuzzy vector containing fuzzy numberx
i~
. To perform fuzzy multiplications and additions by using the interval arithmetic and
α
−
cut
, the equation~ ~
x
A
= ~ ~x
λ
is equivalent to;[
α α α α]
[
α α α α] [
λ α λ α]
iu il nu inu nl inl u u i l l i x a x a x a x x x a1 1 , 1 1 ⊕...⊕ , = , where,=
~A
~ ~,
t ijx
a
= . ~ ~ 1,....,xn x ,[
α α]
α[
α α]
α[
α α]
αλ
λ
λ
l u iu il i iju ijl ija
a
x
x
x
a
,
,
,
,
,
~ ~ . ~=
=
=
(2)cut
−
α
is known to incorporate the experts or decision maker(s) confidence over his/her preference or the judgments. Degree of satisfaction for the judgment matrix~
A
is estimated by the index of optimismµ
. The larger value of indexµ
indicates the higher degree of optimism. The index of optimism is a linear convex combination [30], and defined as;(
1
)
,
~ α α αµ
µ
ijl iju ija
a
a
=
+
−
∀µ
∈[ ]
0,1 (3) Whileα
is fixed, the following matrix can be obtained after setting the index of optimism,µ
, in order to estimate the degree of satisfaction. = 1 .. .. .. .. .. .. .. .. .. .. .. .. .. .. 1 .. .. 1 ~ 2 ~ 1 ~ 2 21 ~ ~ 1 ~ 12 ~ α α α α α n n n n a a a a a a A
The eigenvector is calculated by fixing the
µ
value and identifying the maximal eigenvalue. Normalization of both the matrix of paired comparisons and calculation of priority weights (approx. attribute weights), and the matrices and priority weights for alternatives are also done before calculatingλ
max. In order to control the result of the method, the consistency ratio for each of the matrices and overall inconsistency for the hierarchy calculated. The deviations from consistency are expressed by the following equation consistency index, and the measure ofinconsistency is called the consistency index (CI);
1 max − − = n n CI λ (4)
The consistency ratio (CR) is used to estimate directly the consistency of pair wise comparisons. The CR is computed by dividing the CI by a value obtained from a table of Random Consistency Index (RI);
RI CI
CR= (5)
If the CR less than 0.10, the comparisons are acceptable, otherwise not. RI is the average index for randomly generated weights [6].
Step 4.The priority weight of each alternative: It can be obtained by multiplying the matrix of evaluation ratings by the vector of attribute weights and summing over all attributes. Expresses in conventional mathematical notation [6];
Weighted evaluation for alternative:
(
)
∑
= = t i ik ixevaluationrating eight attributew k 1 (6)for i=1,2,..,t ( t : total number of attributes ). After calculating the weight of each alternative, the overall consistency index is calculated to make sure that it is smaller than 0.10 for consistency on judgments.
4.
Case Study
Above, a fuzzy AHP-based approach has been presented to evaluate a set of CAD software alternatives in the market. In this section, a case study was realized to prove its applicability and validity in order to make this approach more understandable and clearer for everyone. Therefore, a manufacturing system of a leading cutting tool manufacturer in Turkey, which designs and manufactures all kinds of standard, semi-custom and custom cutting tools (i.e. twist drills, reamers, taps, nuts, carbide-tipped tool holders, center drills, masonry drills) for national and international markets, was taken into consideration here. First, a list of possible alternatives in the market was done and roughly evaluated to eliminate extreme those. Then, the remaining alternatives were evaluated for further study, the fuzzy AHP analysis. This short list has five different alternatives more commonly used for mechanical design and engineering purposes in national and international platforms. These alternatives are CATIA, Pro-Engineer, AutoCAD, Unigraphics and I-DEAS Master Series. Secondly, seven critical attributes (i.e. system cost, data exchange capability among suppliers through internet, compatibility with existing systems, efficiency and effectiveness in supply chain network, concurrent engineering with other suppliers, updating: added feature and technical support and service) were defined to evaluate the alternatives using the fuzzy AHP method. In applying the fuzzy AHP, first the fuzzy comparison matrices using TFNs were constructed to weight the criteria, as shown in Table 1. Secondly, the fuzzy comparison matrix for five CAD alternatives
with respect to the first attribute-System cost (A1) using TFNs was built and shown in Table 2.
Table 1.The fuzzy comparison matrix for criteria using TFNS Attribute A1 A2 A3 A4 A5 A6 A7 A1 1 ~ 1 ~ 7 ~ 5 ~9 ~1 ~ 7 A2 1 ~ 3 ~1 ~ 3 ~ 3 ~ 7 A3 1 ~ 1 ~ 3 ~ 1 7− ~
3
A4 1 ~5
~ 1 3− ~ 5 A5 1 ~ 1 5− ~3
A6 1 ~ 9 A7 1Table 2.The fuzzy comparison matrix for 5 CAD alternatives with respect to the first
attribute-Systems Cost (A1) using TFNS Alt. No. 1 2 3 4 5 1 1 ~
3
~3
~5
~9 2 1 ~ 1 ~3
~9 3 17
~7
~ 4 13
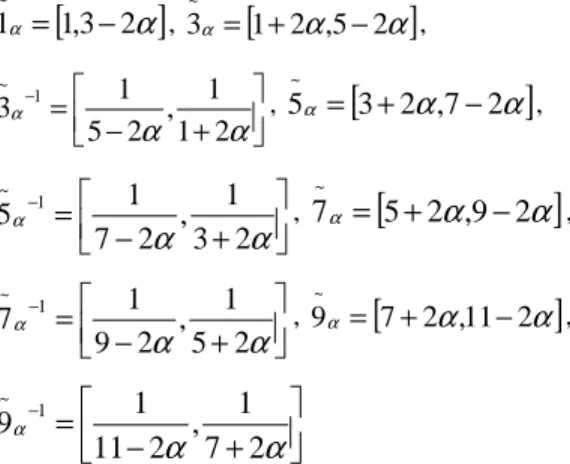
~ 5 1The lower limit and upper limit of the fuzzy numbers with respect to the
α
were defined as follows by applying (2);[
α
]
α 1,3 2 1 ~ − = , 3α[
1 2α,5 2α]
~ − + = , + − = − α α α 2 1 1 , 2 5 1 3 1 ~ , 5α[
3 2α
,7 2α
]
~ − + = , + − = −α
α
α 2 3 1 , 2 7 1 5 1 ~ , 7α[
5 2α
,9 2α
]
~ − + = , + − = −α
α
α 2 5 1 , 2 9 1 7 1 ~ , 9α[
7 2α,11 2α]
~ − + = , + − = −α
α
α 2 7 1 , 2 11 1 9 1 ~Then, we substituted the values,
α
=
0
.
5
and5
.
0
=
µ
above expression into fuzzy comparison matrices, and obtained all theα
−
cuts
fuzzy comparison matrices (Table 3-4) (Equation (3) was used to calculate eigenvectors for all comparison matrices);Table 3.The
α
−
cuts
fuzzy comparison matrix for α=0.5 Att. A2 A3 A4 A5 A6 A7 A1 1 [1, 2] [6, 8] [4, 6] [8, 10] [1, 2] [6, 8] A2 1 [2, 4] [1, 2] [2, 4] [2, 4] [6, 8] A3 1 [1, 2] [2, 4] [1/8, 1/6] [2, 4] A4 1 [4, 6] [1/4, 1/2] [4, 6] A5 1 [1/6, 1/4] [2, 4] A6 1 [8, 10] A7 1Table 4.The
α
−
cuts
fuzzy comparison matrix for 5 CAD alternatives with respect to the firstattribute-Systems Cost (A1) using TFNS Alt. No. 1 2 3 4 5 1 1 [2, 4] [2, 4] [4, 6] [8, 10] 2 1 [1, 2] [2, 4] [8, 10] 3 1 [6, 8] [6, 8] 4 1 [2, 4] 5 1
Let
FCM
10.5=
A
1, the matrix of pair wise comparison of the alternatives with respect to the first attribute, system cost (FCM1). We first calculated eigenvalue of the matrix A1 by solving the characteristic equation ofA1
det
(
A
1−
λ
I
)
=
0
. Then we calculated allλ
values for A1 (λ
1,
λ
2,
λ
3,
λ
4,
λ
5). The largest eigenvalue of matrixFCM
10.5,
λ
maxwas calculated to be 5.438. The dimension of the matrix, n, is 5 and the random index,RI
( )
n
is 1.12 (RI-function of the number of attributes, [1]). Therefore, we calculated the consistency index and the consistency ratio of the matrix using (4) and (5) as follows (λ
max, is the largest, 5.438 by using the data in Table 5);1
max−
−
=
n
n
CI
λ
= 0.109 4 5 438 . 5 − = , RI CI CR= = 0.098 12 . 1 109 . 0 = = < 0.100Table 5.The eigenvector for comparison matrix for 5 CAD alternatives with respect to the first
attribute-Systems Cost (A1) using TFNS
Alt. No. 1 2 3 4 5 Priority Vector 1 1.000 3.000 3.000 5.000 9.000 0.438 2 1.000 1.500 3.000 9.000 0.225 3 1.000 7.000 7.000 0.233 4 1.000 3.000 0.072 5 1.000 0.032 max
λ
5.438 CI 0.109 CR 0.098We also calculated the consistency ratios for all matrices and found out that they were less than 0.10. As the result of this calculation, we proved the consistency of the judgments in each comparison matrix was acceptable. Similarly, for the matrix,
FCM
00.5=
A
0, we first calculated the matrix of pair wise comparisons of attributes for each level. Then, we calculated eigenvalue of the matrix A0 as follows by solving the characteristic equation of A0,det
(
A
0−
λ
I
)
=
0
, and then we calculated allλ
values for A0 (λ
1,
λ
2,...
λ
7)(Table 6).As the value of
λ
3is the largest, we calculated the corresponding eigenvectors of A0 as follows by substituting theλ
3into the equation,0 0 0
0
X
X
A
=
λ
, and found out X0 vector.Then, we calculated
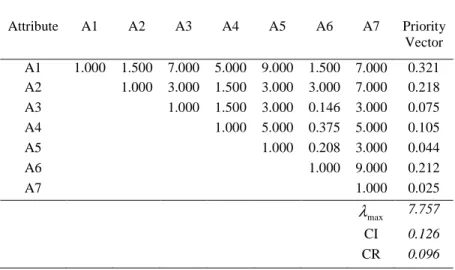
λ
max =7.757, CI=0.126 =(7.757-7)/6, RI=1.32 and CR as 0.096, was less than 0.10., and we saw the consistency of the judgments in the comparison matrix was acceptable.
Finally, we obtained the final weights (or scores) of 5 alternatives with respect to the goal by using (6), and found the first alternative with the highest weight, CATIA is the best one among the others. In addition, we calculated the overall consistency
index to make sure that it was smaller than 0.10 for consistency on all judgments (Table 7).
5.
Conclusions
In this paper, we focused on the selection of the most satisfying CAD system to be used for product design, which enables to exchange data and related information sharing (i.e., CAD models, blueprints, and drawings) among a series of companies in a supply chain network. Therefore, a fuzzy AHP approach was developed to evaluate a set of CAD software alternatives in terms of evaluation criteria, where two popular techniques, fuzzy logic and the AHP methods were used effectively together. Defining attributes used in the fuzzy AHP method was very critical due to the fact that the fuzzy AHP needs well-defined attributes based on the needs of companies during evaluation process.
The designers or managers as the part of a cross-functional team in companies aiming to be the successful part of a supply chain network in terms of product design data exchange can easily utilize this proposed model. Also, for motivation of the team and its members, the middle and top level management of company, especially from the departments of IT and engineering should give enough support for the success of the study. In future research, a knowledge-based system (KBS) or expert system (ES) can be adapted to this approach to interpret the outputs of the fuzzy AHP automatically via a user interface. A KBS or ES creates a rule-based database to interpret the results and makes its comments using an inference engine, and presents them to the user when needed.
Table 6.The eigenvector for comparison matrix of criteria Attribute A1 A2 A3 A4 A5 A6 A7 Priority Vector A1 1.000 1.500 7.000 5.000 9.000 1.500 7.000 0.321 A2 1.000 3.000 1.500 3.000 3.000 7.000 0.218 A3 1.000 1.500 3.000 0.146 3.000 0.075 A4 1.000 5.000 0.375 5.000 0.105 A5 1.000 0.208 3.000 0.044 A6 1.000 9.000 0.212 A7 1.000 0.025 max
λ
7.757 CI 0.126 CR 0.096Table 7.The final ranking of CAD software alternatives
Alternative No. A1 (0.321) A2 (0.218) A3 (0.075) A4 (0.105) A5 (0.044) A6 (0.212) A7 (0.025) Overall Priority Vector 1* 0.438 0.440 0.406 0.397 0.510 0.448 0.384 0.436* 2 0.225 0.347 0.314 0.338 0.278 0.261 0.266 0.281 3 0.233 0.096 0.133 0.150 0.088 0.187 0.250 0.171 4 0.072 0.076 0.089 0.063 0.078 0.065 0.063 0.072 5 0.032 0.041 0.058 0.052 0.046 0.039 0.037 0.040 CR 0.098 0.072 0.073 0.091 0.093 0.064 0.062
References
[1] G. Buyukozkan, G. Cifci, “A novel fuzzy multi-criteria decision framework for sustainable supplier selection with incomplete information”, Computers in Industry, Vol.62, pp. 164-174, 2011.
[2] A. Zouggari, L. Benyoucef, “Simulation based fuzzy TOPSIS approach for group multi-criteria supplier selection problem”, Engineering Applications of Artificial Intelligence, Vol.25, pp. 507–519, 2012. [3] J. Chai, J.N.K. Liu, “Application of
decision-making techniques in supplier selection: A systematic review of literature”, Expert Systems with Applications, Vol.40, pp. 3872-3888, 2013.
[4] Z. Ayag, F. Samanlioglu, G. Buyukozkan, “Fuzzy QFD approach to determine supply chain management strategies in the dairy
industry”, Journal of Intelligent Manufacturing, Vol.24, pp. 1111-1122, 2013. [5] Z. Ayag,“An intelligent approach to prioritize logistics requirements in food industry”, International Journal of Supply Chain Management, Vol.3, pp. 29-38, 2014. [6] T.L. Saaty, The Analytical Hierarchy Process,
McGraw Hill: New York, 1981.
[7] F.A. Lootsma, Fuzzy Logic for Planning and Decision Making, Dordrecht: Kluwer Academic Publisher, 1997.
[8] L.A. Zadeh, “Fuzzy logic, neural network, and soft computing”, Communacitions of the ACM, Vol.37, pp.77-84, 1994.
[9] G.J. Klir, B. Yuan, Fuzzy Sets and Fuzzy Logic: Theory and Applications, 1995. [10] H.J. Zimmermann, Fuzzy Set Theory and Its
Applications, Massachusetts: Kluwer Academic Publisher, 1996.
[11] S. Marsh, J.V. Moran, S. Nakui, G. Hoffherr, Facilitating and training in quality function deployment, Methuen, MA:GOAL/QPC, 1991.
[12] F. Zahedi, “The Analytic Hierarchy Process: A Survey of the Method and Its Application”. Interfaces, Vol.16, pp.96-108, 1986.
[13] C. Kahraman, U. Cebeci, Z. Ulukan, “Multi-criteria supplier selection using fuzzy AHP”, Logistics Information Management, Vol.16, 382-394, 2003.
[14] R.J. Kuo, S.C., Chi, S.S.Kao,“A decision support system for selecting convenience store location through integration of fuzzy AHP and artificial neural network”, Computers in Industry, Vol.47, pp.199-214, 2002.
[15] M.B. Murtaza, “Fuzzy-AHP application to country risk assessment”, American Business Review, Vol.21, pp.109-116, 2003.
[16] C. Kahraman, U. Cebeci, D. Ruan, “Multi-attribute comparison of catering service companies using fuzzy AHP: The case of Turkey”, International Journal of Production Economics, Vol.87, pp.171-184, 2004. [17] M. Enea, T. Piazza, “Project selection by
constrained fuzzy AHP”, Fuzzy Optimization Decision Making, Vol.3, pp.39-62, 2004. [18] M. Weck, F. Kloche, H. Schell, E. Ruenauver,
“Evaluating alternative production cycles using the extended fuzzy AHP method”, European Jornal of Operations Research, Vol.100, pp.351-366, 1997.
[19] W.B. Lee, H. Lau, Z.Z. Liu, S. Tam, “A fuzzy analytic hierarchy process approach in modular product design”, Expert Systems, Vol.18, pp.32-42, 2001.
[20] Z. Ayag, “An integrated approach to evaluating conceptual design alternatives in a new product development environment”, International Journal of Production Research, Vol. 43, pp.687-713, 2005.
[21] C.E, Bozdağ, C. Kahraman, D. Ruan, “Fuzzy group decision making for selection among computer integrated manufacturing systems”, Computers in Industry, Vol.51,pp.13-29, 2003.
[22] P. Piippo, M. Torkkeli, M. Tuominen, “Use of GDSS for selection of technology: new integrated CAD-system for an entire company", International Conference on the Management of Engineering and Technology (PICMET '99), Portland, USA, 25-29 July, 1, p. 13, 1999.
[23] Z. Ayag, “An analytic-hierarchy-process simulation model for implementation and analysis of computer-aided systems”, nternational Journal of Production Research, Vol.40, pp.3053-3073, 2002.
[24] C.H. Cheng, D.L. Mon, “Evaluating weapon system by analytic hierarchy process based on fuzzy scales”. Fuzzy Sets and Systems, Vol.63, pp.1-10, 1994.
[25] E. Cagno, F. Caron, A. Perego, “Competitive bidding: a multi-criteria approach to assess
the probability of winning”, Deuxieme Congress International Franco-Quebecois de Genie Industrie – ALBI, 1997.
[26] H. Deng, “Multi criteria analysis with fuzzy pairwise comparison”, International Journal of Approximate Reasoning, Vol. 21, pp.215-231, 1999.
[27] T.L. Saaty, “How to make a decision: the analytic hierarchy process”, European Journal of Operetions Research, Vol.48, pp.9-26, 1990.
[28] C.V. Negoita, Expert Systems and Fuzzy Systems. Menlo Park, California: The Benjamin/ Cummings, 1985.
[29] A. Kaufmann, M.M. Gupta, “Introduction to fuzzy arithmetic: theory and applications”, New York: Van Nostrand Reinhold, 1985. [30] A.R. Lee, “Application of modified fuzzy AHP
method to analyze bolting sequence of structural joints”. UMI Dissertation Services, A Bell & Howell Company, 1999.