INTERNATİONAL JOURNAL OF AGRİCULTURE &BİOLOGY
ISSN Print: 1560–8530; ISSN Online: 1814–9596 10–164/DJZ/2010/12–4–611–615
http://www.fspublishers.org
Full Length Article
Use of Factor Scores in Multiple Regression Analysis for
Estimation of Body Weight by Several Body Measurements in
Brown Trouts (Salmo trutta fario)
ECEVIT EYDURAN1,MEHMET TOPAL† AND ADEM YAVUZ SONMEZ‡
Igdir University, Faculty of Agriculture, Department of Animal Science, 76000, Igdir, Turkey
†Atatürk University, Faculty of Agriculture, Department of Animal Science, 25240, Erzurum, Turkey ‡Atatürk University, Faculty of Agriculture, Department of Aquaculture, 25240, Erzurum, Turkey 1Corresponding author’s e-mail: [email protected]
ABSTRACT
This study was conducted to estimate body weight from several biometrical traits viz. total and fork lengths, body height, head length, adipose fin width and adipose fin length of Salmo trutta fario trouts. A sample of 140 Salmo trutta fario trouts (70 male & 70 female) was used in this investigation. First, only multiple regression analyses were applied to the data on each gender that caused to multicollinearity problem. In order to eliminate multicollinearity problems, multiple regression analysis after factor analysis was used for each fish gender data. Thus the problems were removed by using factor scores in multiple regression analyses. Kaiser-Meyer-Olkin (KMO) measure of sampling adequacy and Bartlett’s test of sphericity were used to prove whether factor analysis was appropriate for analysis of both genders. According to these two criteria, the data were fit for application of factor analysis. Three factors with eigenvalues greater than one were selected as independent variables for multiple regression analysis. It was concluded that fish body weight increased when total length, fork length, body height, head length, adipose fin width and length increased. Use of biometrical measurements such as total and fork lengths body height, head length, adipose fin width and length for breeding purposes might provide valuable information on improvement of body weight. © 2010 Friends Science Publishers
Key Words: Factor analysis; Varimax rotation; Multicollinearity; Multiple regression analysis; Salmo trutta fario trouts
INTRODUCTION
Knowledge on the relationships among body weight and several body measurements is essential for fish breeding. These biometrical measurements, influenced by genetic and environmental factors, may be used as indirect selection criteria in order to determine the suitability of fish for selection. These relationships may present substantial information on early selection of the fish for breeding.
To determine complex multivariate relationships, estimation of Pearson correlations between biometrical traits and body weight and estimation of body weight from these body measurements using only multiple regression analysis may be insufficient. Interpretation of results obtained from multiple regression analysis may be inaccurate in consequence of multicollinearity problem. However, factor scores for multiple regression models are used to eliminate multicollinearity problem. Multiple regression analysis, after factor analysis, is applied for available data.
Factor analyses are used to reduce a large number of observed variables to a smaller number of factors and to provide an operational definition (regression equation) for an underlying process by observed variables. Factor scores
are nearly uncorrelated. Hence the use of factor scores as the variables in other analyses is possible and may be very helpful (Tabachnick & Fidell, 2001). In small ruminants, few reports on using factor scores for multiple regression analysis were found (Riva et al., 2004; Keskin et al., 2007a & b; Eyduran et al., 2009), whereas there was only a report on combining factor analysis and multiple regression analysis in fishery science (Sangun et al., 2009). However, no reported information on using factor scores in multiple regression analysis for predicting weight of brown trouts (Salmo trutta fario) from different biometrical traits was found.
The aim of this study is to estimate body weight from several body measurements (total & fork lengths, body height, head length, adipose fin length & width) in brown trouts (Salmo trutta fario). Here factor scores in multiple regression analysis were used to obtain an accurate estimation function from available data.
MATERIALS AND METHODS
Biometrical characteristics i.e., total (TL) and fork lengths (FL), body height (BH), head (HL) and adipose fin
EYDURAN et al. / Int. J. Agric. Biol., Vol. 12, No. 4, 2010
lengths (AFL), adipose fin width (AFW) and body weight (BW) of brown trouts (Salmo trutta fario) raised in Erzurum conditions were used in this study. Measurements of the biometrical characteristics belonging to a sample of 140 fish (70 male and 70 female) on four-year-old brown trouts were used. To obtain biometrical measurements, fish were made unconscious using MS222 anesthesia. Total and fork lengths, body height, head length (HL) (cm), adipose fin width and length values of fish were measured by compass and body weight were taken with a weighing balance.
Multiple regression analysis for each gender was used to estimate body weight from body measurements. Factor scores obtained from factor analysis were used for multiple regression analysis in order to eliminate multicollinearity problem. Independent variables (body measurements) were exposed to Factor analysis and factor scores from factors with eigen values greater than one were considered as independent variables in multiple regression analysis. Fish body weights were standardized as a dependent variable. Finally multiple regression analysis was used for standardized body weight and factor scores. Kolmogorov-Simirnov normality test was applied for dependent variable and independent variables. All these variables were normally distributed. Factor analysis was performed using seven body measurements to rank their relative significance and describe possible patterns of interrelationship with regards to body weight.
The factor analysis equation can be written in matrix form:
Z = λF + ε
Where Z is a px1 vector of variables, λ is a pxm matrix of factor loadings, F is an mx1 vector of factors and ε is a px1 vector of error or residual factors (Sharma, 1996). Because of differences in the units of variables used in factor analysis, the variables were standardized and a correlation matrix of variables was used to obtain eigenvalues. In order to facilitate interpretation of factor loadings (Lik), VARIMAX rotation was used. Factor coefficients (Cik) were used to obtain factor scores for selected factors. Factors with eigenvalues greater than one were employed in multiple regression analysis (Eyduran et
al., 2009).
The suitability of factor analysis was determined by two criteria viz. Kaiser-Meyer-Olkin (KMO) measure of sampling adequacy as a measure of homogeneity of variables (Sharma, 1996). A KMO measure of above 0.60 is acceptable for factor analysis and Bartlett's test of sphericity tests whether the correlation matrix is an identity matrix, which would indicate that the factor model is inappropriate.
Score values of selected factors, as independent variables, were used for estimating body weight. The regression equation fitted to “standardized body weight” and “factor score values” is given below:
BW=a+b1FS1+b2FS2+b3FS3+e (for each gender)
Where a, is regression constant (it is the value of intercept & its value is zero); b1, b2 and b3 are regression coefficients of Factor Scores (FS). FS is factor score and e is the error term. Regression coefficients were tested by a t-statistic. The quality of the regression was measured by the coefficient of determination (R2) (Draper & Smith, 1998).
Difference between male and female for each biometrical trait was tested by independent samples t test. VIF (Variance inflation factor) are used as an indicator of multicollinearity. VIF for each independent variable should be less than 10. All statistical analyses were performed using MINITAB and SPSS statistical package programs.
RESULTS AND DISCUSSION
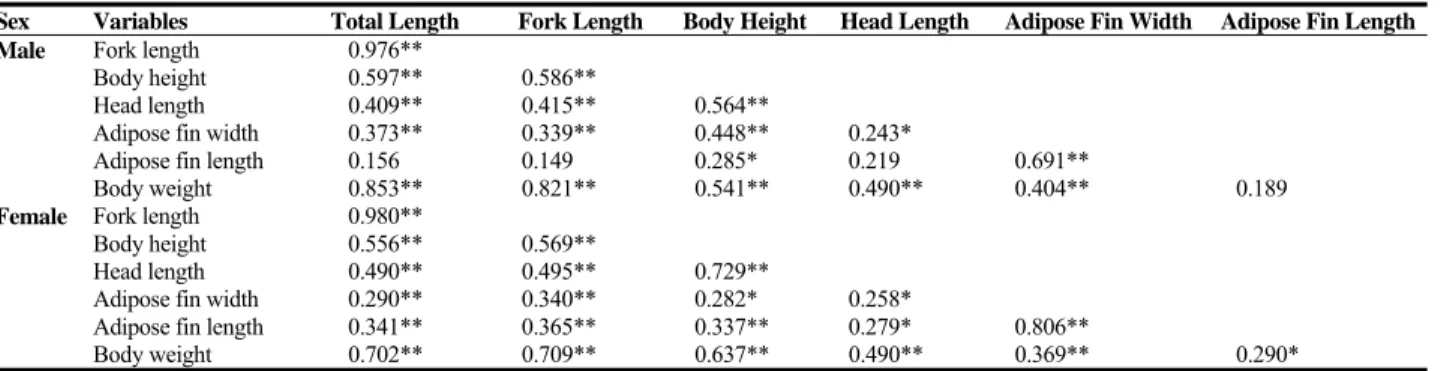
Descriptive statistics for each biometrical trait are given as mean and standard error (SE) in Table I. The differences between male and female means for all the traits were significant. The average values of male fish for all characteristics were higher than those of female fish. Pearson correlation coefficients between body weight and TL, FL, BH, HL, AFW were found positive and no significant correlation between body weight and AFL was noted in the male trouts. Correlations coefficients among all the biometrical traits were found positive and statistically significant in the female trouts. The highest correlation was determined between TL and FL in male and female trouts. However, the lowest correlations were found to be between AFL and FL for male trout and between AFW and HL for female trout (Table II).
Results of regression coefficient, their SE values, VIF values, R2, adjusted R2, mean square error (MSE) obtained from multiple regression analysis for male and female trouts are presented in Table III. Independent variables (TL, FL, BH, HL, AFW & AFL) explained variations in fish body weights (76.4% for male & 63.7% female trouts). The regression of body weight on TL and HL in male and BH, AFW and AFL in female trouts were significant. Because VIF values of TL and FL were larger than 10, there was multicollinearity problem in multiple regression analysis for male and female trouts. Application of multiple regression analysis produced inaccurate interpretations. In order to solve the multicollinearity problem and to perform a reliable regression analysis, factor scores derived from factor analysis, as independent variables, should be used for multiple regression analysis.
Kaiser-Meyer-Olkin (KMO) measure of sampling adequacy values for male and female trouts were found around 70% (Sharma, 1996). Results of Bartlett’s Test of Spherity were 315.57 and 377.55 for male and female fish. According to these results, it could be said that available data sets were suitable for factor analysis (Sharma, 1996).
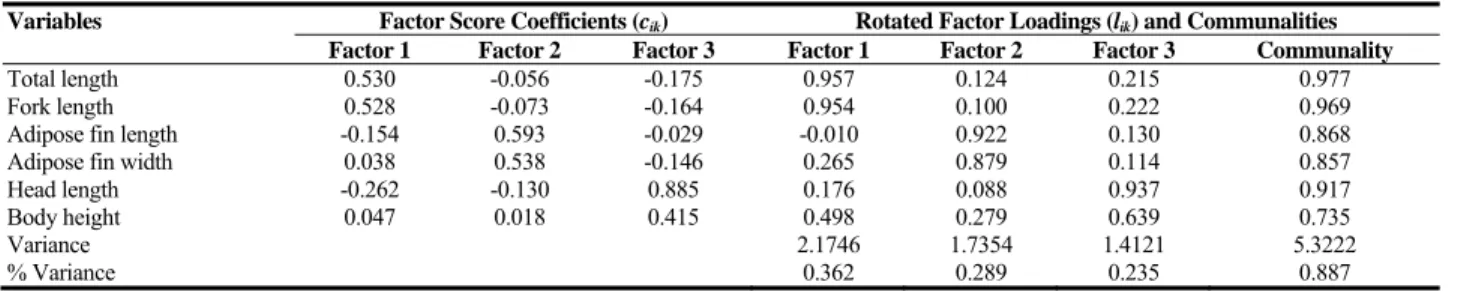
Results of factor analyses for both genders of fish are summarized in Table IV and V. When results of factor analysis were taken into consideration, 3 of 6 factors had eigen values greater than one for both the genders. These
ESTIMATION OF BODY WEIGHT FROM BIOMETRICAL TRAITS / Int. J. Agric. Biol., Vol. 12, No. 4, 2010
three factors were selected as independent variables for multiple regression analyses. The selected factors for male and female trouts explained 88.7 and 92.1% of total variation, respectively in factor analysis. Variance proportions explained by first factor, second factor, and third factor for male trouts were found as 0.362 (2.1746/6), 0.289 (1.7354/6) and 0.235 (1.4121/6), respectively. Variance proportions accounted for by first, second and third factors for female trouts were estimated to 0.327 (1.9595/6), 0.304 (1.8258/6) and 0.290 (1.7379/6), respectively. Factors may be interpreted from the variables that are highly correlated with them. After orthogonal rotation, the value of loading exhibited correlations between variables and corresponding factors. The bold marked loads indicate the highest correlations between variables and
corresponding factors. The higher factor loads represented better variables that were characterized by factors. For both genders, TL and FL were traits having the highest correlation with Factor 1. In factor 2, he highest correlation coefficients between factor 2-AFL along with factor2-AFW were found in both the genders. Communality values for male and female trouts were very large. Factor score values for each fish were calculated by factor scores coefficients.
After factor score values were obtained from three factors, the score values were used as independent variables and body weight was considered as a dependent variable. For each gender, results of multiple regression analyses for these variables are given in Table VI. When probabilities were taken into consideration, the regressions of standardized body weight on factor 1 (P<0.01), factor 2
Table I: Descriptive statistics (mean ± SE) for all the biometrical traits
Biometrical Trait Gender n Mean SE P
Total length Male 70 42.802 0.318 **
Female 70 41.407 0.339
Fork length Male 70 39.196 0.285 **
Female 70 37.760 0.340
Body height Male 70 9.766 0.0679 **
Female 70 9.234 0.111
Head length Male 70 9.963 0.114 **
Female 70 9.201 0.0874
Adipose fin width Male 70 3.440 0.0592 **
Female 70 2.560 0.0381
Adipose fin length Male 70 1.786 0.0321 **
Female 70 1.399 0.0282
Body weight Male 70 1.023 0.0244 *
Female 70 0.948 0.0227
*: P<0.05; **: P<0.01
Table II: Pearson Correlation coefficient between body weight and other traits for male and female trouts
Sex Variables Total Length Fork Length Body Height Head Length Adipose Fin Width Adipose Fin Length Male Fork length 0.976**
Body height 0.597** 0.586**
Head length 0.409** 0.415** 0.564**
Adipose fin width 0.373** 0.339** 0.448** 0.243*
Adipose fin length 0.156 0.149 0.285* 0.219 0.691**
Body weight 0.853** 0.821** 0.541** 0.490** 0.404** 0.189
Female Fork length 0.980**
Body height 0.556** 0.569**
Head length 0.490** 0.495** 0.729**
Adipose fin width 0.290** 0.340** 0.282* 0.258*
Adipose fin length 0.341** 0.365** 0.337** 0.279* 0.806**
Body weight 0.702** 0.709** 0.637** 0.490** 0.369** 0.290* Table III: Results of Multiple Regression analysis for male and female trouts
Gender
Male Female Variables Coefficient SE Coefficient VIF Coefficient SE Coefficient VIF
Intercept -1.7724** 0.2434 -1.1371** 0.2634
Total length 0.07760** 0.02212 22.2 0.02513 0.02649 27.3
Fork length -0.02021 0.02426 21.4 0.00979 0.02674 28.0
Body height -0.02844 0.03182 2.1 0.09531** 0.02438 2.5
Head length 0.04246* 0.01615 1.5 -0.04603 0.02910 2.2
Adipose fin width 0.04957 0.03907 2.4 0.21057** 0.07932 3.1
Adipose fin length -0.02793 0.06603 2.0 -0.2295* 0.1065 3.0
For male; S=0.1039, R2 =0.764, MSE=0.011Adjusted & R2 = 0.742. For female; S = 0.1195, R2 = 0.637, MSE=0.014 Adjusted & R2 = 0.602 *: P<0.05; **: P<0.01.
EYDURAN et al. / Int. J. Agric. Biol., Vol. 12, No. 4, 2010
(P<0.05) and Factor 3 (P<0.01) were statistically significant. In male trouts, 71.6% of variation in body weight was explained by all three factors (Table VI). Positively significant effects factor 1, 2, and 3 on body weight were found in male trouts. In female trouts, factor 1 had a positive effect on body weight, whereas, whereas factor 2 and 3 had negative effect. Fish body weight increased with increasing score values of factors with positive effect.
In male gender, body weight led to increase: i. With increasing TL and FL in factor 1 (Table IV) ii. With increasing AFL and AFW in factor 2 (Table IV) iii. With increasing HL and BH in factor 3 (Table IV). That is, body weight increased with an increase in each of six traits.
In female trouts, body weight led to increase: i. With increasing TL and FL in factor 1 (Table V) ii. With increasing AFW and AFL in factor 2 (Table V) iii. With increasing HL and BH in factor 3 (Table V).
AFW and AFL along with HL and BH variables are negatively correlated with factors 2 and 3 in Table V as well as regression coefficients (-0,20552 & -0.38104) of factors 2 and 3 had negative values in female trouts (Table V & VI). Multiplication of a negative value by another negative value becomes a positive value. For VIF values in Table VI were reduced to 1, multicollinearity problems were eliminated.
There was a reported study on the use of factor scores in multiple regressions in aquaculture.
In a study by Sangun et al. (2009) body weights of Lizardfish was estimated by several body measurements (total, standard, fork & head lengths, body depth, body circuit & body height). For this aim, factor analysis scores in multiple regression models were used. They reported that 98.4% of total variation in the body weight was explained by three selected factors, which were greater than one. Findings on eliminating multicollinearity problem were in consistent with those reported by other authors (Riva et al., 2004; Keskin et al., 2007a & b; Eyduran et al., 2009; Sangun et al., 2009).
CONCLUSION
Body weight from several biometrical characteristics in trouts can be estimated by using univariate and multivariate models for selection of throuts with high body weight for fish breeding programs. If confirmed at genetic level, result on biometrical traits for male and female trouts might allow researchers to improve body weight for fish breeding.
REFERENCES
Draper, N.R. and H. Smith, 1998. Applied Regression Analysis. John Wiley and Sons, Inc., New York
Table IV: Results of factor analysis for male trout
Variables Factor Score Coefficients (cik) Rotated Factor Loadings (lik) and Communalities
Factor 1 Factor 2 Factor 3 Factor 1 Factor 2 Factor 3 Communality
Total length 0.530 -0.056 -0.175 0.957 0.124 0.215 0.977
Fork length 0.528 -0.073 -0.164 0.954 0.100 0.222 0.969
Adipose fin length -0.154 0.593 -0.029 -0.010 0.922 0.130 0.868
Adipose fin width 0.038 0.538 -0.146 0.265 0.879 0.114 0.857
Head length -0.262 -0.130 0.885 0.176 0.088 0.937 0.917
Body height 0.047 0.018 0.415 0.498 0.279 0.639 0.735
Variance 2.1746 1.7354 1.4121 5.3222
% Variance 0.362 0.289 0.235 0.887
Table V: Results of factor analysis for female trout
Variables Factor Score Coefficients (cik) Rotated Factor Loadings (lik) and Communalities
Factor 1 Factor 2 Factor 3 Factor 1 Factor 2 Factor 3 Communality
Total length 0.601 0.085 0.171 0.942 -0.148 -0.284 0.990
Fork length 0.558 0.057 0.172 0.934 -0.190 -0.285 0.989
Adipose fin width -0.090 -0.057 0.074 0.130 -0.936 -0.115 0.906 Adipose fin length -0.074 -0.055 0.055 0.167 -0.922 -0.151 0.901 Head length -0.233 0.069 -0.686 0.218 -0.123 -0.906 0.884 Body height -0.125 0.054 -0.582 0.329 -0.161 -0.848 0.853
Variance 1.9595 1.8258 1.7379 5.5232
% Variance 0.327 0.304 0.290 0.921
Table VI: Results of multiple regression analysis for male and female trouts
Male Female
Predictor Coef SE Coef T P VIF Coef SE Coef T P VIF
Factor 1 0.76931 0.06562 11.72 0.000 1.0 0.60482 0.08227 7.35 0.000 1.0 Factor 2 0.16852 0.06562 2.57 0.012 1.0 -0.20552 0.08227 -2.50 0.015 1.0 Factor 3 0.30915 0.06562 4.71 0.000 1.0 -0.38104 0.08227 -4.63 0.000 1.0 For male; S = 0.5451, R2 = 0.716 & Adjusted R2 = 0.703. For female; S = 0.6834, R2 = 0.553 & Adjusted R2 = 0.533
ESTIMATION OF BODY WEIGHT FROM BIOMETRICAL TRAITS / Int. J. Agric. Biol., Vol. 12, No. 4, 2010
Eyduran, E., K. Karakus, S. Karakus and F. Cengiz, 2009. Usage of factor scores for determining relationships among body weight and body measurements. Bulgarian J. Agric. Sci., 15: 374–378
Keskin, S., A. Kor and S. Karaca, 2007a. Use of factor analysis scores in multiple linear regression model for determining relationships between milk yield and some udder traits in Goats. J. Appl. Anim.
Res., 31: 185–188
Keskin, S., I. Daskiran and A. Kor, 2007b. Factor analysis scores in a multiple linear regression model for the prediction of carcass weight in Akkeci kids. J. Appl. Anim. Res., 31: 201–204
Riva, J., R. Rizzi, S. Marelli and L.G. Cavalchini, 2004. Body measurements in Bergamasca sheep. Small Rumin. Res., 55: 221–227
Sangun, L., S. Cankaya, G.T. Kayaalp and M. Akar, 2009. Use of factor analysis scores in multiple regression models for estimation of body weight from some body measurements in Lizardfish. J. Anim. Vet.
Adv., 8: 47–50
Sharma, S., 1996. Applied Multivariate Techniques. John Wiley and Sons, Inc., New York
SPSS, 2004. SPSS for Windows Release 13.0 SPSS Inc
Tabachnick, B.G. and L.S. Fidell, 2001. Using Multivariate Statististics. Allyn and Bacon Pearson Education Company, Boston, Massachusetts