JHEP09(2011)053
Published for SISSA by SpringerReceived: July 8, 2011 Accepted: August 26, 2011 Published: September 12, 2011
Measurement of dijet production with a veto on
additional central jet activity in pp collisions at
√
s
= 7
TeV using the ATLAS detector
The ATLAS collaboration
Abstract:
A measurement of jet activity in the rapidity interval bounded by a dijet system
is presented. Events are vetoed if a jet with transverse momentum greater than 20 GeV
is found between the two boundary jets. The fraction of dijet events that survive the jet
veto is presented for boundary jets that are separated by up to six units of rapidity and
with mean transverse momentum 50 < p
T< 500 GeV. The mean multiplicity of jets above
the veto scale in the rapidity interval bounded by the dijet system is also presented as an
alternative method for quantifying perturbative QCD emission. The data are compared to
a next-to-leading order plus parton shower prediction from the powheg-box, an all-order
resummation using the hej calculation and the pythia, herwig
++and alpgen event
generators. The measurement was performed using pp collisions at
√
s = 7 TeV using data
recorded by the ATLAS detector in 2010.
JHEP09(2011)053
Contents
1
Introduction
1
2
The ATLAS detector
2
3
Measurement definition
3
4
Monte Carlo event simulation
3
5
Theory predictions
4
6
Jet reconstruction and energy scale determination
5
7
Event selection
5
8
Correction for detector effects
6
9
Results and discussion
8
10 Summary
13
The ATLAS collaboration
19
1
Introduction
Dijet production with a veto on additional hadronic activity in the rapidity interval between
the jets has previously been studied at HERA [
1
–
3
] and the Tevatron [
4
–
8
]. The Large
Hadron Collider (LHC) offers the opportunity to study this process at an increased
centre-of-mass energy and with a wider coverage in rapidity between jets. Historically, the main
purpose of these measurements has been to search for evidence of colour singlet exchange.
With this aim, a very low cut on the total hadronic activity between the jets (less than a
few GeV) was traditionally chosen, to suppress contributions from colour octet exchange.
In this measurement, a jet veto is used to identify the absence of additional activity.
This approach is useful because it allows a diverse range of perturbative QCD phenomena
to be studied, as the veto scale is chosen to be much larger than Λ
QCD. First,
BFKL-like dynamics
1[
10
–
13
] are expected to become increasingly important for large rapidity
intervals [
14
–
17
]. Alternatively, the effects of wide-angle soft-gluon radiation can be studied
in the limit that the average dijet transverse momentum is much larger than the scale used
to veto on additional jet activity [
18
,
19
]. Finally, colour singlet exchange is expected to
1
BFKL dynamics propose an evolution in ln(1/x), where x is the Bjorken variable, as opposed to the DGLAP [9] evolution in ln(Q2
), where Q2
JHEP09(2011)053
be important if both limits are satisfied at the same time, i.e the jets are widely separated
and the jet veto scale is small in comparison to the dijet transverse momentum. The
measurement is therefore targeted at studying the effects of QCD radiation in those regions
of phase space that may not be adequately described by standard event generators.
A central jet veto is also used in the search for Higgs production via vector boson fusion
in the Higgs-plus-two-jet channel in order to reject backgrounds. Furthermore, should the
Higgs boson be discovered, the contribution from gluon fusion to this channel needs to
be determined in order to extract the Higgs boson couplings [
20
–
23
]. This measurement,
therefore, could be used to constrain the theoretical modelling in current Higgs searches
and future precision Higgs measurements.
2
The ATLAS detector
ATLAS is a general-purpose detector surrounding interaction point one of the LHC [
24
,
25
].
The main detector components relevant to this analysis are the inner tracking detector,
the calorimeters and the minimum bias trigger scintillators (MBTS). The inner tracking
detector covers the pseudorapidity range |η| < 2.5, and has full coverage in azimuth.
2There are three main components to the inner tracker; the silicon pixel detector, the
silicon microstrip detector and the transition-radiation detector. These components are
arranged in concentric layers and immersed in a 2 T magnetic field provided by the inner
solenoid magnet.
The ATLAS calorimeter is also divided into sub-detectors. The electromagnetic
calorime-ter (|η| < 3.2) is a high-granularity sampling detector in which the active medium is liquid
argon (LAr) inter-spaced with layers of lead absorber. The hadronic calorimeters are
di-vided into three sections: a tile scintillator/steel calorimeter is used in both the barrel
(|η| < 1.0) and extended barrel cylinders (0.8 < |η| < 1.7); the hadronic endcap covers
the region 1.5 < |η| < 3.2 and consists of LAr/copper calorimeter modules; the forward
calorimeter measures both electromagnetic and hadronic energy in the range 3.2 < |η| < 4.9
using LAr/copper and LAr/tungsten modules. The total coverage of the ATLAS
calorime-ters is |η| < 4.9.
The primary triggers used to readout the ATLAS detector were the calorimeter jet
triggers [
26
]. The calorimeter jet triggers were validated for this measurement using a fully
efficient minimum bias trigger derived from the MBTS. The MBTS consists of 32 scintillator
counters arranged on two disks located in front of the end-cap calorimeter cryostats. The
MBTS cover the region 2.1 < |η| < 3.8.
2ATLAS uses a right-handed coordinate system with its origin at the nominal interaction point (IP) in the centre of the detector and the z-axis along the beam pipe. The x-axis points from the IP to the centre of the LHC ring, and the y axis points upward. Cylindrical coordinates (r, φ) are used in the transverse plane, φ being the azimuthal angle around the beam pipe. The pseudorapidity is defined in terms of the polar angle θ as η = − ln tan(θ/2). The rapidity of a particle with respect to the beam axis is defined as y =1
2ln E+pz
JHEP09(2011)053
3
Measurement definition
Jets are reconstructed using the anti-k
talgorithm [
27
] with distance parameter R = 0.6
and full four momentum recombination. Jets are required to have transverse momentum
p
T> 20 GeV and rapidity |y| < 4.4, ensuring that they are in a region in which the jet
energy scale has been validated (section
6
). The dijet system is identified using two different
selection criteria. In the first, the two highest transverse momentum jets in the event are
used, which probes wide-angle soft gluon radiation in p
T-ordered jet configurations. In
the second, the most forward and the most backward jets in the event are used (i.e. those
with the largest rapidity separation, ∆y), which favours BFKL-like dynamics because the
dijet invariant mass is much larger than the transverse momentum of the jets. For both
definitions, the mean transverse momentum of the jets that define the dijet system, p
T,
is required to be greater than 50 GeV. This ensures that the measurement is in the high
efficiency region of the calorimeter jet trigger (section
7
).
Two variables are used to quantify the amount of additional radiation in the rapidity
interval bounded by the dijet system. The first is the gap fraction, which is the fraction
of events that do not have an additional jet with a transverse momentum greater than a
given veto scale, Q
0, in the rapidity interval bounded by the dijet system. The default
value of the veto scale is chosen to be Q
0= 20 GeV. The second variable is the mean
number of jets with p
T> Q
0in the rapidity interval bounded by the dijet system. The
measurements of these two variables are fully corrected for experimental effects. The final
distributions therefore correspond to the ‘hadron-level’, in which the jets are reconstructed
using all final state particles that have a proper lifetime longer than 10 ps. This includes
muons and neutrinos.
4
Monte Carlo event simulation
Simulated proton-proton collisions at
√
s = 7 TeV were produced using Monte Carlo (MC)
event generators. These samples were used to derive systematic uncertainties and correct
for detector effects. The reference generator was pythia 6.4.2.3 [
28
], which implements
leading-order (LO) QCD matrix elements for 2 → 2 processes followed by a p
T-ordered
parton shower and the Lund string model of hadronisation. The underlying event in pythia
is modelled by multiple parton interactions interleaved with the initial state parton shower.
The events were generated using the MRST LO* parton distribution functions (PDF) [
29
,
30
] and the AMBT1 tune [
31
]. The final state particles were passed through a detailed
geant4
[
32
] simulation of the ATLAS detector [
33
] and reconstructed using the same
analysis chain as for the data.
Fully simulated event samples were also generated using herwig
++2.5.0 [
34
] and
alpgen
[
35
]. herwig
++implements leading order 2 → 2 matrix elements, but uses an
angular-ordered parton shower and a cluster hadronisation model. The underlying event
is modelled by multiple parton interactions. The herwig
++event samples are generated
using the MRST LO* PDF set with the LHC-UE7-1 tune for the underlying event [
36
].
alpgen
provides LO matrix elements with up to six partons in the final state. The
JHEP09(2011)053
alpgen
samples are generated using the CTEQ6L1 PDF set [
37
] and passed through
herwig
6.5 [
38
] and jimmy [
39
] to provide parton showering, hadronisation and multiple
partonic interactions with tune AUET1 [
40
].
5
Theory predictions
The measurements presented in this paper probe perturbative QCD in the region where the
energy scale of the dijet system is larger than the scale of the additional radiation. At large
values of p
T/Q
0or ∆y, it is expected that fixed order calculations are unlikely to describe
the data and that a resummation to all orders in perturbation theory is necessary. The
measurement is not particularly sensitive to non-perturbative physics because Q
0is chosen
to be much greater than Λ
QCD. The net effect of the non-perturbative physics corrections
was estimated by turning the hadronisation and underlying event on and off in pythia —
the resulting shift in the gap fraction was less than 2% and the change in the mean number
of jets in the rapidity interval bounded by the dijet system was less than 4%.
The theoretical predictions were produced using hej [
15
,
41
] and the powheg-box [
42
–
44
]. hej is a parton-level event generator that provides an all-order description of
wide-angle emissions of similar transverse momentum. In this BFKL-inspired limit, hej
re-produces the full QCD results and is especially suited for events with at least two jets
separated by a large rapidity interval.
3The events were generated with the MSTW 2008
NLO PDF set [
29
] and the partons were clustered into jets using the anti-k
talgorithm
with distance parameter R = 0.6. The renormalisation/factorisation scale (one parameter
in hej) was chosen to be the p
Tof the leading parton and the uncertainty due to this choice
was estimated by increasing and decreasing the scale by a factor of two. The uncertainty
from the choice of PDF was estimated using the full set of eigenvector errors provided by
MSTW and also by changing the PDF to CTEQ61 [
37
]. The overall uncertainty in the
hej
calculation is dominated by the scale choice and is typically 5% for the gap fraction
and 8% for the mean number of jets in the rapidity interval bounded by the dijet system.
These uncertainties are larger than the non-perturbative physics corrections and the hej
parton-level predictions are therefore used for data-theory comparisons.
The powheg-box provides a full next-to-leading order (NLO) dijet calculation and
is interfaced to pythia or herwig to provide all-order resummation of soft and collinear
emissions using the parton shower approximation. The powheg events were generated
using the MSTW 2008 NLO PDF set with the renormalisation and factorisation scales set
to the p
Tof the leading parton. These events were passed through both pythia (tune
AMBT1) and herwig (tune AUET1) to provide different hadron-level predictions. The
difference between these two predictions was found to be larger than the intrinsic
uncer-tainty in the NLO calculation, estimated by varying the PDFs and the renormalisation and
factorisation scales. Therefore, the powheg+pythia and powheg+herwig predictions
are both used for data-theory comparisons.
3
In the default setup (used in this analysis), hej matches the resummation to leading order 2 → 3 and 2 → 4 matrix elements. However, the option to include the additional running coupling terms from next-to-leading-log BFKL was not used.
JHEP09(2011)053
6
Jet reconstruction and energy scale determination
Jets are reconstructed at detector level using electromagnetic (EM) scale topological
clus-ters,
4which are three-dimensional objects built from calorimeter cells [
45
]. The jet energies
are corrected using p
Tand η dependent jet energy scale (JES) calibration factors derived
from simulated MC events [
46
]. The JES calibration is obtained by dividing the true jet
energy, defined using stable interacting particles in the MC event record (i.e. excluding
muons and neutrinos), by the EM scale energy of the matching detector-level jet. The
corrections are derived for jets with p
T> 10 GeV at the EM scale and parameterised as a
function of jet p
Tand |η|. An additional correction factor is applied to the η of jets that
fall in the crack-regions of the detector, to remove the bias caused by the constituents of
jets falling in regions of very different calorimeter response. The final stage recalculates
the jet kinematics using the primary vertex position, rather than the ATLAS geometric
centre (0,0,0).
The absolute JES uncertainty has been determined using data for the well-understood
barrel region (|η| < 0.8), by propagating the uncertainty in the single-particle response,
measured by the tracking and calorimeter systems, to the jet constituents [
47
].
An
additional uncertainty has been obtained for other calorimeter regions using dijet
η-intercalibration [
48
]; the jet calorimeter response relative to the barrel region was studied
by balancing the transverse momenta of dijets and the uncertainty estimated by comparing
the results obtained with data to a variety of MC based predictions. The total JES
uncer-tainty in each calorimeter region was taken to be the sum in quadrature of the absolute
uncertainty (from the barrel) and relative uncertainty from the dijet intercalibration [
46
].
The final JES uncertainty is approximately 2–5% in the barrel region, but rises to 13% in
the forward calorimeter for jets with p
T∼ 20 GeV.
The impact of the JES uncertainty on the measurement of dijet production with a jet
veto was studied by varying the energy scale of jets within the JES uncertainty, allowing for
different calorimeter regions to have correlated/uncorrelated calorimeter responses. The
associated uncertainty on the gap fraction is typically 3% (7%) for ∆y ∼ 3 (6). The
uncertainty on the mean number of jets in the rapidity interval bounded by the dijet
system is approximately 5% and only weakly dependent on ∆y. The effect of the JES
uncertainty is the largest systematic uncertainty in the measurement for most of the phase
space regions that are presented.
7
Event selection
The measurement was performed using data taken during 2010. The primary trigger
selec-tions used to readout the ATLAS detector were the calorimeter jet triggers. In particular,
distinct regions of p
Twere defined and, in each region, only events that passed a specific
jet trigger (at least one jet above a defined threshold) were used. The p
Tregions were
de-4
The electromagnetic scale is the basic calorimeter signal scale for the ATLAS calorimeters. It gives the correct response for the energy deposited in electromagnetic showers, while it does not correct for the lower hadron response.
JHEP09(2011)053
fined using pythia events and validated using data collected with a minimum bias trigger
derived from the MBTS. The chosen trigger for each region was required to be the highest
threshold (and therefore least prescaled) trigger that was at least 99% efficient for both
gap events and inclusive events. The bias in the measurement from the use of jet triggers
was estimated to be less than 0.25%. This was determined using MC simulations and also
data collected with the minimum bias trigger.
To minimise the impact of pile-up, each event was required to have exactly one
recon-structed primary vertex, defined as a vertex with at least five tracks that was consistent
with the beamspot. The fraction of events in each run with only one reconstructed vertex
was 90% in the early low luminosity runs, falling to 20% in the high luminosity runs at
the end of 2010. With the single vertex selection applied, the gap fraction was observed to
be independent of the data taking period and the systematic bias due to residual pile-up
events was determined to be less than 0.5%. Events were also rejected if they contained any
‘fake’ jets with p
T> 20 GeV that originated from calorimeter noise bursts, cosmic rays or
beam-backgrounds. The criteria for rejection were determined from events with spuriously
large missing transverse energy. The efficiency for jets was determined to be greater than
99% using a tag-and-probe method in dijet events. The overall impact of these cleaning
cuts was to reduce the number of events by less than 0.4%. Finally, the impact of beam
related backgrounds and cosmic rays were studied using data collected with special-purpose
trigger selections, and estimated to be less than 0.1%.
In total, 533063 events pass the selection criteria and kinematic cuts if the dijet system
is defined as the two leading-p
Tjets in the event. Of these, 85546 events have p
T> 210 GeV,
for which the unprescaled jet triggers are used. If the dijet system is defined as the most
forward and most backward jets in the event, then 306364 events pass the selection criteria
and kinematic cuts, with 33997 events satisfying p
T> 210 GeV.
The distribution of dijet events as a function of the rapidity interval between the two
jets is presented for uncorrected data in figures
1
(a) and (b) for the regions 90 ≤ p
T<
120 GeV and 180 ≤ p
T< 210 GeV, respectively. The dijet system is defined as the two
leading transverse momentum jets in the event. The transverse momentum of the leading
jet in the rapidity interval bounded by the dijet system, p
vetoT
, is presented in figures
1
(c) and (d). Finally the gap fraction is presented as a function of p
Tand as a function
of ∆y in figures
1
(e) and (f), respectively. In all such distributions, the baseline pythia
event generator with geant4 detector simulation gives a reasonable description of the
uncorrected data.
8
Correction for detector effects
The corrections for detector effects were calculated with a bin-by-bin unfolding procedure.
In this approach, the correction is defined in each bin as the ratio of the hadron-level
distribution (including muons and neutrinos) to the detector level distributions, using the
pythia
event generator. The bin sizes were chosen to be commensurate with the jet
energy resolution to ensure that the bin-to-bin migration was not too large. In particular,
JHEP09(2011)053
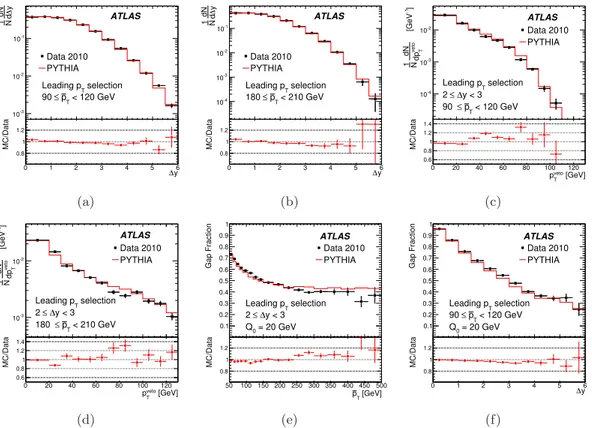
0 1 2 3 4 5 6 y ∆ d dN 1 N -3 10 -2 10 -1 10 Data 2010 PYTHIA selection T Leading p < 120 GeV T p ≤ 90 ATLAS y ∆ 0 1 2 3 4 5 6 MC/Data 0.8 1 1.2 (a) 0 1 2 3 4 5 6 y ∆ d dN N 1 -4 10 -3 10 -2 10 -1 10 Data 2010 PYTHIA selection T Leading p < 210 GeV T p ≤ 180 ATLAS y ∆ 0 1 2 3 4 5 6 MC/Data 0.8 1 1.2 (b) 0 20 40 60 80 100 120 ] -1 [GeV veto T dp dN N 1 -4 10 -3 10 -2 10 Data 2010 PYTHIA selection T Leading p y < 3 ∆ ≤ 2 < 120 GeV T p ≤ 90 ATLAS [GeV] veto T p 0 20 40 60 80 100 120 MC/Data 0.6 0.8 1 1.2 1.4 (c) 0 20 40 60 80 100 120 ] -1 [GeV veto T dp dN N 1 -3 10 -2 10 Data 2010 PYTHIA selection T Leading p y < 3 ∆ ≤ 2 < 210 GeV T p ≤ 180 ATLAS [GeV] veto T p 0 20 40 60 80 100 120 MC/Data 0.6 0.8 1 1.2 1.4 (d) 50 100 150 200 250 300 350 400 450 500 Gap Fraction 0.1 0.2 0.3 0.4 0.5 0.6 0.7 0.8 0.9 1 Data 2010 PYTHIA selection T Leading p y < 3 ∆ ≤ 2 = 20 GeV 0 Q ATLAS [GeV] T p 50 100 150 200 250 300 350 400 450 500 MC/Data 0.8 1 1.2 (e) 0 1 2 3 4 5 6 Gap Fraction 0.1 0.2 0.3 0.4 0.5 0.6 0.7 0.8 0.9 1 Data 2010 PYTHIA selection T Leading p < 120 GeV T p ≤ 90 = 20 GeV 0 Q ATLAS y ∆ 0 1 2 3 4 5 6 MC/Data 0.8 1 1.2 (f)Figure 1. Control distributions comparing uncorrected data and the pythia MC (tune AMBT1) with geant4 detector simulation. The dijet system is defined as the two leading-pTjets in the event.
The rapidity interval between those jets is shown for the phase space regions 90 ≤ pT< 120 GeV
and 180 ≤ pT < 210 GeV in (a) and (b), respectively. The transverse momentum of the leading
jet in this rapidity interval, pveto
T is shown for 90 ≤ pT< 120 GeV and 2 ≤ ∆y < 3 in (c) and for
180 ≤ pT< 210 GeV and 2 ≤ ∆y < 3 in (d). The gap fraction is shown as a function of pTand ∆y
in (e) and (f), respectively.
the purity
5of each bin was required to be at least 50% (the typical bin purity was between
60% and 70%). The typical correction factor was observed to be a few percent for the gap
fraction distribution and between 5% and 10% for the distribution of mean number of jets
in the rapidity interval between the boundary jets.
The systematic uncertainty on the detector correction was determined in two steps.
The physics modelling uncertainty was estimated by reweighting the p
T, ∆y and p
vetoT
distri-butions to account for any deviation between data and MC and also to cover the maximal
variation in shape allowed by the JES uncertainty. The detector modelling uncertainty
was determined by reweighting the z-vertex distribution and varying the jet
reconstruc-tion efficiency and the jet energy resolureconstruc-tion within the allowed uncertainties as determined
from data [
49
]. The modelling uncertainties were cross-checked using the herwig
++and
alpgen
samples, which agreed with the baseline pythia values within the statistical
un-5The bin purity is calculated using pythia events and defined as the number of events that are both reconstructed and generated in a particular bin divided by the number of events that are reconstructed in that bin.
JHEP09(2011)053
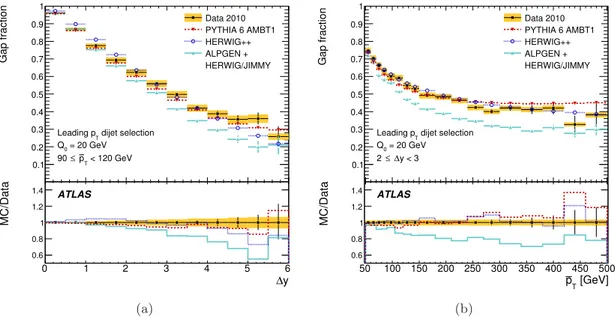
Gap fraction 0.1 0.2 0.3 0.4 0.5 0.6 0.7 0.8 0.9 1 dijet selection T Leading p = 20 GeV 0 Q < 120 GeV T p ≤ 90 Data 2010 PYTHIA 6 AMBT1 HERWIG++ ALPGEN + HERWIG/JIMMY y ∆ 0 1 2 3 4 5 6 MC/Data 0.6 0.8 1 1.2 1.4 ATLAS (a) Gap fraction 0.1 0.2 0.3 0.4 0.5 0.6 0.7 0.8 0.9 1 dijet selection T Leading p = 20 GeV 0 Q y < 3 ∆ ≤ 2 Data 2010 PYTHIA 6 AMBT1 HERWIG++ ALPGEN + HERWIG/JIMMY [GeV] T p 50 100 150 200 250 300 350 400 450 500 MC/Data 0.6 0.8 1 1.2 1.4 ATLAS (b)Figure 2. Gap fraction as a function of ∆y, given that the dijet system is defined as the leading-pT
jets in the event and satisfies 90 ≤ pT< 120 GeV (a). Gap fraction as a function of pTgiven that
the rapidity interval is 2 ≤ ∆y < 3 (b). The (corrected) data are the black points, with error bars representing the statistical uncertainty. The total systematic uncertainty on the measurement is represented by the solid (yellow) band. The dashed (red) points represents the pythia prediction (tune AMBT1), the dot-dashed (blue) points represents the herwig++ prediction (tune LHC-UE7-1) and the solid (cyan) points represents the alpgen prediction (tune AUET1).
certainty of each sample. The total systematic uncertainty in the detector correction was
defined as the quadrature sum of the physics/detector modelling uncertainties and the
sta-tistical uncertainty of the pythia samples. The systematic uncertainty on the correction
procedure is typically 2-3%. This uncertainty increases when ∆y and p
Tare both large, due
to an increased statistical uncertainty in the MC samples, and the maximum uncertainty
is about 10% at ∆y ∼ 5 and p
T∼ 240 GeV. This does not have a detrimental impact on
the measurement, however, as the statistical uncertainty on the data in these regions of
phase space is much larger.
9
Results and discussion
Figure
2
shows the gap fraction as a function of ∆y and p
T, with the data compared to
the pythia, herwig
++and alpgen event generators. The dijet system is defined as the
two leading-p
Tjets in the event. The data are corrected for detector effects, as discussed
in section
8
. The total uncertainty due to systematic effects is the sum in quadrature
of the uncertainty due to JES (section
6
) and the uncertainty due to the correction for
detector effects (section
8
). All other systematic effects were determined to have negligible
impact and were therefore not included in the final systematic uncertainty. Both pythia
and herwig
++give a good description of the data as a function of p
T. pythia also gives
the best description of the data as a function of ∆y, although the gap fraction is slightly
JHEP09(2011)053
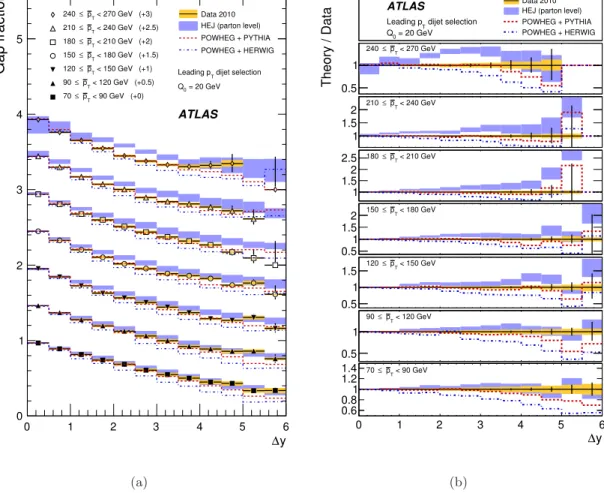
< 270 GeV (+3) T p ≤ 240 < 240 GeV (+2.5) T p ≤ 210 < 210 GeV (+2) T p ≤ 180 < 180 GeV (+1.5) T p ≤ 150 < 150 GeV (+1) T p ≤ 120 < 120 GeV (+0.5) T p ≤ 90 < 90 GeV (+0) T p ≤ 70 Data 2010 HEJ (parton level) POWHEG + PYTHIA POWHEG + HERWIG dijet selection T Leading p = 20 GeV 0 Q ATLAS y ∆ 0 1 2 3 4 5 6 Gap fraction 0 1 2 3 4 5 (a) Data 2010 HEJ (parton level) POWHEG + PYTHIA POWHEG + HERWIG ATLAS dijet selection T Leading p = 20 GeV 0 Q < 270 GeV T p ≤ 240 0.5 1 < 240 GeV T p ≤ 210 1 1.52 < 210 GeV T p ≤ 180 1 1.52 2.5 < 180 GeV T p ≤ 150 0.51 1.52 < 150 GeV T p ≤ 120 0.5 1 1.5 < 120 GeV T p ≤ 90 0.5 1 < 90 GeV T p ≤ 70 y ∆ 0 1 2 3 4 5 6 0.6 0.81 1.2 1.4 Theory / Data (b)Figure 3. Gap fraction as a function of ∆y for various pTslices. The dijet system is defined as the
two leading-pTjets in the event. The data are compared to the hej and powheg predictions in (a).
The ratio of these theory predictions to the data are shown in (b). The (unfolded) data are the black points, with error bars representing the statistical uncertainty and a solid (yellow) band representing the total systematic uncertainty. The darker (blue) band represents the theoretical uncertainty in the hej calculation from variation of the PDF and renormalisation/factorisation scales. The dashed (red) and dot-dashed (blue) curves represent the powheg predictions after showering, hadronisation and underlying event simulation with pythia (tune AMBT1) and herwig/jimmy (tune AUET1), respectively.
underestimated for ∆y ∼ 3. herwig
++overestimates the gap fraction at low values of
∆y and underestimates the gap fraction at large values of ∆y. alpgen shows the largest
deviation from the data, predicting a gap fraction that is too small at large values of
∆y or p
T.
The data are compared to the hej and powheg predictions in figure
3
and figure
4
as
a function of ∆y and p
T, respectively. The dijet system is again defined as the two
leading-p
Tjets in the event. The dependence of the gap fraction on one variable is studied after
fixing the phase space of the other variable to well defined and narrow regions. The hej
prediction describes the data well as a function of ∆y at low values of p
T. However, at large
values of p
T, hej predicts too many gap events. It should be noted that hej is designed
JHEP09(2011)053
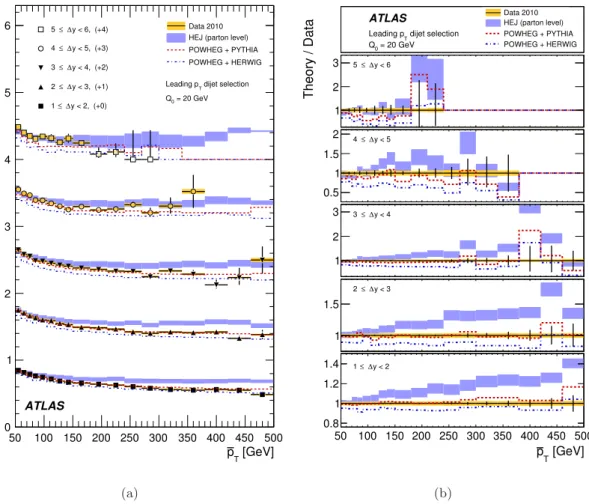
y < 6, (+4) ∆ ≤ 5 y < 5, (+3) ∆ ≤ 4 y < 4, (+2) ∆ ≤ 3 y < 3, (+1) ∆ ≤ 2 y < 2, (+0) ∆ ≤ 1 Data 2010 HEJ (parton level) POWHEG + PYTHIA POWHEG + HERWIG dijet selection T Leading p = 20 GeV 0 Q ATLAS [GeV] T p 50 100 150 200 250 300 350 400 450 500 Gap fraction 0 1 2 3 4 5 6 (a) Data 2010 HEJ (parton level) POWHEG + PYTHIA POWHEG + HERWIG ATLAS dijet selection T Leading p = 20 GeV 0 Q y < 6 ∆ ≤ 5 1 2 3 y < 5 ∆ ≤ 4 0.5 1 1.5 2 y < 4 ∆ ≤ 3 1 2 3 y < 3 ∆ ≤ 2 1 1.5 y < 2 ∆ ≤ 1 [GeV] T p 50 100 150 200 250 300 350 400 450 500 0.8 1 1.2 1.4 Theory / Data (b)Figure 4. Gap fraction as a function of pT for various ∆y slices. The dijet system is defined as
the two leading-pTjets in the event. The data are compared to the hej and powheg predictions
in (a). The ratio of these theory predictions to the data are shown in (b). The data and theory are presented in the same way as figure3.
to give a good description of QCD in the limit that all the jets have similar transverse
momentum. Therefore, the failure of the hej calculation as p
Tbecomes much larger than
Q
0is not unexpected. The description of the data may be improved by matching the hej
calculation to a standard parton shower, to account for soft and collinear emissions [
50
].
In general, powheg+pythia provides the best description of the data, when
consid-ered over all the phase space regions presented. However, at large values of ∆y, the gap
fraction predicted by powheg+pythia deviates from the data. This is expected because
the NLO-plus-parton-shower approximation does not contain the contributions to a full
QCD calculation that become important as ∆y increases. The gap fraction as a function
of p
Tis, however, well described by powheg+pythia at low ∆y. Furthermore, although
the absolute value of the gap fraction is not correct at larger ∆y, the shape of the
distribu-tions in p
Tremain well described. powheg+herwig tends to produce too much activity
across the full phase-space. However, the difference between powheg+herwig and the
data increases with ∆y, reproducing the effect observed with powheg+pythia.
JHEP09(2011)053
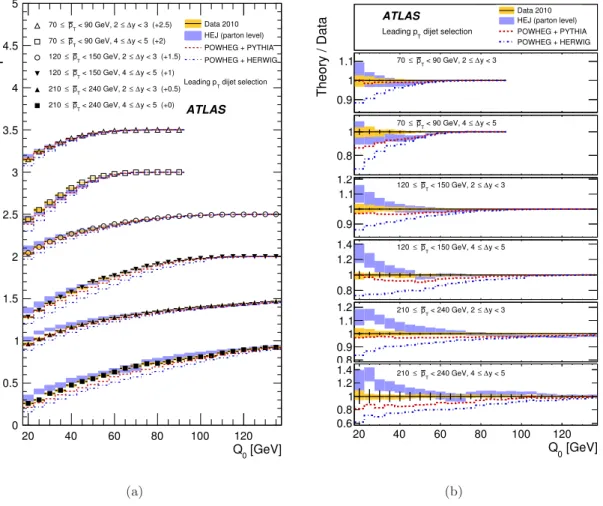
y < 3 (+2.5) ∆ ≤ < 90 GeV, 2 T p ≤ 70 y < 5 (+2) ∆ ≤ < 90 GeV, 4 T p ≤ 70 y < 3 (+1.5) ∆ ≤ < 150 GeV, 2 T p ≤ 120 y < 5 (+1) ∆ ≤ < 150 GeV, 4 T p ≤ 120 y < 3 (+0.5) ∆ ≤ < 240 GeV, 2 T p ≤ 210 y < 5 (+0) ∆ ≤ < 240 GeV, 4 T p ≤ 210 Data 2010 HEJ (parton level) POWHEG + PYTHIA POWHEG + HERWIG dijet selection T Leading p ATLAS [GeV] 0 Q 20 40 60 80 100 120 Gap fraction 0 0.5 1 1.5 2 2.5 3 3.5 4 4.5 5 (a) Data 2010 HEJ (parton level) POWHEG + PYTHIA POWHEG + HERWIG ATLAS dijet selection T Leading p y < 3 ∆ ≤ < 90 GeV, 2 T p ≤ 70 0.9 1 1.1 y < 5 ∆ ≤ < 90 GeV, 4 T p ≤ 70 0.8 1 y < 3 ∆ ≤ < 150 GeV, 2 T p ≤ 120 0.9 1 1.1 1.2 y < 5 ∆ ≤ < 150 GeV, 4 T p ≤ 120 0.8 1 1.2 1.4 y < 3 ∆ ≤ < 240 GeV, 2 T p ≤ 210 0.8 0.91 1.1 1.2 y < 5 ∆ ≤ < 240 GeV, 4 T p ≤ 210 [GeV] 0 Q 20 40 60 80 100 120 0.6 0.81 1.2 1.4 Theory / Data (b)Figure 5. Gap fraction as a function of Q0 for various pT and ∆y slices. The dijet system is
defined as the two leading-pTjets in the event. The data are compared to the hej and powheg
predictions in (a). The data points for Q0 > pT have been removed because the gap fraction is
always equal to one for this dijet selection, by definition. The ratio of the theory predictions to the data are shown in (b). The data and theory are presented in the same way as figure3.
The dependence of the gap fraction on the veto scale is presented in figure
5
for
specific regions of p
Tand ∆y. The Q
0dependence of the cross-section is useful in
study-ing the colour structure of the event [
51
]. The difference between powheg+pythia and
powheg+herwig
remains large for all values of Q
0. The hej description of the data
improves as Q
0approaches p
T, a kinematic configuration more suited to the hej
approxi-mations. At large values of p
T, none of the theoretical predictions describe the data well as
a function of Q
0. In particular, the description of the data is particularly poor when both
p
Tand ∆y become large, corresponding to the region in which colour singlet exchange is
expected to play an increasingly important role.
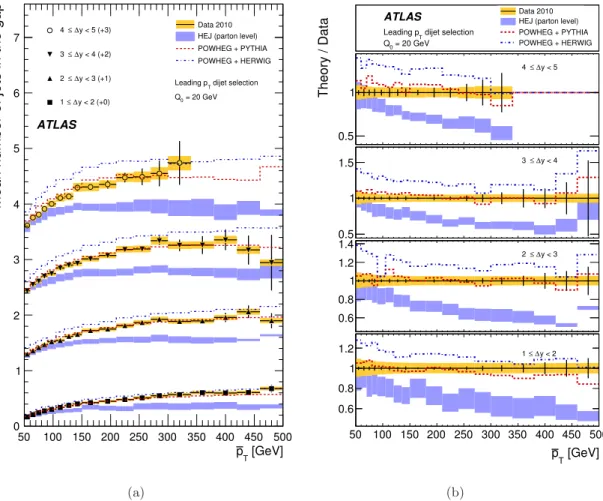
Figure
6
shows the mean number of jets in the rapidity interval bounded by the dijet
system as a function of p
T. This is an alternative way of studying the activity between
the boundary jets. The prediction of powheg+pythia again gives the best description
of the data, replicating the result obtained using the gap fraction. The powheg+herwig
JHEP09(2011)053
y < 5 (+3) ∆ ≤ 4 y < 4 (+2) ∆ ≤ 3 y < 3 (+1) ∆ ≤ 2 y < 2 (+0) ∆ ≤ 1 Data 2010 HEJ (parton level) POWHEG + PYTHIA POWHEG + HERWIG dijet selection T Leading p = 20 GeV 0 Q ATLAS [GeV] T p 50 100 150 200 250 300 350 400 450 500Mean number of jets in the gap
0 1 2 3 4 5 6 7 (a) Data 2010 HEJ (parton level) POWHEG + PYTHIA POWHEG + HERWIG ATLAS dijet selection T Leading p = 20 GeV 0 Q y < 5 ∆ ≤ 4 0.5 1 y < 4 ∆ ≤ 3 0.5 1 1.5 y < 3 ∆ ≤ 2 0.6 0.8 1 1.2 1.4 y < 2 ∆ ≤ 1 [GeV] T p 50 100 150 200 250 300 350 400 450 500 0.6 0.8 1 1.2 Theory / Data (b)
Figure 6. Mean number of jets in the gap as a function of pT for various ∆y slices. The dijet
system is defined as the two leading-pTjets in the event. The data are compared to the hej and
powhegpredictions in (a). The ratio of these theory predictions to the data are shown in (b). The data and theory are presented in the same way as figure3.
description of the data as a function of p
Tbecomes worse as p
Tdecreases, which was not
observed in the gap fraction distribution. In particular, powheg+herwig predicts a mean
jet multiplicity that is too large. The hej prediction deviates from the data at large values
of p
T, producing too little jet activity. This is the same effect as was observed using the
gap fraction, although the deviations from the data are larger.
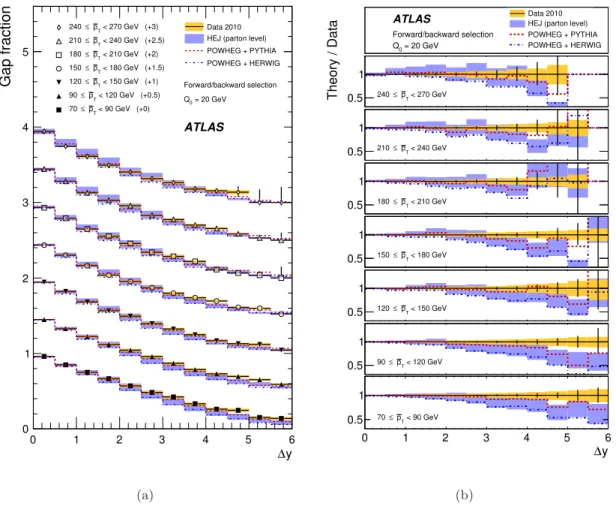
Figure
7
shows the gap fraction as a function of ∆y, with the dijet system defined as the
most forward and the most backward jets in the event. For this selection, the p
T-imbalance
between the two jets is typically much larger than when the dijet system is defined as the
two leading-p
Tjets in the event. The data are not well described by hej at low values of
p
T, implying that the resummation of soft emissions are important for this configuration.
The powheg prediction is similar to the hej prediction in all regions of phase space, that
is, both calculations result in a gap fraction that is too small at large ∆y.
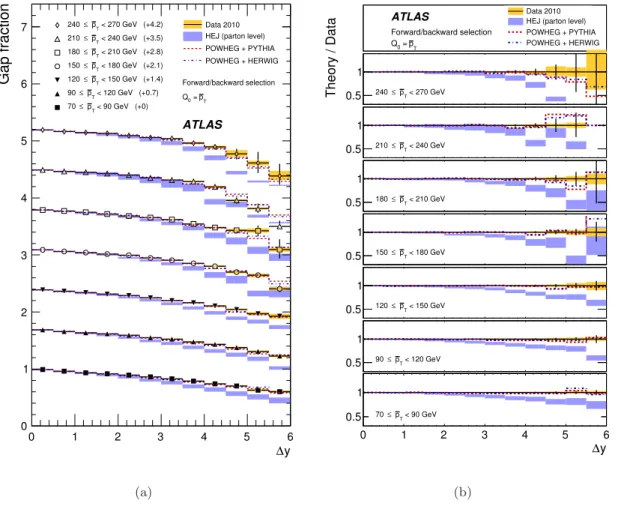
In figure
8
, the dijet system is again defined as the most forward and the most
back-ward jets in the event, but the veto scale is now set to Q
0= p
T. In this case, both
JHEP09(2011)053
< 270 GeV (+3) T p ≤ 240 < 240 GeV (+2.5) T p ≤ 210 < 210 GeV (+2) T p ≤ 180 < 180 GeV (+1.5) T p ≤ 150 < 150 GeV (+1) T p ≤ 120 < 120 GeV (+0.5) T p ≤ 90 < 90 GeV (+0) T p ≤ 70 Data 2010 HEJ (parton level) POWHEG + PYTHIA POWHEG + HERWIG Forward/backward selection = 20 GeV 0 Q ATLAS y ∆ 0 1 2 3 4 5 6 Gap fraction 0 1 2 3 4 5 (a) Data 2010 HEJ (parton level) POWHEG + PYTHIA POWHEG + HERWIG ATLAS Forward/backward selection = 20 GeV 0 Q < 270 GeV T p ≤ 240 0.5 1 < 240 GeV T p ≤ 210 0.5 1 < 210 GeV T p ≤ 180 0.5 1 < 180 GeV T p ≤ 150 0.5 1 < 150 GeV T p ≤ 120 0.5 1 < 120 GeV T p ≤ 90 0.5 1 < 90 GeV T p ≤ 70 y ∆ 0 1 2 3 4 5 6 0.5 1 Theory / Data (b)Figure 7. Gap fraction as a function of ∆y for various pT slices. The dijet system is defined as
the most forward and the most backward jets in the event. The data are compared to the hej and powhegpredictions in (a). The ratio of these theory predictions to the data are shown in (b). The data and theory are presented in the same way as figure3.
powheg+pythia
and powheg+herwig give a good description of the gap fraction as a
function of ∆y, implying a smaller dependence on the generator modelling of the parton
shower, hadronisation and underlying event. The hej description of the data, however,
does not improve with the increase in veto scale.
10
Summary
A central jet veto was used to study the fraction of events that do not contain hadronic
activity in the rapidity interval bounded by a dijet system (gap fraction). The dijet
sys-tem was identified in two ways: using the two leading transverse momentum jets in the
event and, alternatively, using the most forward and most backward jets in the event.
The first approach examines the effect of wide-angle soft gluon radiation for p
T-ordered
jet configurations, whereas the second favours very forward-backward configurations and,
therefore, BFKL-like dynamics. In addition, the mean number of jets in the rapidity
in-JHEP09(2011)053
< 270 GeV (+4.2) T p ≤ 240 < 240 GeV (+3.5) T p ≤ 210 < 210 GeV (+2.8) T p ≤ 180 < 180 GeV (+2.1) T p ≤ 150 < 150 GeV (+1.4) T p ≤ 120 < 120 GeV (+0.7) T p ≤ 90 < 90 GeV (+0) T p ≤ 70 Data 2010 HEJ (parton level) POWHEG + PYTHIA POWHEG + HERWIG Forward/backward selection T p = 0 Q ATLAS y ∆ 0 1 2 3 4 5 6 Gap fraction 0 1 2 3 4 5 6 7 (a) Data 2010 HEJ (parton level) POWHEG + PYTHIA POWHEG + HERWIG ATLAS Forward/backward selection T p = 0 Q < 270 GeV T p ≤ 240 0.5 1 < 240 GeV T p ≤ 210 0.5 1 < 210 GeV T p ≤ 180 0.5 1 < 180 GeV T p ≤ 150 0.5 1 < 150 GeV T p ≤ 120 0.5 1 < 120 GeV T p ≤ 90 0.5 1 < 90 GeV T p ≤ 70 y ∆ 0 1 2 3 4 5 6 0.5 1 Theory / Data (b)Figure 8. Gap fraction as a function of ∆y for various pTslices. The dijet system is defined as the
most forward and the most backward jets in the event and the veto scale is set to Q0 = pT. The
data are compared to the hej and powheg predictions in (a). The ratio of these theory predictions to the data are shown in (b). The data and theory are presented in the same way as figure3.
terval bounded by the dijet system was presented, as an alternative variable for studying
perturbative QCD emission.
The gap fraction was studied as a function of the rapidity separation between the
boundary jets, ∆y, the mean transverse momentum of the boundary jets, p
Tand the jet
veto scale, Q
0. The mean number of jets in the rapidity interval was studied as a function
of p
Tand ∆y. In all cases, the data were corrected for detector effects. The data show
the expected behaviour of a reduction of gap events, or an increase in jet activity, for
large values of p
Tor ∆y [
18
]. The pythia, herwig
++and alpgen leading-order MC
event generators were compared to the data. It was observed that pythia and herwig
++gave the best description of the data as a function of p
Tand that pythia gave the best
description of the data as a function of ∆y. alpgen did not describe the data well at large
values of p
Tor ∆y.
The data were compared to the NLO-plus-parton-shower predictions provided by
powheg
when interfaced to pythia (tune AMBT1) or herwig (tune AUET1). In general,
JHEP09(2011)053
powheg+pythia
gave the best description of the data, with powheg+herwig predicting
too much jet activity in the rapidity interval between the boundary jets. Both powheg
predictions result in too low a gap fraction at large values of ∆y, implying that the fixed
order plus parton shower approach does not contain higher order QCD effects that become
important as ∆y increases.
The data were also compared to the hej resummation of wide-angle emissions of
sim-ilar transverse momentum. A particularly striking feature is that the parton-level hej
prediction has too little jet activity and too large a gap fraction at large values of p
T/Q
0.
This means that the hej calculation is missing higher order QCD effects that become
important as p
T/Q
0increases, i.e. those effects that are provided by a traditional parton
shower approach. However, hej does describe the data well as a function of ∆y when the
dijet system is defined as the two leading p
Tjets in the event and those jets do not have a
value of p
Tthat is much larger than the veto scale.
In most of the phase-space regions presented, the experimental uncertainty is smaller
than the theoretical uncertainty.
Furthermore, the experimental uncertainty is much
smaller than the spread of LO Monte Carlo event generator predictions.
This data
can therefore be used to constrain the event generator modelling of QCD radiation
be-tween widely separated jets. Such a constraint would be useful for the current
Higgs-plus-two-jet searches and also for any future measurements that are sensitive to higher
order QCD emissions.
Acknowledgments
We thank Jeppe Andersen, Jeff Forshaw, Hendrik Hoeth, Frank Krauss, Simone Marzani,
Paolo Nason, Emanuele Re, Mike Seymour and Jennifer Smillie for very useful discussions
regarding the theory predictions used in this analysis.
We thank CERN for the very successful operation of the LHC, as well as the support
staff from our institutions without whom ATLAS could not be operated efficiently.
We acknowledge the support of ANPCyT, Argentina; YerPhI, Armenia; ARC,
Aus-tralia; BMWF, Austria; ANAS, Azerbaijan; SSTC, Belarus; CNPq and FAPESP, Brazil;
NSERC, NRC and CFI, Canada; CERN; CONICYT, Chile; CAS, MOST and NSFC,
China; COLCIENCIAS, Colombia; MSMT CR, MPO CR and VSC CR, Czech
Repub-lic; DNRF, DNSRC and Lundbeck Foundation, Denmark; ARTEMIS, European Union;
IN2P3-CNRS, CEA-DSM/IRFU, France; GNAS, Georgia; BMBF, DFG, HGF, MPG and
AvH Foundation, Germany; GSRT, Greece; ISF, MINERVA, GIF, DIP and Benoziyo
Cen-ter, Israel; INFN, Italy; MEXT and JSPS, Japan; CNRST, Morocco; FOM and NWO,
Netherlands; RCN, Norway; MNiSW, Poland; GRICES and FCT, Portugal; MERYS
(MECTS), Romania; MES of Russia and ROSATOM, Russian Federation; JINR; MSTD,
Serbia; MSSR, Slovakia; ARRS and MVZT, Slovenia; DST/NRF, South Africa; MICINN,
Spain; SRC and Wallenberg Foundation, Sweden; SER, SNSF and Cantons of Bern and
Geneva, Switzerland; NSC, Taiwan; TAEK, Turkey; STFC, the Royal Society and
Lever-hulme Trust, United Kingdom; DOE and NSF, United States of America.
JHEP09(2011)053
The crucial computing support from all WLCG partners is acknowledged gratefully,
in particular from CERN and the ATLAS Tier-1 facilities at TRIUMF (Canada), NDGF
(Denmark, Norway, Sweden), CC-IN2P3 (France), KIT/GridKA (Germany), INFN-CNAF
(Italy), NL-T1 (Netherlands), PIC (Spain), ASGC (Taiwan), RAL (UK) and BNL (USA)
and in the Tier-2 facilities worldwide.
Open Access.
This article is distributed under the terms of the Creative Commons
Attribution Noncommercial License which permits any noncommercial use, distribution,
and reproduction in any medium, provided the original author(s) and source are credited.
References
[1] ZEUS collaboration, M. Derrick et al., Rapidity gaps between jets in photoproduction at
HERA,Phys. Lett. B 369 (1996) 55[hep-ex/9510012] [SPIRES].
[2] H1 collaboration, C. Adloff et al., Energy flow and rapidity gaps between jets in
photoproduction at HERA,Eur. Phys. J. C 24 (2002) 517[hep-ex/0203011] [SPIRES].
[3] ZEUS collaboration, S. Chekanov et al., Photoproduction of events with rapidity gaps
between jets at HERA,Eur. Phys. J. C 50 (2007) 283 [hep-ex/0612008] [SPIRES].
[4] D0 collaboration, S. Abachi et al., Rapidity gaps between jets in p¯p collisions at √
s = 1.8 TeV,Phys. Rev. Lett. 72 (1994) 2332[SPIRES].
[5] CDF collaboration, F. Abe et al., Observation of rapidity gaps in ¯pp collisions at 1.8 TeV,
Phys. Rev. Lett. 74 (1995) 855[SPIRES].
[6] CDF collaboration, F. Abe et al., Events with a rapidity gap between jets in ¯pp collisions at √s = 630 GeV,Phys. Rev. Lett. 81 (1998) 5278[SPIRES].
[7] D0 collaboration, B. Abbott et al., Probing hard color singlet exchange in p¯p collisions at √
s = 630 GeV and 1800 GeV,Phys. Lett. B 440 (1998) 189[hep-ex/9809016] [SPIRES]. [8] CDF collaboration, F. Abe et al., Dijet production by color-singlet exchange at the Fermilab
Tevatron,Phys. Rev. Lett. 80 (1998) 1156[SPIRES].
[9] G. Altarelli and G. Parisi, Asymptotic freedom in parton language,
Nucl. Phys. B 126 (1977) 298[SPIRES].
[10] V.S. Fadin, E.A. Kuraev and L.N. Lipatov, On the Pomeranchuk singularity in
asymptotically free theories,Phys. Lett. B 60 (1975) 50[SPIRES].
[11] E.A. Kuraev, L.N. Lipatov and V.S. Fadin, Multi-reggeon processes in the Yang-Mills theory,
Sov. Phys. JETP 44 (1976) 443 [Zh. Eksp. Teor. Fiz. 71 (1976) 840] [SPIRES].
[12] E.A. Kuraev, L.N. Lipatov and V.S. Fadin, The Pomeranchuk singularity in nonabelian gauge
theories, Sov. Phys. JETP 45 (1977) 199 [Zh. Eksp. Teor. Fiz. 72 (1977) 377] [SPIRES].
[13] I.I. Balitsky and L.N. Lipatov, The Pomeranchuk singularity in quantum chromodynamics,
Sov. J. Nucl. Phys. 28 (1978) 822 [Yad. Fiz. 28 (1978) 1597] [SPIRES].
[14] J.R. Andersen and J.M. Smillie, Constructing all-order corrections to multi-jet rates,
JHEP 01 (2010) 039[arXiv:0908.2786] [SPIRES].
[15] J.R. Andersen and J.M. Smillie, High energy description of processes with multiple hard jets,
JHEP09(2011)053
[16] J.R. Forshaw, A. Kyrieleis and M.H. Seymour, Gaps between jets in the high energy limit,JHEP 06 (2005) 034[hep-ph/0502086] [SPIRES].
[17] A.H. Mueller and H. Navelet, An inclusive minijet cross-section and the bare Pomeron in
QCD,Nucl. Phys. B 282 (1987) 727[SPIRES].
[18] J. Forshaw, J. Keates and S. Marzani, Jet vetoing at the LHC,JHEP 07 (2009) 023
[arXiv:0905.1350] [SPIRES].
[19] J.R. Forshaw, A. Kyrieleis and M.H. Seymour, Super-leading logarithms in non-global
observables in QCD,JHEP 08 (2006) 059[hep-ph/0604094] [SPIRES].
[20] M. D¨uhrssen et al., Extracting Higgs boson couplings from LHC data,
Phys. Rev. D 70 (2004) 113009[hep-ph/0406323] [SPIRES].
[21] R. Lafaye, T. Plehn, M. Rauch, D. Zerwas and M. D¨uhrssen, Measuring the Higgs sector,
JHEP 08 (2009) 009[arXiv:0904.3866] [SPIRES].
[22] J.M. Campbell, R.K. Ellis and G. Zanderighi, Next-to-leading order Higgs + 2 jet production
via gluon fusion,JHEP 10 (2006) 028[hep-ph/0608194] [SPIRES].
[23] B.E. Cox, J.R. Forshaw and A.D. Pilkington, Extracting Higgs boson couplings using a jet
veto,Phys. Lett. B 696 (2011) 87[arXiv:1006.0986] [SPIRES].
[24] ATLAS collaboration, G. Aad et al., The ATLAS experiment at the CERN Large Hadron
Collider,2008 JINST 3 S08003[SPIRES].
[25] ATLAS collaboration, Expected performance of the ATLAS experiment detector, trigger,
physics,arXiv:0901.0512[CERN-OPEN-2008-020].
[26] ATLAS collaboration, Performance of the ATLAS jet trigger with pp collisions at √
s = 900 GeV,ATLAS-CONF-2010-028(2010).
[27] M. Cacciari, G.P. Salam and G. Soyez, The anti-kt jet clustering algorithm, JHEP 04 (2008) 063[arXiv:0802.1189] [SPIRES].
[28] T. Sj¨ostrand, S. Mrenna and P.Z. Skands, PYTHIA 6.4 physics and manual,
JHEP 05 (2006) 026[hep-ph/0603175] [SPIRES].
[29] A.D. Martin, W.J. Stirling, R.S. Thorne and G. Watt, Parton distributions for the LHC,
Eur. Phys. J. C 63 (2009) 189[arXiv:0901.0002] [SPIRES].
[30] A. Sherstnev and R.S. Thorne, Different PDF approximations useful for LO Monte Carlo
generators,arXiv:0807.2132[SPIRES].
[31] ATLAS collaboration, Charged particle multiplicities in pp interactions at√s = 0.9 and 7 TeV in a diffractive limited phase-space measured with the ATLAS detector at the LHC and
new PYTHIA6 tune,ATLAS-CONF-2010-031(2010).
[32] S. Agostinelli et al., GEANT4: a simulation toolkit,Nucl. Instrum. Meth. A 506 (2003) 250. [33] ATLAS collaboration, G. Aad et al., The ATLAS simulation infrastructure,
Eur. Phys. J. C 70 (2010) 823[arXiv:1005.4568] [SPIRES].
[34] M. Bahr et al., HERWIG++ physics and manual, Eur. Phys. J. C 58 (2008) 639
[arXiv:0803.0883] [SPIRES].
[35] M.L. Mangano, M. Moretti, F. Piccinini, R. Pittau and A.D. Polosa, ALPGEN, a generator
for hard multiparton processes in hadronic collisions,JHEP 07 (2003) 001[hep-ph/0206293]
JHEP09(2011)053
[36] S. Gieseke et al., HERWIG++ 2.5 release note,arXiv:1102.1672[SPIRES].[37] J. Pumplin et al., New generation of parton distributions with uncertainties from global QCD
analysis,JHEP 07 (2002) 012[hep-ph/0201195] [SPIRES].
[38] G. Corcella et al., HERWIG 6.5: an event generator for Hadron Emission Reactions With
Interfering Gluons (including supersymmetric processes),JHEP 01 (2001) 010
[hep-ph/0011363] [SPIRES].
[39] J.M. Butterworth, J.R. Forshaw and M.H. Seymour, Multiparton interactions in
photoproduction at HERA,Z. Phys. C 72 (1996) 637[hep-ph/9601371] [SPIRES].
[40] ATLAS collaboration, First tuning of HERWIG/JIMMY to ATLAS data, ATL-PHYS-PUB-2010-014(2010).
[41] J.R. Andersen and J.M. Smillie, Multiple jets at the LHC with high energy jets,
JHEP 06 (2011) 010[arXiv:1101.5394] [SPIRES].
[42] P. Nason, A new method for combining NLO QCD with shower Monte Carlo algorithms,
JHEP 11 (2004) 040[hep-ph/0409146] [SPIRES].
[43] S. Alioli, P. Nason, C. Oleari and E. Re, A general framework for implementing NLO
calculations in shower Monte Carlo programs: the POWHEG BOX,JHEP 06 (2010) 043
[arXiv:1002.2581] [SPIRES].
[44] S. Alioli, K. Hamilton, P. Nason, C. Oleari and E. Re, Jet pair production in POWHEG,
JHEP 04 (2011) 081[arXiv:1012.3380] [SPIRES].
[45] M. Aharrouche et al., Measurement of the response of the ATLAS liquid argon barrel
calorimeter to electrons at the 2004 combined test-beam,
Nucl. Instrum. Meth. A 614 (2010) 400[SPIRES].
[46] ATLAS collaboration, Update on the jet energy scale systematic uncertainty for jets produced
in proton-proton collisions at√s = 7 TeV measured with the ATLAS detector,
ATLAS-CONF-2011-032(2011).
[47] ATLAS collaboration, ATLAS calorimeter response to single isolated hadrons and
estimation of the calorimeter jet scale uncertainty,ATLAS-CONF-2011-028(2011).
[48] ATLAS collaboration, In-situ pseudo-rapidity inter-calibration to evaluate jet energy scale
uncertainty using dijet events in proton-proton collisions at√s = 7 TeV,
ATLAS-CONF-2011-014(2011).
[49] ATLAS collaboration, Jet energy resolution and reconstruction efficiencies from in-situ
techniques with the ATLAS Detector Using Proton-Proton Collisions at a Center of Mass
Energy√s = 7 TeV,ATLAS-CONF-2010-054(2010).
[50] J.R. Andersen, L. L¨onnblad and J.M. Smillie, A parton shower for high energy jets,
JHEP 07 (2011) 110[arXiv:1104.1316] [SPIRES].
JHEP09(2011)053
The ATLAS collaboration
G. Aad48, B. Abbott111, J. Abdallah11, A.A. Abdelalim49, A. Abdesselam118, O. Abdinov10,
B. Abi112, M. Abolins88, H. Abramowicz153, H. Abreu115, E. Acerbi89a,89b, B.S. Acharya164a,164b,
D.L. Adams24, T.N. Addy56, J. Adelman175, M. Aderholz99, S. Adomeit98, P. Adragna75,
T. Adye129, S. Aefsky22, J.A. Aguilar-Saavedra124b,a, M. Aharrouche81, S.P. Ahlen21, F. Ahles48,
A. Ahmad148, M. Ahsan40, G. Aielli133a,133b, T. Akdogan18a, T.P.A. ˚Akesson79, G. Akimoto155,
A.V. Akimov94, A. Akiyama67, M.S. Alam1, M.A. Alam76, J. Albert169, S. Albrand55,
M. Aleksa29, I.N. Aleksandrov65, F. Alessandria89a, C. Alexa25a, G. Alexander153,
G. Alexandre49, T. Alexopoulos9, M. Alhroob20, M. Aliev15, G. Alimonti89a, J. Alison120,
M. Aliyev10, P.P. Allport73, S.E. Allwood-Spiers53, J. Almond82, A. Aloisio102a,102b, R. Alon171,
A. Alonso79, M.G. Alviggi102a,102b, K. Amako66, P. Amaral29, C. Amelung22, V.V. Ammosov128,
A. Amorim124a,b, G. Amor´os167, N. Amram153, C. Anastopoulos29, L.S. Ancu16, N. Andari115,
T. Andeen34, C.F. Anders20, G. Anders58a, K.J. Anderson30, A. Andreazza89a,89b, V. Andrei58a,
M-L. Andrieux55, X.S. Anduaga70, A. Angerami34, F. Anghinolfi29, N. Anjos124a, A. Annovi47,
A. Antonaki8, M. Antonelli47, A. Antonov96, J. Antos144b, F. Anulli132a, S. Aoun83,
L. Aperio Bella4, R. Apolle118,c, G. Arabidze88, I. Aracena143, Y. Arai66, A.T.H. Arce44,
J.P. Archambault28, S. Arfaoui29,d, J-F. Arguin14, E. Arik18a,∗, M. Arik18a, A.J. Armbruster87,
O. Arnaez81, C. Arnault115, A. Artamonov95, G. Artoni132a,132b, D. Arutinov20, S. Asai155, R. Asfandiyarov172, S. Ask27, B. ˚Asman146a,146b, L. Asquith5, K. Assamagan24, A. Astbury169,
A. Astvatsatourov52, G. Atoian175, B. Aubert4, B. Auerbach175, E. Auge115, K. Augsten127,
M. Aurousseau145a, N. Austin73, G. Avolio163, R. Avramidou9, D. Axen168, C. Ay54,
G. Azuelos93,e, Y. Azuma155, M.A. Baak29, G. Baccaglioni89a, C. Bacci134a,134b, A.M. Bach14,
H. Bachacou136, K. Bachas29, G. Bachy29, M. Backes49, M. Backhaus20, E. Badescu25a,
P. Bagnaia132a,132b, S. Bahinipati2, Y. Bai32a, D.C. Bailey158, T. Bain158, J.T. Baines129,
O.K. Baker175, M.D. Baker24, S. Baker77, E. Banas38, P. Banerjee93, Sw. Banerjee172, D. Banfi29,
A. Bangert137, V. Bansal169, H.S. Bansil17, L. Barak171, S.P. Baranov94, A. Barashkou65,
A. Barbaro Galtieri14, T. Barber27, E.L. Barberio86, D. Barberis50a,50b, M. Barbero20,
D.Y. Bardin65, T. Barillari99, M. Barisonzi174, T. Barklow143, N. Barlow27, B.M. Barnett129,
R.M. Barnett14, A. Baroncelli134a, G. Barone49, A.J. Barr118, F. Barreiro80, J. Barreiro
Guimar˜aes da Costa57, P. Barrillon115, R. Bartoldus143, A.E. Barton71, D. Bartsch20,
V. Bartsch149, R.L. Bates53, L. Batkova144a, J.R. Batley27, A. Battaglia16, M. Battistin29,
G. Battistoni89a, F. Bauer136, H.S. Bawa143,f, B. Beare158, T. Beau78, P.H. Beauchemin118,
R. Beccherle50a, P. Bechtle41, H.P. Beck16, M. Beckingham48, K.H. Becks174, A.J. Beddall18c,
A. Beddall18c, S. Bedikian175, V.A. Bednyakov65, C.P. Bee83, M. Begel24, S. Behar Harpaz152,
P.K. Behera63, M. Beimforde99, C. Belanger-Champagne85, P.J. Bell49, W.H. Bell49, G. Bella153,
L. Bellagamba19a, F. Bellina29, M. Bellomo119a, A. Belloni57, O. Beloborodova107, K. Belotskiy96,
O. Beltramello29, S. Ben Ami152, O. Benary153, D. Benchekroun135a, C. Benchouk83, M. Bendel81,
B.H. Benedict163, N. Benekos165, Y. Benhammou153, D.P. Benjamin44, M. Benoit115,
J.R. Bensinger22, K. Benslama130, S. Bentvelsen105, D. Berge29, E. Bergeaas Kuutmann41,
N. Berger4, F. Berghaus169, E. Berglund49, J. Beringer14, K. Bernardet83, P. Bernat77,
R. Bernhard48, C. Bernius24, T. Berry76, A. Bertin19a,19b, F. Bertinelli29, F. Bertolucci122a,122b,
M.I. Besana89a,89b, N. Besson136, S. Bethke99, W. Bhimji45, R.M. Bianchi29, M. Bianco72a,72b,
O. Biebel98, S.P. Bieniek77, K. Bierwagen54, J. Biesiada14, M. Biglietti134a,134b, H. Bilokon47,
M. Bindi19a,19b, S. Binet115, A. Bingul18c, C. Bini132a,132b, C. Biscarat177, U. Bitenc48, K.M. Black21, R.E. Blair5, J.-B. Blanchard115, G. Blanchot29, T. Blazek144a, C. Blocker22,
J. Blocki38, A. Blondel49, W. Blum81, U. Blumenschein54, G.J. Bobbink105, V.B. Bobrovnikov107,
JHEP09(2011)053
J.A. Bogaerts29, A. Bogdanchikov107, A. Bogouch90,∗, C. Bohm146a, V. Boisvert76, T. Bold163,g,V. Boldea25a, N.M. Bolnet136, M. Bona75, V.G. Bondarenko96, M. Boonekamp136, G. Boorman76,
C.N. Booth139, S. Bordoni78, C. Borer16, A. Borisov128, G. Borissov71, I. Borjanovic12a,
S. Borroni132a,132b, K. Bos105, D. Boscherini19a, M. Bosman11, H. Boterenbrood105,
D. Botterill129, J. Bouchami93, J. Boudreau123, E.V. Bouhova-Thacker71, C. Boulahouache123, C. Bourdarios115, N. Bousson83, A. Boveia30, J. Boyd29, I.R. Boyko65, N.I. Bozhko128,
I. Bozovic-Jelisavcic12b, J. Bracinik17, A. Braem29, P. Branchini134a, G.W. Brandenburg57,
A. Brandt7, G. Brandt15, O. Brandt54, U. Bratzler156, B. Brau84, J.E. Brau114, H.M. Braun174,
B. Brelier158, J. Bremer29, R. Brenner166, S. Bressler152, D. Breton115, D. Britton53,
F.M. Brochu27, I. Brock20, R. Brock88, T.J. Brodbeck71, E. Brodet153, F. Broggi89a,
C. Bromberg88, G. Brooijmans34, W.K. Brooks31b, G. Brown82, H. Brown7,
P.A. Bruckman de Renstrom38, D. Bruncko144b, R. Bruneliere48, S. Brunet61, A. Bruni19a,
G. Bruni19a, M. Bruschi19a, T. Buanes13, F. Bucci49, J. Buchanan118, N.J. Buchanan2,
P. Buchholz141, R.M. Buckingham118, A.G. Buckley45, S.I. Buda25a, I.A. Budagov65,
B. Budick108, V. B¨uscher81, L. Bugge117, D. Buira-Clark118, O. Bulekov96, M. Bunse42,
T. Buran117, H. Burckhart29, S. Burdin73, T. Burgess13, S. Burke129, E. Busato33, P. Bussey53,
C.P. Buszello166, F. Butin29, B. Butler143, J.M. Butler21, C.M. Buttar53, J.M. Butterworth77,
W. Buttinger27, T. Byatt77, S. Cabrera Urb´an167, D. Caforio19a,19b, O. Cakir3a, P. Calafiura14,
G. Calderini78, P. Calfayan98, R. Calkins106, L.P. Caloba23a, R. Caloi132a,132b, D. Calvet33,
S. Calvet33, R. Camacho Toro33, P. Camarri133a,133b, M. Cambiaghi119a,119b, D. Cameron117,
S. Campana29, M. Campanelli77, V. Canale102a,102b, F. Canelli30, A. Canepa159a, J. Cantero80,
L. Capasso102a,102b, M.D.M. Capeans Garrido29, I. Caprini25a, M. Caprini25a, D. Capriotti99,
M. Capua36a,36b, R. Caputo148, C. Caramarcu25a, R. Cardarelli133a, T. Carli29, G. Carlino102a,
L. Carminati89a,89b, B. Caron159a, S. Caron48, G.D. Carrillo Montoya172, A.A. Carter75,
J.R. Carter27, J. Carvalho124a,h, D. Casadei108, M.P. Casado11, M. Cascella122a,122b,
C. Caso50a,50b,∗, A.M. Castaneda Hernandez172, E. Castaneda-Miranda172,
V. Castillo Gimenez167, N.F. Castro124a, G. Cataldi72a, F. Cataneo29, A. Catinaccio29,
J.R. Catmore71, A. Cattai29, G. Cattani133a,133b, S. Caughron88, D. Cauz164a,164c, P. Cavalleri78,
D. Cavalli89a, M. Cavalli-Sforza11, V. Cavasinni122a,122b, F. Ceradini134a,134b, A.S. Cerqueira23a,
A. Cerri29, L. Cerrito75, F. Cerutti47, S.A. Cetin18b, F. Cevenini102a,102b, A. Chafaq135a,
D. Chakraborty106, K. Chan2, B. Chapleau85, J.D. Chapman27, J.W. Chapman87, E. Chareyre78, D.G. Charlton17, V. Chavda82, C.A. Chavez Barajas29, S. Cheatham85, S. Chekanov5,
S.V. Chekulaev159a, G.A. Chelkov65, M.A. Chelstowska104, C. Chen64, H. Chen24, S. Chen32c,
T. Chen32c, X. Chen172, S. Cheng32a, A. Cheplakov65, V.F. Chepurnov65,
R. Cherkaoui El Moursli135e, V. Chernyatin24, E. Cheu6, S.L. Cheung158, L. Chevalier136,
G. Chiefari102a,102b, L. Chikovani51, J.T. Childers58a, A. Chilingarov71, G. Chiodini72a,
M.V. Chizhov65, G. Choudalakis30, S. Chouridou137, I.A. Christidi77, A. Christov48,
D. Chromek-Burckhart29, M.L. Chu151, J. Chudoba125, G. Ciapetti132a,132b, K. Ciba37,
A.K. Ciftci3a, R. Ciftci3a, D. Cinca33, V. Cindro74, M.D. Ciobotaru163, C. Ciocca19a,19b,
A. Ciocio14, M. Cirilli87, M. Ciubancan25a, A. Clark49, P.J. Clark45, W. Cleland123,
J.C. Clemens83, B. Clement55, C. Clement146a,146b, R.W. Clifft129, Y. Coadou83,
M. Cobal164a,164c, A. Coccaro50a,50b, J. Cochran64, P. Coe118, J.G. Cogan143, J. Coggeshall165,
E. Cogneras177, C.D. Cojocaru28, J. Colas4, A.P. Colijn105, C. Collard115, N.J. Collins17,
C. Collins-Tooth53, J. Collot55, G. Colon84, P. Conde Mui˜no124a, E. Coniavitis118, M.C. Conidi11,
M. Consonni104, V. Consorti48, S. Constantinescu25a, C. Conta119a,119b, F. Conventi102a,i,
J. Cook29, M. Cooke14, B.D. Cooper77, A.M. Cooper-Sarkar118, N.J. Cooper-Smith76, K. Copic34,
T. Cornelissen50a,50b, M. Corradi19a, F. Corriveau85,j, A. Cortes-Gonzalez165, G. Cortiana99,