This content has been downloaded from IOPscience. Please scroll down to see the full text.
Download details:
IP Address: 95.183.245.177
This content was downloaded on 05/05/2015 at 12:24
Please note that terms and conditions apply.
Investigation of effect of x in Yb1-xGdxBa2Cu3O7-y superconducting structures on upper critical magnetic field and coherence length
View the table of contents for this issue, or go to the journal homepage for more 2009 J. Phys.: Conf. Ser. 153 012007
Investigation of effect of x in Yb
1-xGd
xBa
2Cu
3O
7-ysupercon-ducting structures on upper critical magnetic field and
coher-ence length
Ş. Çelik1, K. Öztürk2 and E. Yanmaz2
1 Rize University, Faculty of Arts and Sciences, Department of Physics, Rize, Turkey.
2 Karadeniz Technical University, Faculty of Arts and Sciences, Department of Physics,
Trab-zon, Turkey.
E-mail: [email protected]
Abstract. The resistivity measurements of the Yb1-xGdxBa2Cu3O7-y superconducting samples
prepared by using the solid-state reaction technique for x=0.0, 0.2, 0.4, 0.6, 0.8 and 1.0 were performed in QD-PPMS system under different magnetic fields up to 5T in zero field cooling regime. The upper magnetic field Hc2(T=0) for each sample was calculated from 50% of the
normalized resistivity (Rn) by the extrapolation Hc2(T) to T=0K and the coherence lengths
ξ(T=0) of the samples were calculated from the Hc2(0) values. The examination of the effects
of x in the composition on Hc2(0) showed us that the upper critical magnetic field decreased
from 186.31T for x=0.0 to 37.99T for x=1.0 with the increasing of content x from x=0.0 to 1.0. Using the content x in the composition, the upper critical magnetic field can be controlled and this can be used in superconducting application especially as a superconducting relays.
1. Introduction
Superconducting materials, such as YBCO and BSCCO, must operate at high currents and magnetic fields for many practical applications. Typical large scale applications of them are magnets, power transmission lines, transformers and generators because superconductors have smaller power losses compared to the metals. For these applications, one of the important properties of the superconducting materials is the upper critical magnetic field. The upper critical magnetic field Hc2(0) that the material keep its superconductivity is the huge magnetic field at zero temperature for that material. In the higher magnetic field than Hc2(0), the material loses its superconductive properties at zero temperature. Many of the studies up to now have been on the development of the transition temperature Tc, Hc2(0) and the critical current density Jc of the superconducting structures.
Some researchers studied the effects of the substitution of the rare earth atom with Y in the poly-crystalline or crystal superconducting structure of YBa2Cu3O7 (Y123). In the studies, the substitution of RE atoms (RE: Nd, Sm, Eu, Gd) in RE123 structure showed that they are effective in achieving high value of critical current density (Jc) in a high magnetic field region accompanied by the secon-dary peak effect [1]. While the substitution of rare earth atoms (except Ce, Pr, Tb, Pm) for Y in YBa2Cu3O7-y (Y-123) preserves the 90K superconductivity [2], the same substitution changes the criti-cal current density Jc and the upper critical magnetic field Hc2. One of the factors affecting Jc and Hc2 is the fabrication processes such as calcinating and sintering processes [3]. When the sintering ture of the superconducting structure is taken very lower than the peritectic decomposition tempera-ture, the structure has the weak-link interaction or its superconductivity disappear. While the strong and weak interactions in the same superconducting sample are under control, the upper critical mag-netic field of the sample can be assigned at the desired value in the specific range of magmag-netic field
superconducting material of Yb1-xGdx Ba2Cu3O7 (Yb, Gd)123 for x=0.0, 0.2, 0.4, 0.6, 0.8 and 1.0. Because the peritectic decomposition temperature of Gd123 structure is 975°C [4] and Yb123 is 910°C [5], the sintering temperature of the sample was selected as 890°C to fabricate Yb123 with strong interaction and Gd123 with weak interaction in the same composition. Using the content x, the amounts of both interactions were thought to change and to control upper critical magnetic field of the sample.
Although numerous studies have been undertaken on the pinning properties of melt processed Yb123 [6] with finely dispersed Y211, the effect of x in Yb1-xGdxBa2Cu3O7 polycrystalline structure on the activation energy and the c-lattice parameter [7, 8], the effect of x of Y1-xGdx/2Ybx/2Ba2Cu3O7 superconducting structures on the activation energy [9] and the upper critical magnetic field [10], the effect of Gd diffusion into Y123 [11, 12], and Yb diffusion into Y123 [13], no studies on the effect of x in such Yb1-xGdxBa2Cu3O7-y polycrystalline superconducting structure on the upper critical magnetic field and the coherence length have been reported.
2. Experimental
The polycrystalline Yb1-xGdxBa2Cu3O7-y ((Yb, Gd)123) superconducting samples were produced by solid state reaction method for the six different x values. After stoichiometric mixtures of Yb2O3, Gd2O3 BaCO3 and CuO for each composition of x were thoroughly ground and calcined at 900ºC in air for 10 h, each mixture was ground again, and pressed into a pellet form with 13mm diameter under 250 MPa pressure, and then each of the samples for x=0, 0.2, 0.4, 0.6, 0.8 and 1 was sintered at 890ºC for 24h in air. Finally, all the samples together were subjected to oxygenation process at 400ºC for 2h, followed to 300 ºC at the rate of -1 ºC /min under the oxygen flowing and then they were cooled to the room temperatures in air. Samples were cut into bar-shape with identical dimensions with the size of 1.5x2.0x6.0 mm3. The sintering and oxygenation temperatures of the samples were obtained from the Differential Thermal Analysis (DTA) model NETZSCH1.
The standard four-probe resistivity of samples were measured by using a physical properties meas-urement system (Quantum Design PPMS system) under various magnetic fields such as 0, 1, 2, 3, 4 and 5T in the zero field cooling regime (ZFC). In order to remove the trapped magnetic field inside the samples, 0.1T magnetic field was applied for a short time at 100K and then decreased to zero field before ZFC regime.
3 Results and Discussions
The measurements of Hc2(T) for the HTSCs have been limited to temperatures near Tc be-cause Hc2 in these materials rapidly exceeds accessible laboratory magnetic fields when the temperature is reduced to only nine-tenths of Tc [14]. Thus the values of Hc2(0) and ξ(0) can be calculated from such data require either a large extrapolation to T=0K using a presumed functional form for Hc2 or calculation of Hc2 from the slope (dHc2/dT)Tc [15] using the Wer-thamer-Helfand-Hohenberg (WHH) expression Hc2(0)=0.7Tc(dHc2/dT)Tc [14]. In this paper, the extrapolation method was used to calculate Hc2(0).
0,0 0,2 0,4 0,6 0,8 1,0 0,0 0,2 0,4 0,6 0,8 1,0 70 75 80 85 90 95 100 0,0 0,2 0,4 0,6 0,8 1,0 70 75 80 85 90 95 100 (b) x=0.0 H=0T x=0.0 H=1T x=0.0 H=2T x=0.0 H=3T x=0.0 H=4T x=0.0 H=5T RT,H /R10 0K ,0 T (a) x=0.6 H=0T (d) x=0.6 H=1T x=0.6 H=2T x=0.6 H=3T x=0.6 H=4T (c) x=0.2 H=0T x=0.2 H=1T x=0.2 H=2T x=0.2 H=3T x=0.2 H=4T x=0.2 H=5T RT ,H /R10 0K ,0 T (f) (e) x=0.8 H=0T x=0.8 H=1T x=0.8 H=2T x=0.8 H=3T x=0.8 H=4T x=0.4 H=0T x=0.4 H=1T x=0.4 H=2T x=0.4 H=3T x=0.4 H=4T x=0.4 H=5T RT,H /R10 0K ,0 T T (K) x=1.0 H=0T x=1.0 H=1T x=1.0 H=2T x=1.0 H=3T x=1.0 H=4T T (K)
Figure 1. Shows the normalized resistivity versus temperature plots under different
mag-netic fields up to 5T for the sample a) x=0.0, b) x=0.2, c) x=0.4, d) x=0.6, e) x=0.8 and f) x=1.0
Using the R-T plots in Figure 1, of which the detailed explanations were given in our previous pa-per in ref [7], the uppa-per critical magnetic field can be calculated from the expression below [16, 17]:
0 c2 2 H (T) 2 (T) φ = πξ (1)
Where φ0 is the flux quantum (φ0=2,067833636x10⁻¹⁵Tm2), and ξ(T) is the coherence length at the temperature T [16, 17]. The dependency of ξ on temperature is given by:
1 2 c 0 T (T) 1 T − ξ = ξ − (2)
Where ξ0 is the coherence length (ξ(0)) at the temperature of T=0K. When the Equation (2) is replaced with ξ in the Equation (1), the upper critical magnetic field at temperature close to Tc can be rewritten as below:
Equation (4). In the study of Müller and his friends [19], they used the magnetic field and the temperature values (as H10, H50 and H90) were defined when the resistance of the sample is 10, 50 and 90% of the normal-state resistance Rn, respectively. After the comparison of the upper critical magnetic fields of 10, 50 and 90% of Rn with the fields obtained from dc magnetiza-tion and ac susceptibility measurements, they showed us that H90 agrees with the result ob-tained from magnetization, whereas Hc2 which determined from susceptibility coincides with the H10 for MgB2. On the other hand, in the study of Ando and his friends [18], they associ-ated H50 with the mean-field upper critical magnetic field Hc2.
82 84 86 88 90 92 0 1 2 3 4 5 Hc2 (T ) T x=0.0 x=0.2 x=0.4 x=0.6 x=0.8 x=1.0
Figure 2. Shows the Hc2(T) versus Tc(H) calculated from R-T plots for the samples under different magnetic fields.
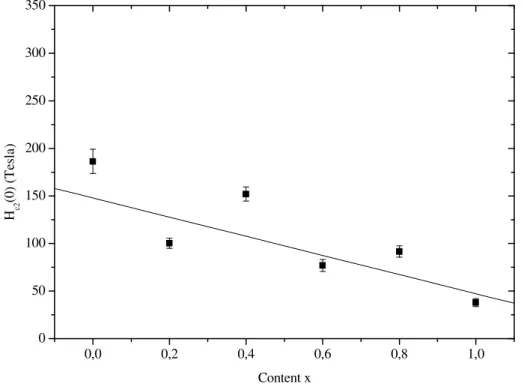
In this paper, we calculated the upper critical magnetic field such as Hc2(T) and T values at which the normalized resistivity equal to 50% of Rn using the R-T plots in Figure 1, and Hc2(T) versus T plots were shown in Figure 2. In this figure, each dot corresponds to the up-per critical magnetic field for the samples at the different critical transition temup-perature Tc under different applied magnetic fields. After the linear fittings of the plots in Figure 2, Hc2(0) values for the samples were calculated using the extrapolation of Hc2(T) to T=0K. Hc2(0) ver-sus content x was shown in Figure 3.
0,0 0,2 0,4 0,6 0,8 1,0 0 50 100 150 200 250 300 350 H c2 (0 ) (T es la ) Content x
Figure 3. Shows Hc2(0) values versus content x. Solid line in the plot is the linear fitting.
When the Figure 3 was generally examined, it was resulted that the value of the Hc2(0) is roughly decreasing with the increasing of the content x. While content x is increasing, not only is the amount of content Yb decreasing, but also that of content Gd is increasing. So, it is resulted in decreasing of Hc2(0) value with increasing of content x. This says us that Yb123 structure is more resistive than Gd123 structure against to the higher magnetic fields in this study. In fact, this is not unusual result of Gd123 structure due to the sintering temperature. Because Yb123 liquidation temperature which is 910°C [5], the sintering temperature of the composition was estimated as 890°C and also this is very low sintering temperature for Gd123 structure. While this temperature is very suitable for Yb123, it is also near enough below sintering temperature of Gd123 structure. The decreasing of Hc2(0) with the increasing of the content x shows us that this sintering temperature resulted the weak interaction between grains in Gd123 and also strong interaction in Yb123 structures.
The separation from the linearity in the plot in Figure 3 is thought to originate from the ex-trapolations which are used to calculate Hc2(0). In the extrapolation of plots in Figure 3 to calculate Hc2(0), only five different magnetic fields up to 5T were used. Higher magnetic fields than 5T is not possible in our laboratory. On the other hand, when the Figure 3 is exam-Journal of Physics: Conference Series 153 (2009) 012007 doi:10.1088/1742-6596/153/1/012007
superconducting structure with the strong interaction and Gd123 with the weak interaction between grains. This temperature produced Gd123 with very weak-link interaction in the composition as low as it can keep its superconductivity, on the other side, produced Yb123 with very strong interaction. The effects of both structures in the same composition in this study resulted in the variation of the upper critical magnetic field from 186T to 38 T. While the strong interaction tries to make Hc2 of the sample to be higher, the weak interaction does it to be lower. The greatnesses of two interactions are originated from the quantities of Yb123 and Gd123 structures in the composition. Because these quantities are related to x, the content x can be used to control the upper critical magnetic field. This idea can be understood from the Figure 3. In the figure, there is nearly linear decreasing with the increasing of the content x. 0,0 0,2 0,4 0,6 0,8 1,0 0 5 10 15 20 25 30 35 40 ξ (0 ) (Å ) Content x
Figure 4. Shows the coherence length ξ(0) versus content x. Solid line in the plot
is the linear fitting.
As for the coherence length ξ, it is one of the characteristic parameters of the superconduc-tors. It is a difficult quantity to measure directly, however, it was thus calculated from the expression Hc2(0)=Φ0/2πξ2 and ξ - content x plot is shown in Figure 4. The coherence length is about 16 Å for YBa2Cu3O7-y [21,22], 13.6 Å for Tl-2223 [23,24], 9.7 Å for Bi-2223 and 9±1 Å for Bi-2212 [25], and this value in this study is varying roughly linear from ~13 Å to ~29 Å with increasing of the content x from x=0.0 to x=1.0. The coherence length can be con-trolled by the content x. The separation from the linearity is originated from the separation in Hc2(0) versus content x plot in Figure 3.
From the linear fittings of the plots in Figure 3 and Figure 4, the relationships between Hc2(0) and ξ(0) with content x and the inverse relations are defined below:
Hc2(0)=A+B.x (in T) x is defined in the range of 0-1.0 (5a)
ξ(0)=A´+B´.x (in Ǻ) x is defined in the range of 0-1.0 (5b)
x=A´´+B´´Hc2.(0) Hc2(0) is defined in the range of 38T-186T (6a)
x=A´´´+B´´´.ξ(0) ξ(0) is defined in the range of 13Ǻ-29Ǻ (6b)
Table 1. The constants used in the Eq(5a, 5b, 6a and 6b) with their errors.
Constant Value Error Constant Value Error
A 147.8606 ±5.3237 B -10.0602 ±0.7329
A´ 13.6241 ±0.3387 B´ 7.7089 ±0.7729
A´´ 11.3526 ±2.2226 B´´ -0.0591 ±0.0189
A´´´ -0.5496 ±0.3591 B´´´ 0.0547 ±0.0181
The constants in Equation (5) and Equation (6) are listed in Table 1. Using the content x in Yb1-xGdxBa2Cu3O7-y structure, and the constants in Table 1, Hc2(0) or ξ(0) of the sample with any content x in the range of x=0.0 – 1.0 can be calculated from Equation (5a) and Equation (5b) respectively. On the other hand, it can be calculated that which sample with the desired Hc2(0) or ξ(0) values in the specific range should have the content x using Equation (6a) and Equation (6b) respectively.
4. Conclusion
Using the standard solid-state-reaction technique, the nominal composition of Yb1-xGdxBa2Cu3O7-y superconductor samples for x=0.0, 0.2, 0.4, 0.6, 0.8 and 1.0 were prepared. The upper critical magnetic field Hc2(T) at the temperature T=T for the samples were calcu-lated by the midpoint of the normalized resistivity values obtained from the resistivity meas-urements in the different magnetic fields up to 5T under zero field cooling regime and the upper critical magnetic field Hc2(0) at the temperature T=0K was found by the extrapolation Hc2(T) to T=0K. The coherence length values were calculated by using the upper critical magnetic field values at the temperature T=0K.
The calculations presented us that while the coherence length is 16 Ǻ for Y123, 13.6 Ǻ for Tl2223, 9.7 Ǻ for Bi2223and ~9 Ǻ for Bi2212, this value in this study varies from ~13 Ǻ to ~29 Ǻ and Hc2(0) is varying from 186 T to 38 T with increasing content x from x=0.0 to 1.0.
In our study it was found that there are two interactions in the composition and they are the strong interaction in Yb123 and the weak interaction in Gd123 structure. The quantities of both interactions were changed with the content x because the amount of Yb123 is decreased and that of Gd123 is increased with the increasing of the content x. The quantities of Yb123 and Gd123 structures in the composition supplied us to control the upper critical magnetic field in the identical range of 37T-186T. Consequently, using the content x in Yb1-xGdxBa2Cu3O7-y structure, Hc2(0) or ξ(0) of the sample with any content x between 0.0 – 1.0 can be calculated from the Equation (5a) and Equation (5b) respectively. On the other hand, it can be calculated that which sample with the desired Hc2(0) or ξ(0) values in the specific range should have the content x using Equation (6a) and Equation (6b) respectively. By this way, we don’t need to produce and measure the sample with any other content x in the range of 0.0-1.0 to find Hc2(0) and ξ(0). In addition, this study showed us that the upper critical magnetic field can be controlled using the content x in our compositions and this controlling of the upper critical magnetic field can be used in the application of superconductivity as an Journal of Physics: Conference Series 153 (2009) 012007 doi:10.1088/1742-6596/153/1/012007
[4] Nariki S, Sakai N, Inoue K and Murakami M, 2003 Physica C 392 468
[5] Won C, Kinder L R, Gim Y, Fan Y, Coulter J Y, Maley M P, Foltyn S R, Peterson D E and Jia Q X, 1999 Appl. Supercond. 9 (2) 1575
[6] Mochida T, Sakai N, Yoo S I and Murakami M, 2002 Physica C 366 229 [7] Çelik Ş, Öztürk K and Yanmaz E, 2008 J. Alloys Compd. 456 1
[8] Çelik Ş, Thesis Ph D, Karadeniz Technical University, June 2006, Trabzon, Turkey. [9] Çelik Ş, Öztürk K, Çevik U and Yanmaz E, 2008 J. Alloys Compd. 460 79
[10] Çelik Ş, Öztürk K and Yanmaz E, 2008 J. Alloys Compd. 458 30
[11] Öztürk K, Çelik Ş, Çevik U and Yanmaz E 2007 J. Alloys Compd. 433 46 [12] Öztürk K, Çelik Ş and Yanmaz E, 2008 J. Alloys Compd. 462 19
[13] Öztürk K, Çelik Ş, Çevik U and Yanmaz E, 2008 J. Alloys Compd. 456 34
[14] Osofsky M S, Soulen R J, Wolf S A, Broto J M, Rakoto J M, Ousset J C, Coffe G, Askenazy S, Pari P, Bozovic I, Eckstein J N and Virshup G F, 1993 Phys. Rev. Lett. 71 14
[15] Helfand E, Werthamer N R and Hohenberg P C, 1966 Phys. Rev. 147 295
[16] Thinkam M, 1996 Introduction to Superconductivity, Second Ed. McGraw-Hill New York 118
[17] Shigeta I, Abiru T, Abe K, Nishida A and Matsumoto Y, 2003 Physica C 392 359 [18] Ando Y, Boebinger G S, Passner A, Schn L F, Kimura T, Okuya M, Watauchi S,
Shi-moyama J, Kishio K, Tamasaku K, Ichikawa N and Uchida S, 1999 Phys. Rev. B 60 17.
[19] Müller K H, Fuchs G, Handstein A, Nenkov K, Narozhnyi V N and Eckert D, 2001 J.
Alloys Compd. 322 L10
[20] Sekitani T, Miura N, Ikeda S, Matsuda Y H and Shiohara Y, 2004 Physica B 346 319 [21] Welp U, Kwok W K, Crabtree G W, Vandervoort K G and Liu J Z, 1989 Phys. Rev.
Lett. 62 1908
[22] Hao Z, Clem J R, McElfresh M W, Civale L, Malozemoff A P and Holtzberg F, 1991
Phys. Rev. B 43 2844
[23] Brandstatter G, Sauerzopf F M, Weber H W, Ladenberger F and Schwarzmann E, 1994
Physica C 235 1845
[24] Thompson J R, Ossandon J G, Christen D K, Chakoumakos B C, Sun Y R, Parantha-man M and Brynestad J, 1993 Phys. Rev. B 48 14031
[25] Li Q, Suenaga M, Hikata T and Sato K, 1992 Phys. Rev. B 46 5857