163
Cilt 23, Özel Sayı, 163-168, 2019DOI: 10.19113/sdufenbed.511799
Using Fuzzy Set Theory in the Comparison of Customer Satisfaction Levels
Nur AYVAZ ÇAVDAROĞLU
Kadir Has Üniversitesi, İşletme Fakültesi, İşletme Bölümü, 34083, İstanbul (ORCID: https://orcid.org/0000-0003-1240-1357)
(Alınış / Received: 11.01.2019, Kabul / Accepted: 15.02.2019, Online Yayınlanma / Published Online: 17.03.2019)
Keywords
Sharing economy, Customer satisfaction, Fuzzy set theory, New business model
Abstract: Customer satisfaction is the key to the survival and profitability of all
businesses. In the ever-changing business world, this concept has gained more importance. In particular, in industries where new firms based on new business models emerge, the traditional firms find it more difficult to compete with the new business models in terms of customer happiness. Sharing economy, which is defined as “renting non-frequently used resources (e.g. houses, cars, various commodities) in return of a certain price via digital platforms”, is one of these new concepts that have inspired new business models. A sharing economy-based company, Uber, has gained popularity in a short time. In this study, customer satisfaction levels of Uber and classical taxi firms are compared and the performance of each firm in various service dimensions is measured. Data is collected via questionnaires and analyzed using the fuzzy set theory models. According to the results, Uber performs much higher in all service dimensions with respect to the classical taxi firms. By evaluating the results from a managerial perspective, recommendations are developed for Uber and similar sharing economy-based firms, and the classical firms who want to compete with these new business models.
Bulanık Küme Teorisinin Müşteri Memnuniyeti Karşılaştırmasında Kullanılması
Anahtar KelimelerPaylaşım ekonomisi, Müşteri memnuniyeti, Bulanık küme teorisi,
Yeni iş modeli
Özet: Müşteri memnuniyeti tüm işletmelerin hayatta kalması ve kâr edebilmesi
için elzemdir. Sürekli değişen iş dünyasında bu konsept daha da önem kazanmaktadır. Özellikle yeni iş modellerine dayanan firmaların ortaya çıktığı sektörlerde klasik şirketler müşteri mutluluğu açısından yeni şirketlerle rekabet etmekte zorlanmaktadırlar. Az kullanılan kaynakların (ör: ev, araba, çeşitli eşyalar vs.) dijital platformlar yardımıyla belli ücretlerle kiralanması olarak tanımlanabilecek olan paylaşım ekonomisi, bu şekilde yeni iş modellerie ilham veren konseptlerdendir. Paylaşım ekonomisi tabanlı firmalardan biri olan Über, kısa zamanda popülerlik kazanmıştır. Bu çalışmada, Über ve klasik taksi firmaları müşteri memnuniyeti açısından karşılaştırılarak iki tip firmanın çeşitli hizmet boyutlarında nasıl performans gösterdiği ölçülmektedir. Veri toplama anket yöntemiyle gerçekleştirilmiş olup veri analizinde ise bulanık küme teorisi kullanılmıştır. Elde edilen sonuçlara göre Über bütün hizmet boyutlarında klasik taksi firmalarına göre çok daha yüksek müşteri memnuniyetine sahiptir. Sonuçlar değerlendirilerek Über ve benzeri paylaşım ekonomisi tabanlı firmalara ve onlarla rekabet edebilmek isteyen klasik iş modellerine sahip firmalara çeşitli yönetimsel önerilerde bulunulmuştur.
1. Introduction
Sharing economy is defined as a peer-to-peer model of distributing underutilized resources via a fee-based agreement that is realized using digital platforms [1]. The underlying principle in the sharing economy is to meet the underutilized resources (for
instance, a house that is uninhibited most of the time, a car that is not used every day, some house appliances that are not used in daily life, etc.) with the people who need them over a certain time period. The sharing economy concept which is built upon this principle is gaining popularity all over the world, and the firms who create new business models using this
164
concept, such as AirBnb and Uber, are growing bigger every day.Although sharing economy has gained importance in the last decade, not much is done on this topic so far in terms of scientific research. To our knowledge there is no study focusing on how the firms working according to the sharing economy principles are better off or worse than the classical firms in the same sector in terms of customer satisfaction. It is evident that customer satisfaction is the key to a successful and profitable growth of a company, and a firm must pay attention to the aspects of its business which raises complaints among the customers. This study focuses on Uber, one of the important firms operating on the sharing economy principles, and aims to create an understanding for similar firms as well as the classical firms who are in competition with them in terms of creating better customer satisfaction levels.
Uber is a transportation company which was founded in 2009 in San Francisco and is now operating in 45 countries. Uber users and drivers get into contact by using an Uber app in digital platforms, and Uber receives a commission over each ride. Since Uber prices are on average 26% cheaper than regular taxi service and since Uber creates a higher customer satisfaction, Uber has gained popularity in a short time [2]. However, there has been no work so far regarding which of the services Uber provides to its customers are more appealing and what is the main reason why Uber is preferred to normal taxi. With this work, it will be evident how the customers are evaluating Uber across various service dimensions, and the weak and strong aspects of Uber and the classical taxi firms. The method which is used to conduct the analysis is the fuzzy logic.
The fuzzy logic is a theory which takes into account the fact that people do not have exact opinions in an uncertain world where there are no absolute answers and the facts are changing dynamically. The fuzzy set theory was first developed by Zadeh [3], then it was presented as a decision-making methodology by Bellman and Zadeh [4], and has been used in a number of problems in various sectors and fields since then. For instance, Büyüközkan et al. [5] apply fuzzy set theory to perform capacity planning in a logistics company, Thomassey et al. [6] use fuzzy logic for forecasting in textile industry, Hwang and Yu [7] apply the same theory for project management of R&D projects and Bottani and Rizzi [8] perform quality control using the fuzzy logic techniques. The fuzzy set theory has also been used extensively in measuring the customer satisfaction levels in the transportation industry. For instance, Çelik vd. [9] evaluated the public transportation modes in Istanbul by using a type-2 fuzzy logic model which is formed by integrating TOPSIS and GRA methods, and found
that the metrobuses, despite their several problematic aspects, were the most effective mode of transport in terms of customer satisfaction. Tsaur et al. [10] analyzed the data they collected via distributing a questionnaire to tour operators by using fuzzy logic and TOPSIS methods, and measured the service quality of three different airline companies. Chou et al. [11] again used survey data and weighted fuzzy SERVQUAL method to evaluate a Taiwanese airline from the customer satisfaction perspective. Pakdil and Aydın used fuzzy logic theory and SERVQUAL method to measure how optimistic, pessimistic or normal customers would evaluate the airline service quality [12].
In this study, the fuzzy set theory is used to evaluate the customer satisfaction levels across several service dimensions in Uber and normal taxi. Since customer satisfaction is an area where the same words (e.g. service quality perception as “good”) could translate into different satisfaction levels for different customers, fuzzy logic would be an appropriate fit to evaluate this performance measure. For this purpose, a survey is conducted on Uber and normal taxi customers asking them to evaluate several service quality dimensions of both types of firms. The detailed information about the questionnaire and data analysis is presented in Section 2. The results of the analysis are elaborated in Section 3. This study is a pioneer in the topic of the sharing economy and the results will be illuminating for the researchers and the entrepreneurs who will be active in the same area.
2. Material and Method
The methodology to be used in this study is fuzzy logic theory. By using this method, the survey data is analyzed and the results are interpreted from a managerial perspective.
2.1. Fuzzy set theory
The fuzzy set theory is based upon fuzzy numbers. It was first defined by Zadeh [3]. According to this theory, people tend to think about the facts in decision making using “linguistic variables” rather than certain numbers as 0 and 1. For instance, they define their views about the quality of a service by using expressions as “very bad, bad, average, good, very good”. However, if they are asked to evaluate the same service by using a grade between 0 and 100, two people using the same linguistic variable (e.g. “average”) could be observed to make quite distinct numerical evaluations (for instance one participant giving a grade of 40 while the other giving 70). Fuzzy set theory aims to convert the linguistic variables to quantitative values by taking into account the uncertainty in the decision making process of people. Working by the principle of some
165
kind of a confidence interval, the fuzzy numbers can be defined by taking into account the variations in the human expressions. For instance, a triangular fuzzy number that corresponds to the linguistic variable “average” can be defined as 𝑌 = (𝑐, 𝑎, 𝑏) = (2,3,4), indicating that the decision makers grade a service they refer to as “average” by a numerical value of minimum 2, on average 3, and maximum 4. Moreover, several arithmetic operations can be defined on fuzzy numbers depending on the form of the number. For instance,The addition operation on triangular fuzzy numbers: (𝐿1, 𝑀1, 𝑈1) ⊕ (𝐿2, 𝑀2, 𝑈2)
= (𝐿1+ 𝐿2, 𝑀1+ 𝑀2, 𝑈1
+ 𝑈2)
(1) The multiplication operation on triangular fuzzy numbers:
(𝐿1, 𝑀1, 𝑈1) ⊙ (𝐿2, 𝑀2, 𝑈2)
= (𝐿1𝐿2, 𝑀1𝑀2, 𝑈1𝑈2) (2)
The subtraction operation on triangular fuzzy numbers:
(𝐿1, 𝑀1, 𝑈1) ⊖ (𝐿2, 𝑀2, 𝑈2)
= (𝐿1− 𝐿2, 𝑀1− 𝑀2, 𝑈1
− 𝑈2)
(3) are defined as in the above formulations.
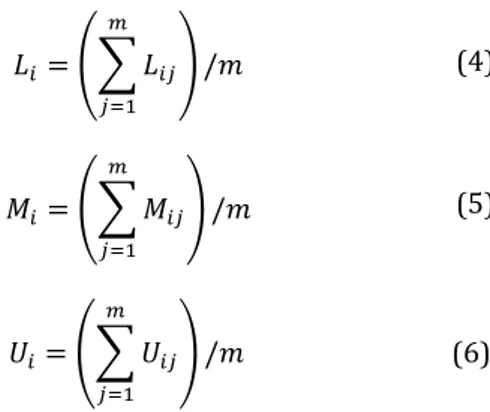
By these operations it is possible to evaluate the minimum, average and maximum values of each triangular fuzzy number that would define the customer satisfaction level of a service dimension. For instance, suppose that the survey was conducted to measure the service quality of i service dimensions by the participation of m people. Let 𝐸𝑖𝑗 =
(𝐿𝑖𝑗, 𝑀𝑖𝑗, 𝑈𝑖𝑗) be the triangular fuzzy number which
defines the value of participant j on the service dimension i. The overall value of service dimension i will be represented by the fuzzy number 𝐸𝑖=
(𝐿𝑖, 𝑀𝑖, 𝑈𝑖), which can be computed according to the
following formulas developed by Buckley [13]: 𝐿𝑖= (∑ 𝐿𝑖𝑗 𝑚 𝑗=1 ) /𝑚 (4) 𝑀𝑖= (∑ 𝑀𝑖𝑗 𝑚 𝑗=1 ) /𝑚 (5) 𝑈𝑖= (∑ 𝑈𝑖𝑗 𝑚 𝑗=1 ) /𝑚 (6)
Finally, by using a procedure called “defuzzification”, the fuzzy numbers can be converted to crisp real
numbers. The technique that is used for defuzzification in this paper is “the center of area” method, which uses the following formula:
𝐵𝐸𝑖=
[(𝑈𝑖− 𝐿𝑖) + (𝑀𝑖− 𝐿𝑖)]
3 + 𝐿𝑖, ∀𝑖 (7) According to the fuzzy numbers theory, there are several types of fuzzy numbers (e.g. triangular, trapezoidal... etc.) that can be defined. Similarly, various procedures for defuzzification exist such as the center of area, the mean of maximum, α-cut method, etc. For the sake of brevity, different methods will not be discussed here. Similar studies in the past literature have used triangular fuzzy numbers and the center of area method for defuzzification [10, 11, 12]; therefore, the same methods are used in this paper.
2.2. The questionnaire design
The aim of this study is to measure and compare the customer satisfaction levels in various service dimensions of Uber and normal taxi. In this vein, the service dimensions that are evaluated are displayed in Table 1.
Table 1. The dimensions of the service quality
Price Accessibility
Time to arrive at the door Using the shortest route Courtesy
Easiness of the payment method
Appropriateness of the pick-up and drop-off locations Safety
The price dimension refers to the amount of payment for the ride across the same distance. Accessibility is explained as finding a vehicle as soon as desired, while time to arrive at the door is the waiting time until the found vehicle reaches the customer. Using the shortest route is elaborated as “customer’s trust in driver finding the shortest route to destination”. Courtesy refers to the politeness of the driver and using appropriate language/manners. Easiness of the payment method is how customers perceive the efficiency of the payment method they use in reciprocating the service of the driver, while appropriateness of the pick-up and drop-off location is again the customer perception regarding whether they find the location at which the driver takes them in or drops off as suitable, safe, close to their destination point, etc. Finally, safety refers to how safe the customer feels using the services of each company involving the traffic safety (e.g. careful versus careless driving) and personal safety (e.g. whether they feel intimidated by the driver’s approach or not).
For the purposes of the study, 140 participants who used Uber and normal taxi in the past have been reached and they were asked to answer questions to
166
evaluate the service dimensions displayed in Table 1. The demographics of the survey participants are summarized in Table 2.Table 2. The demographics of survey participants
variable %
gender Woman Man 32 68
age 18-25 26-35 36-45 45+ 26 50 18 7 Marital status Married, no kid Single
Married, with kids
49 19 32 Education
Less than high school degree High school degree
College degree Graduate degree 3 25 53 20 Taxi/Uber usage
frequency Weekly Daily Monthly
Less than once in a month 58 34 7 1 How many of the
last 10 taxi rides are with Uber
0-2 3-5 6-8 9-10 20 18 34 28 A 5-point Likert scale was used in the survey questions. According to this scale, the participants indicated their satisfaction level across each one of the service dimensions by one of the options “very bad”, “bad”, “average”, “good” and “very good”. The fuzzy number correspondence of each linguistic variable is displayed in Table 3, which is adapted from Chou et al., who is using a similar 5-point Likert scale [11].
Table 3. Fuzzy correspondences of linguistic variables [3].
Very bad (0.0, 1.0, 2.0) Bad (1.0, 2.0, 3.0) Average (2.0, 3.0, 4.0) Good (3.0, 4.0, 5.0) Very Good (4.5, 5.0, 5.0) 3. Results
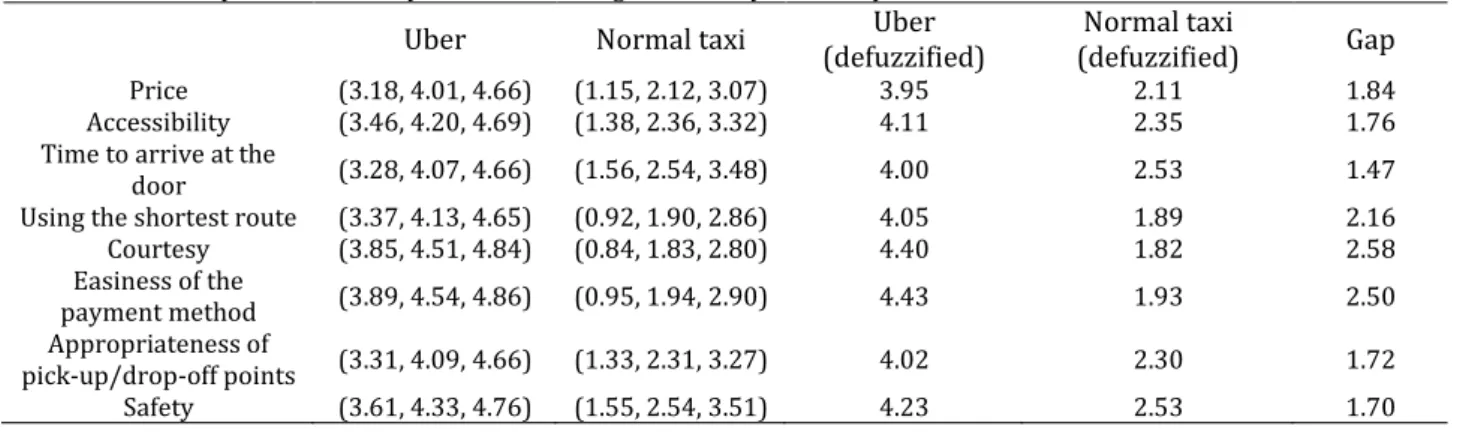
The answers of the survey participants are evaluated and each service dimension of Uber and normal taxi are measured in terms of triangular fuzzy numbers. The results are presented in Table 4.
The first two columns of Table 4 show the overall evaluation of the survey participants for each service dimension of Uber and normal taxi respectively. These numbers are computed using the formulas (4), (5) and (6). The defuzzified numbers are presented in the nest two columns. These numbers are found by the formula in (7). Finally, the last column is the gap between the defuzzified numbers of Uber and normal taxi across each service dimension and show the quality difference from the customers’ perspective. According to the results tabulated in Table 4, Uber’s services are considered as superior to normal taxi services across all service dimensions. However, courtesy, easiness of payment and using the shortest route turn out to be the first three service dimensions Uber makes the most difference with respect to the normal taxi. Uber receives its own lowest score in the price dimension (3.95); however, since normal taxi also receives a relatively low score in this dimension (2.11), the fourth highest gap between the service quality of both types of firms is the price. The service dimension for which the quality gap is lowest is the time to arrive at the door (1.47).
Looking at the rankings within Uber’s own scores, it is found that the highest scores are attained in the easiness of the payment method (4.43) and courtesy (4.40). The fact that Uber allows various payment methods (cash, credit card, Paypal in some countries…) with the help of the Uber app in digital platforms, and the fact that the payment process is shortened by predefining credit card information within the app are the reasons for Uber’s high score in this service dimension. Again, as Uber drivers can be rated over the platform, they have to attain a much more courteous and professional attitude towards the Uber customers, which brings the second highest score of Uber in the courtesy dimension. The ensuing service dimensions Uber received the higher scores are safety (4.23), accessibility (4.11) and using the shortest route (4.05), respectively. Finally, the rest of the service dimensions are ranked as the appropriateness of pick-up/drop off points (4.05), time to arrive at the door (4.00) and price (3.95). When the quality of the service dimensions of the classical taxi firms is considered, it is observed that
Table 4. The analysis of the survey results according to the fuzzy set theory
Uber Normal taxi (defuzzified) Uber (defuzzified) Normal taxi Gap
Price (3.18, 4.01, 4.66) (1.15, 2.12, 3.07) 3.95 2.11 1.84
Accessibility (3.46, 4.20, 4.69) (1.38, 2.36, 3.32) 4.11 2.35 1.76
Time to arrive at the
door (3.28, 4.07, 4.66) (1.56, 2.54, 3.48) 4.00 2.53 1.47
Using the shortest route (3.37, 4.13, 4.65) (0.92, 1.90, 2.86) 4.05 1.89 2.16 Courtesy (3.85, 4.51, 4.84) (0.84, 1.83, 2.80) 4.40 1.82 2.58 Easiness of the payment method (3.89, 4.54, 4.86) (0.95, 1.94, 2.90) 4.43 1.93 2.50 Appropriateness of pick-up/drop-off points (3.31, 4.09, 4.66) (1.33, 2.31, 3.27) 4.02 2.30 1.72 Safety (3.61, 4.33, 4.76) (1.55, 2.54, 3.51) 4.23 2.53 1.70
167
the highest score is attained at the safety (2.53) and the time to arrive at the door (2.53) dimensions. The primary reason for this occurrence is the fact that the customers often use a certain taxi stop to call their taxis, and regard that taxi stop as a department where they can file their complaints at. The next service dimensions ranked according to their scores are accessibility (2.35) and the appropriateness of the pick-up/drop-off points (2.30), which strengthens the former claim that working with a taxi stop could enhance the quality perception in the eyes of a customer. The lowest scored service dimensions are using the shortest route (1.89) and courtesy (1.82), again confirming the fact that unlike Uber, taxi drivers have no penalty mechanism in terms of their attitudes towards the customer, leading to lower customer satisfaction levels.4. Discussion and Conclusion
In this study, the customer satisfaction levels of a firm that operates according to the sharing economy principles, Uber, and the classical taxi companies are compared. The results of the analysis are interesting and insightful in many aspects. According to the analysis results tabulated in Table 4, Uber achieves higher customer satisfaction levels in all service dimensions with respect to normal taxi firms. If classical taxi companies would like to compete with Uber and alike in the future, they must prioritize improving service dimensions such as courtesy, easiness of the payment method and finding the best transportation route. All of these dimensions require providing training to taxi drivers for interacting more professionally with the customer and having competence regarding the traffic condition and the geography of the city. Moreover, introducing a public rating system which would allow normal taxi customers to rate and comment on the drivers could help improve the attitude of the taxi chauffeurs. Furthermore, making taxis accept credit card as a payment method mandatory would help improve the customer satisfaction levels.
On the other hand, if the results should be evaluated from the perspective of Uber and similar companies, it must be noted that despite their higher customer satisfaction levels compared to classical taxi firms, these firms need to improve their services in some aspects as well. For instance, they can improve the customer happiness in the price dimension. Uber is known to practice various pricing models in different locations [14]. For instance, when the demand surpasses supply, the “surge pricing” strategy, which aims to balance supply and demand, is utilized. Similarly, offering several transport vehicles that differ in the comfort and luxury helps Uber to do price discrimination. Implementation of these practices by taking into account the social and geographical conditions of each city would improve the customer satisfaction levels. Again, for instance,
determining a standard for pick-up/drop-off points and improving the time to arrive at the door are the issues that need to be focused on by Uber. Due to the “network effect”, which can be defined as the phenomenon that as the number of users of a certain product/service increases, the service quality improves as well, the service quality of Uber in terms of these issues will clearly be enhanced as more people start using Uber [15]. Hence, Uber must pay attention to improving driver happiness, too; so that an increased number of drivers would want to join Uber which in turn brings a higher number of customers who are happier.
Although our study focuses on the comparison of Uber and normal taxi services, it also embodies several insights regarding the competition of classical firms and the firms who are built upon a sharing economy-based new business model. The firms with the new business models often decrease the market share of the older firms. Our study presents the clues that the reason for this occurrence must be searched in the customer satisfaction levels. Hence, if the classical firms want to compete with the new platforms in a stronger fashion, it is evident that they should improve their service levels in the aspects they are lacking the most.
One limitation of our study could be the objectivity of the sample population. Although 140 people is a good number for drawing objective results, the only requirement for questionnaire participation is “having used Uber at least once”. Therefore, the points that were awarded to Uber might be reflecting the average of very few experiences (which are rather good) on some participants’ side. The high gap between the scores of taxi firms and Uber could be due to prolonged bad experiences of the participants in using regular taxi services. Therefore, in order to confirm the objectivity of the results, it would be appropriate to conduct a similar study in a few years’ time when the users have obtained a good amount of travel experience with Uber, too.
Our study can be extended by adding more detailed versions of the service dimensions, by introducing different weights to each service dimension taking into account the customer perspective, by introducing the driver opinions besides the customer opinions, etc. However, despite the limitations, our study is a first to analyze the issues in the sharing economy, which is bound to gain more importance in the future, by using fuzzy logic. We hope to spur more attention to the topic in the future.
References
[1] Frenken, K., Meelen, T., Arets, M., Van der Glind, P. 2015. Smarter Regularion for the Sharing Economy.
http://www.theguradian.com/science/political-168
science/2015/may/20/smaeter-regulation-for-the-sharing-economy. (Access Date: 07.06.2018).[2] Blystone, D. 2018. The Story of Uber. https://www.investopedia.com/articles/person al-finance/111015/story-uber.asp. (Access Date: 07.06.2018)
[3] Zadeh, L. A. 1965. Fuzzy Sets, Information and Control. 8, 338-353.
[4] Bellman, R. E., Zadeh, L. A. 1970. Decision-Making in a Fuzzy Environment. Management Science, 17(4), 141-164.
[5] Buyukozkan, G., Feyzioglu, O., Nebol, E., 2008. Selection of the strategic alliance + partner in logistics value chain. International Journal of Production Economics, 113, 148–158.
[6] Thomassey, S., Happiette, M., Castelain, J.M., 2005. A short and mean-term automatic forecasting system—application textile logistics. European Journal of Operational Research, 161, 275–284.
[7] Hwang, H.-S., Yu, J.-C., 1998. R&D project evaluation model based on fuzzy set priority. Computers and Industrial Engineering, 35, 567– 570.
[8] Bottani, E., Rizzi, A., 2006. Strategic management of logistics service: a fuzzy QFD approach. International Journal of Production Economics
103, 585–599.
[9] Celik, E., Bilisik, O. N., Erdogan, M., Gumus, A. T., Baracli, H. 2013. An Integrated Novel Interval Type-2 Fuzzy MCDM Method to Improve Customer Satisfaction in Public Transportation for Istanbul. Transportation Research Part E: Logistics and Transportation Review. 58, 28-51. [10] Tsaur, S. H., Chang, T. Y., Yen, C. H. 2002. The Evaluation of Airline Service Quality by Fuzzy MCDM. Tourism management, 23(2), 107-115. [11] Chou, C. C., Liu, L. J., Huang, S. F., Yih, J. M., Han, T.
C. 2011. An Evaluation of Airline Service Quality Using the Fuzzy Weighted SERVQUAL Method. Applied Soft Computing, 11(2), 2117-2128. [12] Aydin, O., Pakdil, F. 2008. Fuzzy SERVQUAL
Analysis in Airline Services. Organizacija, 41(3), 108-115.
[13] Buckley, J. J. 1985. Ranking Alternatives Using Fuzzy Numbers. Fuzzy Sets and Systems, 15(1), 21-31.
[14] Dholakia, U. 2015. Everyone Hates Uber’s Surge Pricing – Here’s How to Fix It. Harvard Business Review. https://hbr.org/2015/12/everyone-hates-ubers-surge-pricing-heres-how-to-fix-it. (Access Date: 07.06.2018)
[15] Investopedia, n.d. Network Effect. https://www.investopedia.com/terms/n/netwo rk-effect.asp. (Access Date: 07.06.2018)