JHEP01(2015)069
Published for SISSA by SpringerReceived: September 23, 2014 Revised: November 11, 2014 Accepted: November 21, 2014 Published: January 14, 2015
Search for the b¯
b decay of the Standard Model Higgs
boson in associated (W/Z)H production with the
ATLAS detector
The ATLAS collaboration
E-mail: [email protected]
Abstract: A search for the b¯b decay of the Standard Model Higgs boson is performed
with the ATLAS experiment using the full dataset recorded at the LHC in Run 1. The
integrated luminosities used are 4.7 and 20.3 fb−1 from pp collisions at √s = 7 and 8 TeV,
respectively. The processes considered are associated (W/Z)H production, where W → eν/µν, Z → ee/µµ and Z → νν. The observed (expected) deviation from the background-only hypothesis corresponds to a significance of 1.4 (2.6) standard deviations and the ratio of the measured signal yield to the Standard Model expectation is found to be µ = 0.52 ± 0.32 (stat.) ± 0.24 (syst.) for a Higgs boson mass of 125.36 GeV. The analysis procedure is
validated by a measurement of the yield of (W/Z)Z production with Z → b¯b in the same
final states as for the Higgs boson search, from which the ratio of the observed signal yield to the Standard Model expectation is found to be 0.74 ± 0.09 (stat.) ± 0.14 (syst.).
Keywords: Hadron-Hadron Scattering
JHEP01(2015)069
Contents
1 Introduction 1
2 The ATLAS detector 3
3 Data and simulated samples 3
4 Object reconstruction 6
5 Event selection 8
6 Multivariate analysis 14
7 Background composition and modelling 21
7.1 Multijet background 21
7.2 Corrections to the simulation 23
7.3 Distributions in the dijet-mass analysis 25
7.4 Distributions in the multivariate analysis 29
8 Systematic uncertainties 34
8.1 Experimental uncertainties 34
8.2 Uncertainties on the multijet backgrounds 35
8.3 Uncertainties on the modelling of the simulated backgrounds 36
8.4 Uncertainties on the signal modelling 40
9 Statistical procedure 42
9.1 General aspects 42
9.2 Technical details 44
9.3 Cross checks using diboson production 46
10 Analysis of the 7 TeV data 50
10.1 Object reconstruction 50
10.2 Event selection 50
10.3 Background composition and modelling 50
10.4 Systematic uncertainties 51
10.5 Statistical procedure 51
11 Results 53
11.1 Nominal results 53
11.2 Cross-check with the dijet-mass analysis 55
11.3 Cross-check with the diboson analysis 58
JHEP01(2015)069
A Tables of event yields 61
The ATLAS collaboration 71
1 Introduction
For decades, the Higgs boson [1–4] of the Standard Model (SM) remained an unconfirmed
prediction. In July 2012, the ATLAS and CMS experiments at the LHC reported the observation of a new particle with a mass of about 125 GeV and with properties consistent
with those expected for the SM Higgs boson [5,6]. Since then, more precise measurements
have strengthened the hypothesis that the new particle is indeed a Higgs boson [7–9].
These measurements, however, have been mainly performed in the bosonic decay modes of the new particle (H → γγ, H → ZZ, and H → W W ). It is also essential to verify whether it decays into fermions as predicted by the Standard Model. Recently, the CMS Collaboration reported evidence for the τ τ decay mode of the Higgs boson at a level of
significance of 3.4 standard deviations (σ) for mH = 125 GeV [10].
The H → bb decay mode is predicted in the SM to have a branching ratio of 58%
for mH = 125 GeV [11]. Accessing H → bb decays is therefore crucial for constraining,
under fairly general assumptions [12], the overall Higgs boson decay width and, in a global
fit to all accessible combinations of Higgs boson production and decay modes, to allow for measurements of absolute Higgs boson couplings. An inclusive search for H → bb is not feasible at hadron colliders because of the overwhelming background from multijet production. In spite of a cross section more than an order of magnitude lower than the dominant gluon-fusion process, associated production of a Higgs boson with a vector boson,
W or Z [13], offers a viable alternative because leptonic decays of the vector boson, W → `ν,
Z → `` (` = e, µ), and Z → νν, can be efficiently used for triggering and background
reduction purposes [14, 15]. The CDF and D0 experiments at the Tevatron reported an
excess of events in their search for associated (W/Z)H production in the H → bb decay
mode at a significance level of 2.8σ for mH = 125 GeV [16]. Recently, the CMS experiment
reported an excess of events in the H → bb decay mode with a significance of 2.1σ for
mH = 125 GeV [17].
In this paper, a search for associated (W/Z)H production of the SM Higgs boson in the bb decay mode is presented, using the full integrated luminosity accumulated by
ATLAS during Run 1 of the LHC: 4.7 and 20.3 fb−1 from proton-proton (pp) collisions at
centre-of-mass energies of 7 and 8 TeV in 2011 and 2012, respectively. An analysis of the
7 TeV dataset has already been published by ATLAS [18]. In addition to the increase in
the amount of data analysed, the update presented in this paper benefits from numerous analysis improvements. Some of the improvements to the object reconstruction, however, are available only for the 8 TeV dataset, which leads to separate analysis strategies for the two datasets.
JHEP01(2015)069
The analysis is performed for events containing zero, one, or two charged leptons (electrons or muons), targeting the Z → νν, W → `ν, or Z → `` decay modes of the vector boson, respectively. In addition to Z → νν decays, the 0-lepton channel has a smaller but not insignificant contribution from leptonic W decays when the lepton is produced outside of the detector acceptance or not identified. A b-tagging algorithm is used to identify the jets consistent with originating from an H → bb decay. To improve the sensitivity, the three channels are each split according to the vector-boson transverse momentum, the number of jets (two or three), and the number of b-tagged jets. Topological and kinematic selection criteria are applied within each of the resulting categories.
A binned maximum likelihood fit is used to extract the signal yield and the background normalisations. Systematic uncertainties on the signal and background modelling are im-plemented as deviations in their respective models in the form of “nuisance” parameters that are varied in the fit. Each nuisance parameter is constrained by a penalty term in the likelihood, associated with its uncertainty. Two versions of the analysis are presented in this paper: in the first, referred to as the dijet-mass analysis, the mass of the dijet system of b-tagged jets is the final discriminating variable used in the statistical analysis; in the other, a multivariate analysis (MVA) incorporating various kinematic variables in addition to the dijet mass, as well as b-tagging information, provides the final discrimi-nating variable. Because the latter information is not available in similar detail for the 7 TeV dataset, the MVA is used only for the 8 TeV dataset. In both analyses, dedicated control samples, typically with loosened b-tagging requirements, constrain the contribu-tions of the dominant background processes. The most significant background sources are (W/Z)+heavy-flavour-jet production and tt production. The normalisations of these back-grounds are fully determined by the likelihood fit. Other significant background sources are single-top-quark and diboson (W Z and ZZ) production, with normalisations taken from theory, as well as multijet events, normalised using multijet-enriched control samples. Since the MVA has higher expected sensitivity, it is chosen as the nominal analysis for the 8 TeV dataset to extract the final results. To validate the analysis procedures, both for the dijet-mass and MVA approaches, a measurement of the yield of (W/Z)Z production is performed in the same final states and with the same event selection, with H → bb replaced by Z → bb.
This paper is organised as follows. A brief description of the ATLAS detector is
given in section 2. Details of the data and simulated samples used in this analysis are
provided in section3. This is followed by sections describing the dijet-mass and multivariate
analyses applied to the 8 TeV data. The reconstruction of physics objects such as leptons
and jets is addressed in section 4. Section 5 details the event selections applied to the
dijet-mass and multivariate analyses, while section6 explains the construction of the final
discriminating variable of the MVA. Section7discusses the background composition in the
various analysis regions, while the systematic uncertainties are addressed in section8. The
statistical procedure used to extract the results is described in section 9. For the 7 TeV
data, only a dijet-mass analysis is used, and differences with respect to the 8 TeV data
analysis are specified in section10. The results are presented and discussed in section11,
JHEP01(2015)069
2 The ATLAS detector
The ATLAS detector [19] is cylindrically symmetric around the beam axis and is structured
in a barrel and two endcaps. It consists of three main subsystems. The inner tracking de-tector is immersed in the 2 T axial magnetic field produced by a superconducting solenoid. Charged-particle position and momentum measurements are made by pixel detectors
fol-lowed by silicon-strip detectors in the pseudorapidity1 range |η| < 2.5 and by a straw-tube
transition-radiation tracker (TRT) in the range |η| < 2.0. The pixel detectors are crucial for b-tagging, and the TRT also contributes to electron identification. The calorimeters, lo-cated beyond the solenoid, cover the range |η| < 4.9 with a variety of detector technologies. The liquid-argon electromagnetic calorimeters are divided into barrel (|η| < 1.475), endcap (1.375 < |η| < 3.2), and forward (3.1 < |η| < 4.9) sections. The hadronic calorimeters (using scintillator tiles or liquid argon as active materials) surround the electromagnetic calorimeters with a coverage of |η| < 4.9. The muon spectrometer measures the deflection of muon tracks in the field of three large air-core toroidal magnets, each containing eight superconducting coils. It is instrumented with separate trigger and high-precision tracking chambers covering the |η| < 2.4 and |η| < 2.7 ranges, respectively.
The trigger system is organised in three levels. The first level is based on custom-made hardware and uses coarse-granularity calorimeter and muon information. The second and third levels are implemented as software algorithms and use the full detector granularity. At the second level, only regions deemed interesting at the first level are analysed, while the third level, called the event filter, makes use of the full detector read-out to reconstruct and select events, which are then logged for offline analysis at a rate of up to 400 Hz averaged over an accelerator fill.
3 Data and simulated samples
The datasets used in this analysis include only pp collision data recorded in stable beam con-ditions and with all relevant sub-detectors providing high-quality data. The corresponding
integrated luminosities are 4.7 and 20.3 fb−1 [20] for the 7 and 8 TeV data, respectively.
Events in the 0-lepton channel are selected by triggers based on the magnitude ETmissof
the missing transverse momentum vector. The ETmiss trigger configuration evolved during
data taking to cope with the increasing luminosity, and the trigger efficiency was improved
for the 8 TeV data. The dependence of the ETmiss trigger efficiency on the ETmiss
recon-structed offline is measured in W → µν+jets and Z → µµ+jets events collected with
single-muon triggers, with the offline ETmiss calculated without the muon contribution. As
there was a brief period of data-taking in which the ETmiss triggers were not available for
1
ATLAS uses a right-handed coordinate system with its origin at the nominal interaction point (IP) in the centre of the detector and the z-axis coinciding with the axis of the beam pipe. The x-axis points from the IP towards the centre of the LHC ring, and the y-axis points upward. Cylindrical coordinates (r,φ) are used in the transverse plane, φ being the azimuthal angle around the z-axis. The pseudorapidity is defined in terms of the polar angle θ as η = − ln tan(θ/2). The distance in (η,φ) coordinates, ∆R =p(∆φ)2+ (∆η)2, is also
used to define cone sizes. Transverse momentum and energy are defined as pT= p sin θ and ET= E sin θ,
respectively. For the purpose of object selections, η is calculated relative to the geometric centre of the detector; otherwise, it is relative to the reconstructed primary vertex of each event.
JHEP01(2015)069
the first bunch crossings of two bunch trains, the integrated luminosity for the 0-lepton
channel in the 7 TeV dataset is reduced to 4.6 fb−1. Events in the 1-lepton channel are
primarily selected by single-lepton triggers. The ET threshold of the single-electron
trig-ger was raised from 20 to 22 GeV during the 7 TeV data-taking period, and to 24 GeV for
the 8 TeV data. The pT threshold of the single-muon trigger was similarly increased from
18 GeV for the 7 TeV data to 24 GeV at 8 TeV. As the single-lepton triggers for the 8 TeV data include isolation criteria, triggers with higher thresholds (60 GeV for electrons and 36 GeV for muons) but no isolation requirements are used in addition. Single-lepton trigger efficiencies are measured using a tag-and-probe method applied to Z → ee and Z → µµ
events. In the 1-muon sub-channel, ETmiss triggers are also used to compensate for the
lim-ited muon trigger-chamber coverage in some regions of the detector. Events in the 2-lepton channel are selected by a combination of single-lepton, dielectron and dimuon triggers. The thresholds of the dilepton triggers are 12 GeV for electrons and 13 GeV for muons.
Monte Carlo (MC) simulated samples are produced for signal and background
pro-cesses using the atlfast-II simulation [21], which includes a full simulation of the ATLAS
detector based on the geant4 program [22], except for the response of the calorimeters
for which a parameterised simulation is used. A list of the generators used for signal and
background simulations is given in table 1.
The MC generator used for qq-initiated W H and ZH production is pythia8 [23] with
the CTEQ6L1 [24] parton distribution functions (PDFs). The AU2 tune [25, 26] is used
for the parton shower, hadronisation, and multiple parton interactions. The photos
pro-gram [27] is used for QED final-state radiation. The powheg generator [28–30] is used
within the MiNLO approach [31] with the CT10 PDFs [32], interfaced to pythia8 with the
AU2 tune, as a cross-check and to evaluate systematic uncertainties on the signal accep-tance and kinematic properties. It is also used for the generation of gluon-gluon-initiated ZH production at leading order (LO) in QCD, with results cross-checked by an
indepen-dent computation [33]. (For the analysis of the 7 TeV data, the pythia8 generator is used
for gg → ZH.) The transverse momentum distributions of the Higgs boson show substan-tial differences between the two ZH production processes. For qq-initiated W H and ZH production, the total production cross sections and associated uncertainties are computed
at next-to-next-to-leading order (NNLO) in QCD [34–36], and with electroweak
correc-tions at next-to-leading order (NLO) [37]. Additional normalisation-preserving differential
electroweak NLO corrections are applied as a function of the transverse momentum of the
vector boson [38]. For gluon-gluon-initiated ZH production, NLO corrections [39], which
increase the total ZH production cross section by about 5%, are taken into account. The
Higgs boson decay branching ratios are calculated with hdecay [11]. Signal samples are
simulated for Higgs boson masses from 100 to 150 GeV in steps of 5 GeV. All charged-lepton flavours are simulated in the W and Z decays, as leptonic decays of the τ leptons can also be selected in the analysis. For the Higgs boson, only the bb decay mode is considered in the analysis.
The main background processes are (W/Z)+jets and tt production. Version 1.4.1 of
the sherpa generator [40] is used with the CT10 PDFs to simulate W +jets and Z+jets at
JHEP01(2015)069
Process Generator Signal(?) qq → ZH → ννbb/``bb pythia8 gg → ZH → ννbb/``bb powheg+pythia8 qq → W H → `νbb pythia8Vector boson + jets
W → `ν Sherpa 1.4.1 Z/γ∗ → `` Sherpa 1.4.1 Z → νν Sherpa 1.4.1 Top-quark t¯t powheg+pythia t-channel AcerMC+pythia s-channel powheg+pythia W t powheg+pythia Diboson(?) powheg+pythia8 W W powheg+pythia8 W Z powheg+pythia8 ZZ powheg+pythia8
Table 1. The generators used for the simulation of the signal and background processes. (?) For the analysis of the 7 TeV data, pythia8 is used for the simulation of the gg → ZH process, and herwig for the simulation of diboson processes.
performed with the powheg generator with the CT10 PDFs, interfaced with pythia6 [41],
for which the CTEQ6L1 PDFs and the Perugia2011C tune [25, 26] are used. In this
analysis, the final normalisations of these dominant backgrounds are constrained by the data, but theoretical cross sections are used to optimise the selection. The cross sections
are calculated at NNLO for (W/Z)+jets [42] and at NNLO, including resummations of
next-to-next-to-leading logarithmic (NNLL) soft gluon terms, for tt [43].
Additional backgrounds arise from single-top-quark and diboson (W W , W Z, and ZZ) production. For single-top-quark production, the s-channel exchange process and W t pro-duction are simulated with powheg, as for tt, while the t-channel exchange process is
simulated with the AcerMC generator [44] interfaced with pythia6, using the CTEQ6L1
PDFs and the Perugia2011C tune. The cross sections are taken from refs. [45–47]. The
powheg generator with the CT10 PDFs, interfaced to pythia8 with the AU2 tune, is used
for diboson processes [48]. (For the analysis of the 7 TeV data, the herwig generator [49]
is used instead with the CTEQ6L1 PDFs and the AUET2 tune [25, 26], and the cross
sections are obtained at NLO from mcfm [50] with the MSTW2008NLO PDFs [51].)
Events from minimum-bias interactions are simulated with the pythia8 generator with
JHEP01(2015)069
signal and background events according to the luminosity profile of the recorded data. The contributions from these “pile-up” interactions are simulated both within the same bunch crossing as the hard-scattering process and in neighbouring bunch crossings. The resulting events are then processed through the same reconstruction programs as the data.
Additional generators are used for the assessment of systematic uncertainties as
ex-plained in section8.
Simulated jets are labelled according to which generated hadrons with pT > 5 GeV
are found within a cone of size ∆R = 0.4 around the reconstructed jet axis. If a b-hadron is found, the jet is labelled as a b-jet. If not and a c-hadron is found, the jet is labelled as a c-jet. If neither a b- nor a c-hadron is found, the jet is labelled as a light (i.e., u-, d-, or s-quark, or gluon) jet. Simulated V +jet events, where V stands for W or Z, are then categorised according to the labels of the two jets that are used to reconstruct the Higgs boson candidate. If one of those jets is labelled as a b-jet, the event belongs to the V b category. If not and one of the jets is labelled as a c-jet, the event belongs to the V c category. Otherwise, the event belongs to the V l category. Further subdivisions are defined according to the flavour of the other jet from the pair, using the same precedence order: V bb, V bc, V bl, V cc, V cl. The combination of V bb, V bc, V bl and V cc is denoted V +hf. The V cl final state is not included in V +hf because the main production process is gs → W c rather than gluon splitting.
4 Object reconstruction
In this section, the reconstruction of physics objects used in the analysis of the 8 TeV data is presented. Differences relevant for the analysis of the 7 TeV data are reported in
section 10.
Charged-particle tracks are reconstructed with a pT threshold of 400 MeV. The
pri-mary vertex is selected from amongst all reconstructed vertices as the one with the largest
sum of associated-track squared transverse momenta Σp2T and is required to have at least
three associated tracks.
Three categories of electrons [53,54] and muons [55] are used in the analysis, referred to
as loose, medium and tight leptons in order of increasing purity. Loose leptons are selected
with transverse energy ET > 7 GeV. Loose electrons are required to have |η| < 2.47
and to fulfil the “very loose likelihood” identification criteria defined in ref. [54]. The
likelihood-based electron identification combines shower-shape information, track-quality criteria, the matching quality between the track and its associated energy cluster in the calorimeter (direction and momentum/energy), TRT information and a criterion to help identify electrons originating from photon conversions. The electron energies are calibrated
by making use of reference processes such as Z → ee [56]. Three types of muons are included
in the loose definition to maximise the acceptance: (1) muons reconstructed in both the
muon spectrometer and the inner detector (ID); (2) muons with pT> 20 GeV identified in
the calorimeter and associated with an ID track with |η| < 0.1, where there is limited muon-chamber coverage; and (3) muons with |η| > 2.5 identified in the muon spectrometer, and which do not match full ID tracks due to the limited inner-detector coverage. For muons of
JHEP01(2015)069
the first and second type, the muon-track impact parameters with respect to the primary vertex must be smaller than 0.1 mm and 10 mm in the transverse plane and along the z-axis, respectively. Finally, the scalar sum of the transverse momenta of tracks within a cone of size ∆R = 0.2 centred on the lepton-candidate track, excluding the lepton track, is required to be less than 10% of the transverse momentum of the lepton.
Medium leptons must meet the loose identification criteria and have ET > 25 GeV.
Medium muons must be reconstructed in both the muon spectrometer and the inner de-tector and have |η| < 2.5. Tight electrons are required to additionally fulfil the “very tight
likelihood” identification criteria [54]. For both the tight electrons and the tight muons,
more stringent isolation criteria must be satisfied: the sum of the calorimeter energy de-posits in a cone of size ∆R = 0.3 around the lepton, excluding energy associated with the lepton candidate, must be less than 4% of the lepton energy, and the track-based isolation requirement is tightened from 10% to 4%.
Jets are reconstructed from noise-suppressed topological clusters of energy in the
calori-meters [57] using the anti-ktalgorithm [58] with a radius parameter of 0.4. Jet energies are
corrected for the contribution of pile-up interactions using a jet-area-based technique [59]
and calibrated using pT- and η-dependent correction factors determined from simulation,
with residual corrections from in situ measurements applied to data [60, 61]. Further
adjustments are made based on jet internal properties, which improve the energy resolution
without changing the average calibration (global sequential calibration [60]). To reduce the
contamination by jets from pile-up interactions, the scalar sum of the pTof tracks matched
to the jet and originating from the primary vertex must be at least 50% of the scalar sum
of the pT of all tracks matched to the jet. This requirement is only applied to jets with
pT < 50 GeV and |η| < 2.4. Jets without any matched track are retained. The jets kept
for the analysis must have pT > 20 GeV and |η| < 4.5.
To avoid double-counting, the following procedure is applied to loose leptons and jets. First, if a jet and an electron are separated by ∆R < 0.4, the jet is discarded. Next, if a jet and a muon are separated by ∆R < 0.4, the jet is discarded if it has three or fewer matched tracks since in this case it is likely to originate from a muon having showered in the calorimeter; otherwise the muon is discarded. (Such muons are nevertheless included
in the computation of the ETmiss and in the jet energy corrections described in section 5.)
Finally, if an electron and a muon are separated by ∆R < 0.2, the muon is kept unless it is identified only in the calorimeter, in which case the electron is kept.
The MV1c b-tagging algorithm is used to identify jets originating from b-quark frag-mentation. This algorithm combines in a neural network the information from various algorithms based on track impact-parameter significance or explicit reconstruction of
b-and c-hadron decay vertices. It is an improved version of the MV1 algorithm [62–64] with
higher c-jet rejection. Four b-tagging selection criteria (or operating points) are calibrated and used in the analysis, corresponding to average efficiencies of 80%, 70%, 60% and 50%
for b-jets with pT> 20 GeV, as measured in simulated tt events. In this analysis, the 80%,
70% and 50% operating points are denoted loose, medium and tight, respectively. For the tight (loose) operating point, the rejection factors are 26 (3) and 1400 (30) against c-jets and light jets, respectively. For the tight operating point, the c-jet rejection factor is 1.9 times larger than obtained with the MV1 algorithm.
JHEP01(2015)069
The b-tagging efficiencies for b-jets, c-jets and light jets are measured in both data and simulation using dedicated event samples such as tt events for b-jets, events with identified
D∗ mesons for c-jets, or multijet events for light jets. The small differences observed are
used to correct the simulation by so-called “scale factors” (SFs) within intervals between
two operating points. These SFs are parameterised as a function of the jet pTand, for light
jets, also |η|. The SFs are, however, strictly valid only for the generator used to derive them. The differences observed when the efficiencies are measured with different generators are taken into account by additional “MC-to-MC” SFs. Such differences can be caused by, e.g., different production fractions of heavy-flavour hadrons or modelling of their decays.
Because of the large cross sections of V l and V c production, these backgrounds remain significant despite the powerful rejection of non-b-jets by the b-tagging algorithm. It is im-practical to simulate a sufficiently large number of V l and V c events to provide a reliable description of these backgrounds in the analysis samples for which two b-tagged jets are required. An alternative procedure, parameterised tagging, is therefore used. Here, instead of directly tagging the c- and l-labelled jets with the MV1c algorithm, parameterisations
as functions of pT and |η| of their probabilities to be b-tagged are used for the V l, V c
and W W processes in all analysis samples in which two b-tagged jets are required. These parameterisations are, however, integrated over other variables that can affect the c- and light-jet tagging efficiencies. In particular, a strong dependence of these efficiencies is ob-served on ∆R, the angular separation from the closest other jet, and a significant difference is seen between direct and parameterised tagging for V cc events with ∆R < 1. No such difference is seen for V cl, V l and W W events. A dedicated correction, depending on ∆R, is therefore applied to the V cc events.
The missing transverse momentum vector ETmiss [65,66] is measured as the negative
vector sum of the transverse momenta associated with energy clusters in the calorimeters with |η| < 4.9. Corrections are applied to the energies of clusters associated with recon-structed objects (jets, electrons, τ leptons, and photons), using the calibrations of these objects. The transverse momenta of reconstructed muons are included, with the energy deposited by these muons in the calorimeters properly removed to avoid double-counting.
In addition, a track-based missing transverse momentum vector, pmissT , is calculated as the
negative vector sum of the transverse momenta of tracks with |η| < 2.4 associated with the primary vertex.
Additional corrections are applied to the simulation to account for small differences from data for trigger efficiencies, for lepton reconstruction and identification efficiencies, as well as for lepton energy and momentum resolutions.
5 Event selection
In this section, the event selection applied in the analysis of the 8 TeV data is presented.
Differences in the analysis of the 7 TeV data are reported in section10.
The analysis is optimised for a Higgs boson mass of 125 GeV. Events are first cate-gorised according to the numbers of leptons, jets, and b-tagged jets.
JHEP01(2015)069
Events containing no loose leptons are assigned to the 0-lepton channel. Events con-taining one tight lepton and no additional loose leptons are assigned to the 1-lepton channel. Events containing one medium lepton and one additional loose lepton of the same flavour, and no other loose leptons, are assigned to the 2-lepton channel. In the 1- and 2-lepton channels, for at least one of the lepton triggers by which the event was selected, the objects that satisfied the trigger are required to be associated with the selected leptons.
The jets used in this analysis, called “selected jets”, must have pT > 20 GeV and
|η| < 2.5, the η range within which b-tagging can be applied. There must be exactly two
or three such selected jets. Events containing an additional jet with pT > 30 GeV and
|η| > 2.5 are discarded to reduce the tt background. Only selected jets are considered further, e.g., to define the jet multiplicity, or to calculate kinematic variables.
The b-tagging algorithm is applied to all selected jets. There must be no more than two
such jets loosely b-tagged, and 3-jet events in which the lowest-pT jet is loosely b-tagged
are discarded. At least one of the two b-tagged jets must have pT > 45 GeV. The following
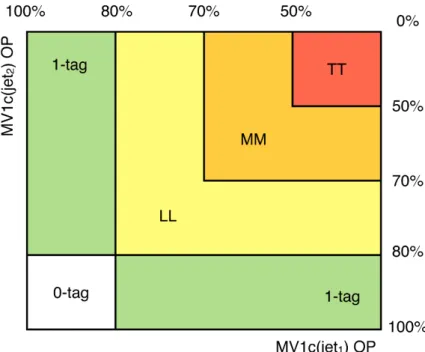
b-tagging categories are then defined as shown in figure1. Events with two jets satisfying
the tight b-tagging criterion form the TT (or Tight) category; those not classified as TT, but with two jets satisfying the medium b-tagging criterion, form the MM (or Medium) category; those not classified as TT or MM, but with two jets satisfying the loose b-tagging criterion, form the LL (or Loose) category. This categorisation improves the sensitivity with respect to what would be obtained using a single category, such as TT+MM, with the LL category providing constraints on the backgrounds not containing two real b-jets. Events with exactly one jet loosely b-tagged form the 1-tag category, and those with no loosely b-tagged jet form the 0-tag category. In the 3-jet categories, the dijet system is formed by the two b-tagged jets in any of the 2-tag categories, by the b-tagged jet and
the leading (highest-pT) non-b-tagged jet for events in the 1-tag category, and by the two
leading jets in the 0-tag category.
Additional topological and kinematic criteria are applied to reject background events
and enhance the sensitivity of the search. They are outlined in table2and detailed below.
In general, the selection criteria are looser in the MVA than in the dijet-mass analysis in order to maximise the information available to the final discriminant.
Further categorisation is performed according to the transverse momentum of the
vector boson, pV
T, to take advantage of the better signal-to-background ratio at high pVT.
The transverse momentum of the vector boson is reconstructed as the ETmissin the 0-lepton
channel, the magnitude pWT of the vector sum of the lepton transverse momentum and the
Emiss
T in the 1-lepton channel, and the magnitude pZT of the vector sum of the transverse
momenta of the two leptons in the 2-lepton channel. In the dijet-mass analysis, the events
are categorised in five pVT intervals, with boundaries at 0, 90, 120, 160, and 200 GeV. In the
0-lepton channel and for events fulfilling the condition onP pjeti
T mentioned in table2, the
ETmiss trigger is fully efficient for ETmiss> 160 GeV, 97% efficient for ETmiss= 120 GeV, and
80% efficient for ETmiss = 100 GeV, with an efficiency that decreases rapidly for lower EmissT .
Only four intervals are therefore used in the 0-lepton channel, with a minimum EmissT value
of 100 GeV. In the 1-muon sub-channel, the ETmiss trigger is used for pWT > 120 GeV to
JHEP01(2015)069
Figure 1. Event classification as a function of the output of the MV1c b-tagging algorithm for the two highest pT jets. The bin boundaries denote the operating points (MV1c(jet) OP) as defined in section4, corresponding to b-tagging efficiencies of 100%, 80%, 70%, 50%, i.e., the b-jet purity increases from left (bottom) to right (top). The event categories are 0-tag, 1-tag, and TT, MM and LL for 2-tag, as explained in the text.
in this channel by 8%. In the MVA, only two intervals are defined, with pVT below or above
120 GeV, but the detailed pVT information is used in the final discriminant.
In the dijet-mass analysis, requirements are applied to the angular separation between
the two jets of the dijet system, ∆R(jet1, jet2), which depend on the pVT interval. The
requirement on the minimum value reduces the background from V +jet production, while the requirement on the maximum value, which reduces the background from tt production,
is tightened with increasing pVT to take advantage of the increasing collimation of the dijet
system for the signal. To increase the signal acceptance, the requirement on the minimum
value is removed in the highest pVT interval, where the amount of background is smallest.
In the MVA, where the ∆R(jet1, jet2) information is used in the final discriminant, only a
minimum value is required, a requirement which is also removed for pVT > 200 GeV.
In the 0-lepton channel, the multijet (MJ) background is suppressed by imposing
requirements on the magnitude pmissT of the track-based missing transverse momentum
vector pmissT , the azimuthal angle between ETmiss and pmissT , ∆φ(ETmiss, pmissT ), the
az-imuthal angle between ETmiss and the nearest jet, min[∆φ(ETmiss, jet)], and the azimuthal
angle between ETmiss and the dijet system, ∆φ(ETmiss, dijet). In addition, a minimum
value is required for the scalar sum of the jet transverse momenta,P pjeti
T , which depends
on the jet multiplicity. Additional requirements are applied in the lowest pVT interval of
the 0-lepton channel, where the MJ background is largest: Njet = 2; ETmiss > 100 GeV;
be-JHEP01(2015)069
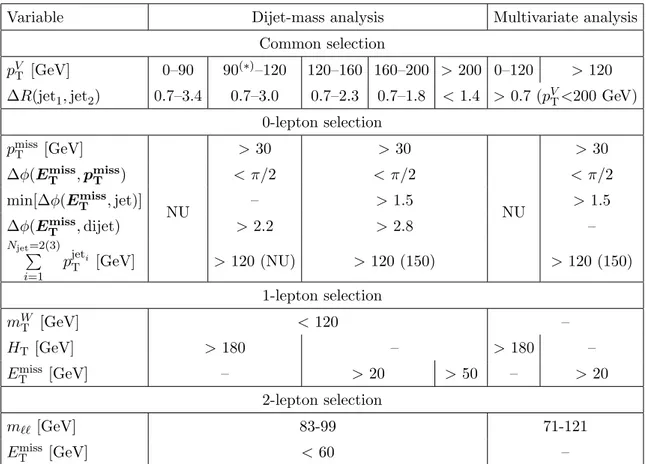
Variable Dijet-mass analysis Multivariate analysis
Common selection
pVT [GeV] 0–90 90(∗)–120 120–160 160–200 > 200 0–120 > 120
∆R(jet1, jet2) 0.7–3.4 0.7–3.0 0.7–2.3 0.7–1.8 < 1.4 > 0.7 (pVT<200 GeV)
0-lepton selection pmiss T [GeV] NU > 30 > 30 NU > 30 ∆φ(Emiss T , pmissT ) < π/2 < π/2 < π/2
min[∆φ(ETmiss, jet)] – > 1.5 > 1.5
∆φ(ETmiss, dijet) > 2.2 > 2.8 –
Njet=2(3) P i=1 pjeti T [GeV] > 120 (NU) > 120 (150) > 120 (150) 1-lepton selection mWT [GeV] < 120 – HT [GeV] > 180 – > 180 – ETmiss [GeV] – > 20 > 50 – > 20 2-lepton selection m`` [GeV] 83-99 71-121 ETmiss [GeV] < 60 –
Table 2. Event topological and kinematic selections. NU stands for ‘Not Used’. (∗) In the 0-lepton channel, the lower edge of the second pV
T interval is set at 100 GeV instead of 90 GeV. For the 1-lepton channel, only the 1-muon sub-channel is used in the pV
T < 120 GeV intervals.
tween the two jets, S is the ETmiss significance, defined as the ratio of ETmiss to the square
root of P pjeti
T ; and L is a likelihood ratio constructed to discriminate further against the
MJ background.2
In the 1-lepton channel, a requirement is imposed on the transverse mass3 mWT in the
dijet-mass analysis. This requirement reduces the contamination from the tt background.
Requirements are also imposed on HT (ETmiss) for pVT < (>)120 GeV, where HT is the
scalar sum of ETmiss and the transverse momenta of the two leading jets and the lepton.
This mainly reduces the MJ background. As discussed in section 7.1, the MJ background
is difficult to model and remains substantial in the 1-electron sub-channel in the pVT <
120 GeV intervals. Therefore, only the 1-muon sub-channel is used in these intervals.
In the 2-lepton channel, criteria are imposed on the dilepton invariant mass, m``, which
2
The likelihood ratio uses the following inputs: ∆φ(ETmiss, dijet); ∆φ(jet1, jet2); the magnitude of the
vector sum of the two jet transverse momenta, HTmiss; H miss
T divided byP p jeti
T ; and the cosine of the helicity
angle in the dijet rest frame as defined in ref. [67]. For the MJ background, the probability density functions used in the likelihood ratio are constructed from data events selected with ∆φ(EmissT , p
miss
T ) > π/2. 3The transverse mass mW
T is calculated from the transverse momentum and the azimuthal angle of the
charged lepton, p`
T and φ`, and from the missing transverse momentum magnitude, EmissT , and azimuthal
angle, φmiss: mW
JHEP01(2015)069
must be consistent with the mass of the Z boson. In the dijet-mass analysis a requirement
is imposed on ETmiss; this variable is used in the final discriminant of the MVA.
For events in which two jets are loosely b-tagged, these selection criteria define a set of
“2-tag signal regions”, categorised in terms of channel (0, 1, or 2 leptons), pV
T interval, and
jet multiplicity (2 or 3). In the dijet-mass analysis, a further division is performed into the TT, MM and LL b-tagging categories. In the MVA, where the b-tagging information is used in the final discriminant, a similar subdivision is performed with the difference that the TT and MM categories are merged in the 0- and 2-lepton channels. Similarly defined 1-tag and 0-tag “control regions” are used in the analysis to constrain the main backgrounds. In the 1-lepton channel, the 2-tag signal regions with a third selected jet act in practice as control regions because they are largely dominated by tt events. All 2-tag signal and
1-tag control regions are used simultaneously in the global fit (described in section9) used
to extract the results. The 0-tag control regions are used only for background modelling
studies (reported in section 7).
After event selection, the energy calibration of the b-tagged jets is improved as follows. The energy from muons within a jet is added to the calorimeter-based jet energy after removing the energy deposited by the muon in the calorimeter (muon-in-jet correction), and
a pT-dependent correction is applied to account for biases in the response due to resolution
effects (resolution correction). This latter correction is determined for the pT spectrum of
jets from the decay of a Higgs boson with mH = 125 GeV in simulated (W/Z)H events.
The dijet mass resolution for the signal is improved by 14% after these corrections and is
typically 11% (figure2(a)). In the 2-lepton channel, wherein there is no true ETmissinvolved
except possibly from semileptonic heavy-flavour decays, the energy calibration of the jets is further improved by a kinematic likelihood fit, which includes a Breit-Wigner constraint on the dilepton mass, Gaussian constraints on each of the transverse components of the ``bb system momentum (with a width of 9 GeV, as determined from ZH simulated events), dedicated transfer functions relating the true jet transverse momenta to their reconstructed values (after the muon-in-jet correction, but without the resolution correction) as well as
a prior built from the expected true jet pT spectrum in ZH events (playing a role similar
to the resolution correction). Overall, the bb mass resolution is improved by 30% in the
2-lepton channel (figure2(b)).
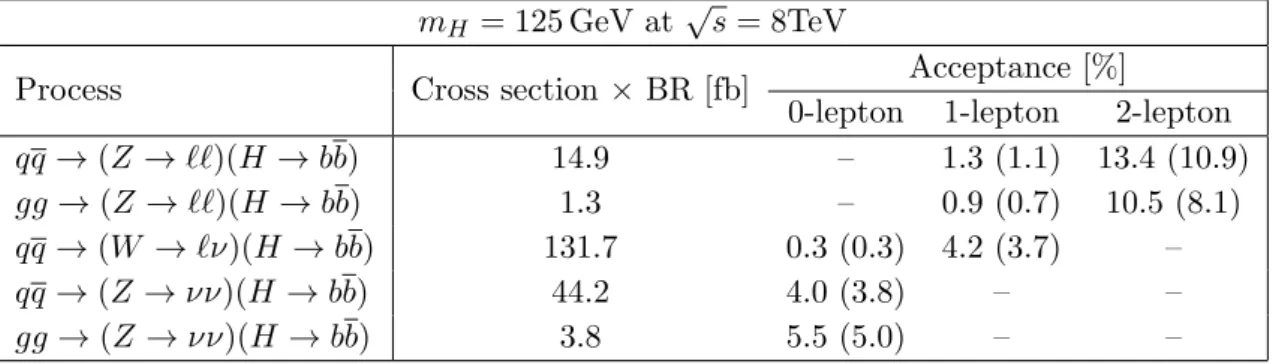
The cross sections times branching ratios for (W/Z)H with W → `ν, Z → ``, Z → νν, and H → bb, as well as the acceptances in the three channels after full selection are given in
table3for the MVA and the dijet-mass analysis. The acceptance for other production and
decay modes of the Higgs boson is negligible. The 0-lepton channel adds 7% in acceptance for the W → `ν process with respect to the 1-lepton channel. Similarly, the 1-lepton channel adds 10% in acceptance for the Z → `` process with respect to the 2-lepton channel.
JHEP01(2015)069
[GeV] bb m 0 20 40 60 80 100 120 140 160 180 200 Events / 4.0 GeV 0 0.02 0.04 0.06 0.08 0.1Global Sequential Calib. (GSC) + Muon-in-Jet Correction + Resolution Correction 16.4 GeV --14.4 GeV 12% 14.1 GeV 14% GSC σ )/ σ -GSC σ Resolutions ( ATLAS Simulation MC b b → Pythia VH, H 2 lep., 2 jets, 2 b-tags
inclusive V T p (a) [GeV] bb m 0 20 40 60 80 100 120 140 160 180 200 Events / 4.0 GeV 0 0.02 0.04 0.06 0.08 0.1
Global Sequential Calib. (GSC) + Kinematic Likelihood Fit + Muon-in-Jet Correction 16.4 GeV --11.4 GeV 30% GSC σ )/ σ -GSC σ Resolutions ( ATLAS Simulation MC b b → Pythia VH, H 2 lep., 2 jets, 2 b-tags
inclusive V T p
(b)
Figure 2. Dijet-invariant-mass distribution for the decay products of a Higgs boson with mH = 125 GeV in the 2-lepton MVA selection. The distributions are shown (a) using jets after global sequential calibration (GSC, solid), and after adding muons inside jets (dotted) and after correcting for resolution effects specific to the kinematics of the decay of a Higgs boson with mH = 125 GeV (dash-dotted); (b) using jets after global sequential calibration (GSC, solid), and after adding muons inside jets and applying the kinematic fit (dash-dotted). The distributions are fit to the Bukin function [68] and the parameter representing the width of the core of the distribution is shown in the figures, as well as the relative improvement in the resolution with respect to jets after the global sequential calibration.
mH = 125 GeV at
√
s = 8TeV
Process Cross section × BR [fb] Acceptance [%]
0-lepton 1-lepton 2-lepton
qq → (Z → ``)(H → bb) 14.9 – 1.3 (1.1) 13.4 (10.9)
gg → (Z → ``)(H → bb) 1.3 – 0.9 (0.7) 10.5 (8.1)
qq → (W → `ν)(H → bb) 131.7 0.3 (0.3) 4.2 (3.7) –
qq → (Z → νν)(H → bb) 44.2 4.0 (3.8) – –
gg → (Z → νν)(H → bb) 3.8 5.5 (5.0) – –
Table 3. The cross section times branching ratio (BR) and acceptance for the three channels at 8 TeV. For ZH, the qq- and gg-initiated processes are shown separately. The branching ratios are calculated considering only decays to muons and electrons for Z → ``, decays to all three lepton flavours for W → `ν and decays to neutrinos for Z → νν. The acceptance is calculated as the fraction of events remaining in the combined 2-tag signal regions of the MVA (dijet-mass analysis) after the full event selection.
JHEP01(2015)069
6 Multivariate analysis
Although the dijet mass is the kinematic variable that provides the best discrimination between signal and backgrounds, the sensitivity of the search is improved by making use of additional kinematic, topological and b-tagging properties of the selected events in a
multi-variate analysis. The Boosted Decision Tree (BDT) technique [69,70] is used, which,
sim-ilarly to other multivariate methods, properly accounts for correlations between variables. Dedicated BDTs are constructed, trained and evaluated in each of the 0-, 1- and 2-lepton channels in the 2-tag regions (with the LL, MM and TT categories combined) and separately for the events with two and three jets. In the 0-lepton channel, only events with
pVT > 120 GeV are used, whereas for the 1- and 2-lepton channels individual BDTs are
used for pV
T < 120 GeV and pVT > 120 GeV. Events in the electron and muon sub-channels
are combined since none of the variables used are lepton-flavour specific. In the 0-lepton
channel, the final results are obtained using the MVA for pVT > 120 GeV. For the small
100 < pV
T < 120 GeV interval, which has reduced sensitivity, no dedicated BDT is trained
and only the dijet-mass distribution is used.
The BDTs are trained to separate the (V H, H → bb) signal from the sum of the expected background processes. The input variables used to construct the BDTs are chosen in order to maximise the separation, while avoiding the use of variables not improving the performance significantly. Starting from the dijet mass, additional variables are tried one at a time and the one yielding the best separation gain is kept. This procedure is repeated until adding more variables does not result in a significant performance gain. The final sets
of variables for the different channels are listed in table4. The b-tagged jets belonging to the
dijet system (with mass denoted mbb) are labelled in decreasing pT as b1 and b2, and their
separation in pseudorapidity is |∆η(b1, b2)|. The b-tagging information is provided by the
outputs of the MV1c neural network, M V 1c(b1) and M V 1c(b2). The angular separation,
in the transverse plane, of the vector boson and the dijet system of b-tagged jets and their pseudorapidity separation are denoted ∆φ(V, bb) and |∆η(V, bb)|, respectively. In the
0-lepton channel, HT is defined as the scalar sum of the transverse momenta of all jets and
ETmiss. In the 1-lepton channel, the angle between the lepton and the closest b-tagged jet
in the transverse plane is denoted min[∆φ(`, b)]. The other variables were defined in the
previous sections. In 3-jet events, the third jet is labelled as jet3 and the mass of the 3-jet
system is denoted mbbj.
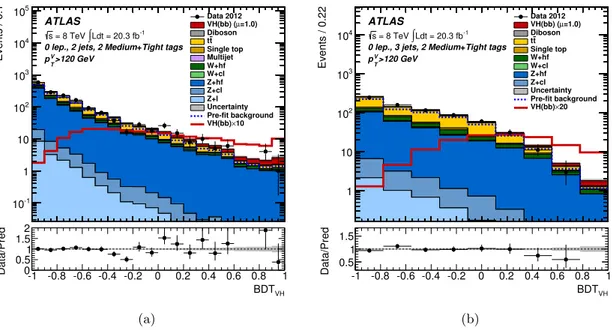
The input variables of the BDTs are compared between data and simulation, and good agreement is found within the assessed uncertainties. Selected input-variable distributions
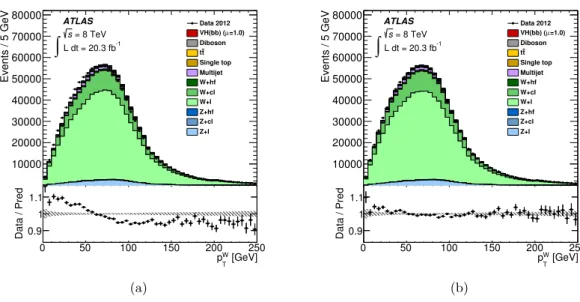
are shown in figure 3.4 In this figure, as for all figures in this section, the MJ background
is estimated as described in section7.1, corrections to the simulation as explained in
sec-tion7.2are applied, and background normalisations and shapes are adjusted by the global
fit of the MVA as outlined at the beginning of section 7 and presented in more detail in
section 9. A similarly good agreement is found for the correlations between pairs of input
variables, as can be seen in figure 4.
4In this and all similar figures, all backgrounds are taken into account, but those contributing less than
JHEP01(2015)069
Variable 0-Lepton 1-Lepton 2-Lepton
pVT × × Emiss T × × × pb1 T × × × pb2 T × × × mbb × × × ∆R(b1, b2) × × × |∆η(b1, b2)| × × ∆φ(V, bb) × × × |∆η(V, bb)| × HT × min[∆φ(`, b)] × mWT × m`` × M V 1c(b1) × × × M V 1c(b2) × × ×
Only in 3-jet events pjet3
T × × ×
mbbj × × ×
Table 4. Variables used in the multivariate analysis for the 0-, 1- and 2-lepton channels.
The Toolkit for Multivariate Data Analysis, TMVA [71], is used to train the BDTs.
The values for the training parameters are found by determining the configuration with the best separation between signal and background in a coarsely binned multi-dimensional training parameter space, followed by more finely grained one-dimensional scans of individ-ual training parameters. In order to make use of the complete set of simulated MC events for the BDT training and evaluation in an unbiased way, the MC events are split into two samples of equal size, A and B. The performance of the BDTs trained on sample A (B) is evaluated with sample B (A) in order to avoid using identical events for both training and evaluation of the same BDT. Half of the data are analysed with the BDTs trained on sample A, and the other half with the BDTs trained on sample B. At the end, the output distributions of the BDTs trained on samples A and B are merged for both the simulated and data events.
The values of the BDT outputs do not have a well-defined interpretation. A dedicated procedure is applied to transform the BDT-output distributions to obtain a smoother dis-tribution for the background processes and a finer binning in the regions with the largest signal contribution, while at the same time preserving a sufficiently large number of back-ground events in each bin. Starting from a very fine-binned histogram of the BDT-output distribution, the procedure merges histogram bins, from high to low BDT-output values, until a certain requirement, based on the fractions of signal and background events in the merged bin, is satisfied. To limit the number of bins and to reduce the impact of sta-tistical fluctuations, a further condition is that the stasta-tistical uncertainty of the expected
JHEP01(2015)069
0 50 100 150 200 250 300 350 400 450 500 Events / 25 GeV 600 400 200 800 1000 Data 2012 =1.0)µVH(bb) ( Diboson tt Single top Multijet W+hf W+cl W+l Z+hf Z+cl Z+l Uncertainty Pre-fit background
10× VH(bb) ATLAS -1 Ldt = 20.3 fb∫ = 8 TeV
s 0 lep., 2 jets, 2 tags V>120 GeVT
p [GeV] bb m 0 50 100 150 200 250 300 350 400 450 500 Data/Pred 0.5 1 1.5 (a) 0 50 100 150 200 250 300 350 400 450 500 Events / 20 GeV 1200 1000 800 600 400 200 1400 1600 1800 Data 2012 =1.0)µ
VH(bb) ( Diboson tt Single top Multijet W+hf W+cl W+l Z+hf Z+cl Z+l Uncertainty Pre-fit background
50× VH(bb) ATLAS -1 Ldt = 20.3 fb∫ = 8 TeV
s 0 lep., 2 jets, 2 tags V>120 GeVT
p [GeV] miss T E 0 50 100 150 200 250 300 350 400 450 500 Data/Pred 0.5 1 1.5 (b) 0 0.5 1 1.5 2 2.5 3 3.5 4 4.5 5 Events / 0.2 600 500 400 300 200 100 700 800 900 Data 2012 =1.0)µ
VH(bb) ( Diboson tt Single top Multijet W+hf W+cl W+l Z+hf Uncertainty Pre-fit background
50× VH(bb) ATLAS -1 Ldt = 20.3 fb∫ = 8 TeV
s 1 lep., 2 jets, 2 tags V>120 GeVT
p )2 ,b1 R(b∆ 0 0.5 1 1.5 2 2.5 3 3.5 4 4.5 5 Data/Pred 0 0.5 1 1.5 2 (c) 0 50 100 150 200 250 300 350 400 450 500 Events / 20 GeV 2500 2000 1500 1000 500 3000 3500 4000 4500 Data 2012 =1.0)µ
VH(bb) ( Diboson tt Single top Multijet W+hf W+cl W+l Z+hf Uncertainty Pre-fit background
90× VH(bb) ATLAS -1 Ldt = 20.3 fb∫ = 8 TeV
s 1 lep., 2 jets, 2 tags V>120 GeVT
p [GeV] V T p 0 50 100 150 200 250 300 350 400 450 500 Data/Pred 0.5 1 1.5 (d) 50 100 150 200 250 300 350 400 Events / 20 GeV 50 100 150 200 250 300 Data 2012 =1.0)µ
VH(bb) ( Diboson tt Single top Z+hf Z+cl Z+l Uncertainty Pre-fit background
60× VH(bb) ATLAS -1 Ldt = 20.3 fb∫ = 8 TeV
s 2 lep., 2 jets, 2 tags V>120 GeVT
p ) [GeV] 1 (b T p 50 100 150 200 250 300 350 400 Data/Pred 0.5 1 1.5 (e) 0 0.5 1 1.5 2 2.5 3 3.5 4 4.5 5 Events / 0.2 50 100 150 200 250 Data 2012 =1.0)µ
VH(bb) ( Diboson tt Single top Z+hf Z+cl Z+l Uncertainty Pre-fit background
60× VH(bb) ATLAS -1 Ldt = 20.3 fb∫ = 8 TeV
s 2 lep., 2 jets, 2 tags V>120 GeVT
p (V,bb)η ∆ 0 0.5 1 1.5 2 2.5 3 3.5 4 4.5 5 Data/Pred 0.5 1 1.5 (f ) Figure 3 . Examples of v ariables input to the BDT in the 2-jet 2-tag category (LL, MM and TT com bined) for p V T > 120 Ge V : (a) 0-lepton channel, dijet mass; (b) 0-lepton channel, E miss T ; (c) 1-lepton channel, ∆ R (b1 , b2 ); (d) 1-lepton channel, p W T ; (e) 2-lepton channel, p b1 T ; (f ) 2-lepton channel, |∆ η (V ,bb )| . The distributions for the 2-lepton channel in (e) and (f ) are sho wn after ha ving applied the kinematic fit as describ ed in section 5 . The bac kground con tributions after the global fit of the MV A are sho wn as filled histograms. The Higgs b oson signal (m H = 125 GeV) is sho wn as a filled histogram on top of the fitted bac kgrounds, as exp ected from the SM (indicated as µ = 1 .0), and, unstac k ed as an unfilled histogram, scaled b y the factor indicated in the legend. The dashed histogram sho ws the total bac kground as exp ected from the pre-fit MC sim ulation. The en tries in o v erflo w are included in the last bin. The size of the com bined statistical and systematic uncertain ty on the sum of the signal and fitted bac kground is indicated b y the hatc hed band. The ratio of the data to th e sum of th e signal and fitted bac kground is sh o wn in the lo w er panel.
JHEP01(2015)069
)
2,b
1R(b∆
0 1 2 3 4 5[GeV]
bbm
0 50 100 150 200 250 300 350 400 450 500Events
0 10 20 30 40 50 60 Data 2012 MCATLAS
-1 Ldt = 20.3 fb∫
= 8 TeV s 0-lepton > 120 GeV V T 2 tags, 2 jets, p (a) )2 ,b1 R(b∆ 0 0.5 1 1.5 2 2.5 3 3.5 4 4.5 5 [GeV] bb m 0 100 200 300 400 500 600 700 ATLAS = 8 TeV s -1 Ldt = 20.3 fb∫ > 120 GeV V T0-lepton, 2 tags, 2 jets, p
MC: mean RMS Data 2012: mean RMS (b) [GeV] bb m 0 50 100 150 200 250 300 350 400 450 500 ) 2 ,b 1 R(b ∆ 0 1 2 3 4 5 ATLAS = 8 TeV s -1 Ldt = 20.3 fb∫ > 120 GeV V T
0-lepton, 2 tags, 2 jets, p
MC: mean RMS Data 2012: mean RMS (c) Figure 4 . Correlations b et w een the dijet mass and ∆ R (b1 , b2 ) input v ariables to the BDT in the 2-jet 2-tag category (LL, MM and TT com bined) of the 0-lepton channel for p V T > 120 Ge V : (a) d ijet mass v ersus ∆ R (b1 , b2 ) for the total exp ected bac kground (shadi ngs indicating the n um b ers of ev en ts) and the data (op en b o xes with the b o x size b eing p rop ortional to the n um b er of ev en ts ), (b) and (c) sho w the mean v alues and RMS of the pro jec ti ons on to the ∆ R (b1 , b2 ) and dijet-mass axes, re sp ectiv ely , for the total exp ected bac kgroun d after the global fit of the MV A and the data.
JHEP01(2015)069
total background contribution has to be smaller than 10% in each merged bin. The free parameters of the transformation algorithm are optimised to maximise the expected signal sensitivity. For simplicity, these transformed outputs, which are used for the analysis, are
called “BDTV H discriminants” in the following. An optimisation of the number of bins and
bin boundaries is also performed for the mbb distribution used in the dijet-mass analysis
in a similar way, where the free parameters of the transformation algorithm are optimised separately for the different analysis regions. The effect of the transformation on the
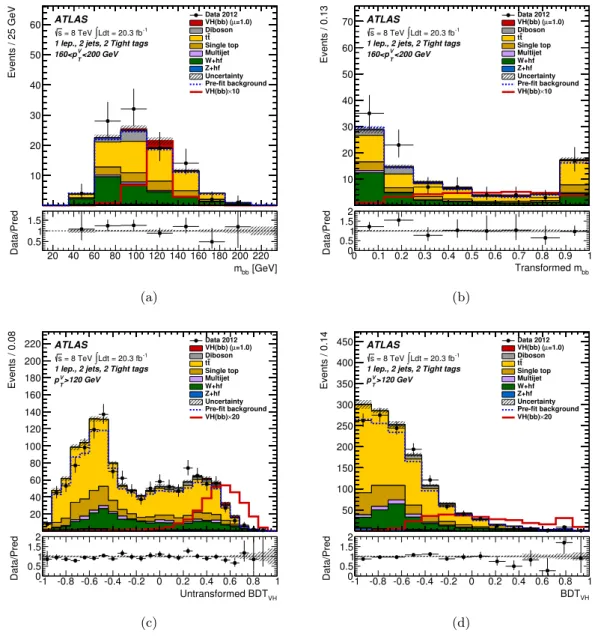
BDT-output and dijet-mass distributions can be seen in figure5for the 1-lepton channel and one
signal region. The transformation groups into few bins the mbb regions that are far from
the signal on each of the low and high mass sides, while it expands the region close to the signal mass, where the signal-to-background ratio is largest. The effect on the BDT out-put is similar, but simpler to visualise because the signal and the background accumulate initially on the high and the low sides of the distribution, respectively.
Correlations between input variables and the BDTV H discriminant can provide
in-formation on the impact of individual variables on the classification. Figure6 shows such
correlations for the dijet mass, which is the BDT input that provides the best single-variable discriminating power.
JHEP01(2015)069
20 40 60 80 100 120 140 160 180 200 220 Events / 25 GeV 10 20 30 40 50 60 Data 2012 =1.0) µ VH(bb) ( Diboson t t Single top Multijet W+hf Z+hf Uncertainty Pre-fit background 10 × VH(bb) ATLAS -1 Ldt = 20.3 fb ∫ = 8 TeV s1 lep., 2 jets, 2 Tight tags <200 GeV V T 160<p [GeV] bb m 20 40 60 80 100 120 140 160 180 200 220 Data/Pred 0.5 1 1.5 (a) 0 0.1 0.2 0.3 0.4 0.5 0.6 0.7 0.8 0.9 1 Events / 0.13 10 20 30 40 50 60 70 Data 2012VH(bb) (µ=1.0) Diboson t t Single top Multijet W+hf Z+hf Uncertainty Pre-fit background 10 × VH(bb) ATLAS -1 Ldt = 20.3 fb ∫ = 8 TeV s
1 lep., 2 jets, 2 Tight tags <200 GeV V T 160<p bb Transformed m 0 0.1 0.2 0.3 0.4 0.5 0.6 0.7 0.8 0.9 1 Data/Pred 0 0.51 1.5 2 (b) -1 -0.8 -0.6 -0.4 -0.2 0 0.2 0.4 0.6 0.8 1 Events / 0.08 20 40 60 80 100 120 140 160 180 200 220 Data 2012VH(bb) (µ=1.0) Diboson t t Single top Multijet W+hf Z+hf Uncertainty Pre-fit background 20 × VH(bb) ATLAS -1 Ldt = 20.3 fb ∫ = 8 TeV s
1 lep., 2 jets, 2 Tight tags >120 GeV V T p VH Untransformed BDT -1 -0.8 -0.6 -0.4 -0.2 0 0.2 0.4 0.6 0.8 1 Data/Pred 0 0.5 1 1.5 2 (c) -1 -0.8 -0.6 -0.4 -0.2 0 0.2 0.4 0.6 0.8 1 Events / 0.14 50 100 150 200 250 300 350 400 450 Data 2012 =1.0) µ VH(bb) ( Diboson t t Single top Multijet W+hf Z+hf Uncertainty Pre-fit background 20 × VH(bb) ATLAS -1 Ldt = 20.3 fb ∫ = 8 TeV s
1 lep., 2 jets, 2 Tight tags >120 GeV V T p VH BDT -1 -0.8 -0.6 -0.4 -0.2 0 0.2 0.4 0.6 0.8 1 Data/Pred 0 0.5 1 1.5 2 (d)
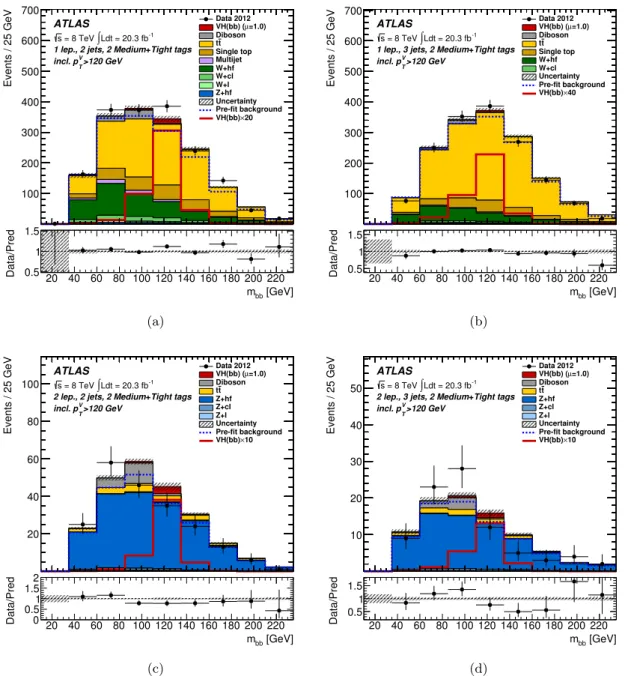
Figure 5. Top: the dijet-mass distributions for the expected background and signal contributions in the 1-lepton channel and the 2-jet 2-tag TT category for 160 GeV < pW
T ≤ 200 GeV (a) before and (b) after applying the transformation of the histogram bins. Bottom: the BDT-output distribution for the expected background and signal contributions in the 1-lepton channel and the 2-jet 2-tag TT category for pW
T > 120 GeV (c) before and (d) after applying the transformation of the histogram bins. The background contributions after the relevant global fit (of the dijet-mass analysis in (a) and (b) and of the MVA in (c) and (d)) are shown as filled histograms. The Higgs boson signal (mH = 125 GeV) is shown as a filled histogram on top of the fitted backgrounds, as expected from the SM (indicated as µ = 1.0), and, unstacked as an unfilled histogram, scaled by the factor indicated in the legend. The dashed histogram shows the total background as expected from the pre-fit MC simulation. The entries in overflow are included in the last bin. The size of the combined statistical and systematic uncertainty on the sum of the signal and fitted background is indicated by the hatched band. The ratio of the data to the sum of the signal and fitted background is shown in the lower panel.
JHEP01(2015)069
VHBDT
-1 -0.8 -0.6 -0.4 -0.2 0 0.2 0.4 0.6 0.8 1[GeV]
bbm
0 50 100 150 200 250 300 350 400 450 500Events
0 2 4 6 8 10 12 14 16 18 20 22 24 Data 2012 MCATLAS
-1 Ldt = 20.3 fb∫
= 8 TeV s 0-lepton > 120 GeV V T 2 tags, 2 jets, p (a) VH BDT -1 -0.8 -0.6 -0.4 -0.2 0 0.2 0.4 0.6 0.8 1 [GeV] bb m 0 100 200 300 400 500 ATLAS = 8 TeV s -1 Ldt = 20.3 fb∫ > 120 GeV V T0-lepton, 2 tags, 2 jets, p
MC: mean RMS Data 2012: mean RMS (b) [GeV] bb m 0 50 100 150 200 250 300 350 400 450 500 VH BDT -1 -0.5 0 0.5 1 ATLAS = 8 TeV s -1 Ldt = 20.3 fb∫ > 120 GeV V T
0-lepton, 2 tags, 2 jets, p
MC: mean RMS Data 2012: mean RMS (c) Figure 6 . Correlations b et w een the dijet mass and the BDT V H discriminan t in the 2-jet 2-tag category (LL, M M and TT com bined) of the 0-lepton channel for p V T > 120 GeV: (a) the dijet mass v ersus the BDT V H discriminan t for th e total exp ected b ac kground (shadings indicating the n um b ers of ev en ts) and the data (op en b o xes w ith the b o x size b eing prop ortional to the n um b er of ev en ts), (b) and (c) sho w the mean v alues and RMS of the pro jections on to the axes of the BDT V H discriminan t and dijet mass, resp ectiv ely , for the total exp ected bac kgrou nd after the global fit of the MV A and the data.
JHEP01(2015)069
7 Background composition and modelling
This section describes the modelling of individual backgrounds. In many cases, the data are able to constrain the normalisations and shapes better than the a priori estimates. A likelihood fit (also called “global fit”) is used to simultaneously extract both the signal yield and constraints on the background normalisations and shapes. The distributions used by
the fit are those of the dijet mass or BDTV H discriminant in the 2-tag signal regions, as
appropriate, as well as those of the M V 1c value of the b-tagged jet in the 1-tag control
regions. More details are provided in section 9.
For the multijet (MJ) backgrounds, the normalisations and shapes provided as inputs to the fit are estimated from data, as explained below. For the other backgrounds the inputs are taken from the simulation, except for the normalisations of the V +jets and tt backgrounds that are left free to float in the fit. The corrections to these two backgrounds, described below, are applied prior to the fit.
In all distributions presented in this section, unless otherwise specified, the normalisa-tions of the various backgrounds are those extracted from the global fit for the dijet-mass or multivariate analysis, as appropriate. The fit also adjusts the background shapes in those distributions within the constraints from the systematic uncertainties discussed in
section 8.
7.1 Multijet background
Multijet events are produced with a huge cross section via the strong interaction, and there-fore give rise to potentially large backgrounds. A first class of MJ background arises from jets or photon conversions misidentified as electrons, or from semileptonic heavy-flavour decays; the 1- and 2-lepton channels are especially sensitive to this class of background. Another class, which affects mostly the 0-lepton channel, arises from large fluctuations in
jet energy measurements in the calorimeters, which create “fake” ETmiss. These MJ
back-grounds cannot be determined reliably by simulation, and are estimated from data in each of the 0-, 1-, and 2-lepton channels, and in each of the 2- and 3-jet, 0-, 1-, and 2-tag regions. The MJ background is estimated in the 0-lepton channel using an “ABCD method”,
within which the data are divided into four regions based on the min[∆φ(ETmiss, jet)]
and ∆φ(Emiss
T , pmissT ) variables, such that three of the regions are dominated by
back-ground. (In the 100–120 GeV pVT interval, the likelihood ratio L designed to suppress the
MJ background is used instead of min[∆φ(ETmiss, jet)].) For events with real ETmiss, it
is expected that the directions of the calorimeter-based and track-based missing
trans-verse momenta, ETmiss and pmissT , are similar. In events with fake ETmiss arising from
a jet energy fluctuation, it is expected that the direction of ETmiss is close to the
di-rection of the poorly measured jet. The signal region (A) is therefore selected with
min[∆φ(ETmiss, jet)] > 1.5 and ∆φ(ETmiss, pmissT ) < π/2. In region C, the requirement on
∆φ(ETmiss, pmissT ) is reversed. In regions B and D, min[∆φ(ETmiss, jet)] < 0.4 is required,
with requirements on ∆φ(ETmiss, pmissT ) as in regions A and C, respectively. A comparison
of the min[∆φ(ETmiss, jet)] distributions for ∆φ(ETmiss, pmissT ) above and below π/2 shows
JHEP01(2015)069
multijet event sample simulated with pythia8. An MJ template in region A is obtained using events in region C after subtracting the contribution of other backgrounds, taken from simulation. The template is normalised by the ratio of the number of events in region B to that in region D, again after subtracting other backgrounds from those regions. The populations of events in the various regions suffer from low statistical precision after the 2-tag requirement. The b-tagging requirement is therefore dropped in regions B, C and D, and an additional b-tagging normalisation factor is applied to the resulting template, taken as the fraction of 2-tag events in region D. The MJ background in the signal regions is found to amount to ∼ 1% of the total background.
In the 1-lepton channel, the MJ background is determined separately for the electron and muon sub-channels. For each signal or control region, an MJ-background template is obtained in an MJ-dominated region after subtracting the small remaining contribution from the other backgrounds. The other backgrounds are taken from a simulation improved by scale factors for the various contributions obtained from a preliminary global fit. The MJ-dominated region is obtained by modifying the nominal selection to use medium, in-stead of tight, leptons and loosening both the track and calorimeter-based isolation criteria. The track-based isolation is changed to the intervals 5%–12% and 7%–50% for electrons and muons respectively, instead of < 4%; and the calorimeter-based isolation is loosened to < 7% from < 4%. The sample sizes of the MJ-templates are however rather low in the 2-tag regions. Since it is observed that the kinematic properties of the 1-tag and 2-tag events in the MJ-dominated regions are similar, 1-tag events are used to enrich the 2-tag MJ templates. Events in the 1-tag category are promoted to the 2-tag category by as-signing to the untagged jet an emulated M V 1c value drawn from the appropriate M V 1c distribution observed in the corresponding 2-tag MJ template. This distribution depends on the rank (leading or sub-leading) of the untagged jet and on the M V 1c value of the tagged jet. To cope with residual differences observed in some distributions between these pseudo-2-tag MJ events and the actual 2-tag MJ events, a reweighting is applied according
to the M V 1c of the tagged jet and, for the electron sub-channel, according to ∆R(jet1, jet2)
and pWT. This procedure is applied in each of the 2- and 3-jet, LL, MM and TT categories.
The normalisations of the MJ templates are then obtained from “multijet fits” to the ETmiss
distributions in the 2- and 3-jet, 1- and 2-tag (LL, MM and TT combined) categories, with floating normalisations for the templates of the other background processes. The templates for these other background processes are taken from the improved simulation mentioned above.
The MJ background in the 1-lepton channel is concentrated at low pW
T, and in the
2-jet 2-tag sample with pWT < 120 GeV it ranges from 11% of the total background in the
LL category to 6% in the TT category. The main purpose of including the pWT < 120 GeV
intervals is to provide constraints on the largest backgrounds (V +jets and tt) in the global
fit. Since the MJ background is twice as large for pWT < 120 GeV in the 1-electron
sub-channel than in the 1-muon sub-sub-channel, only the 1-muon sub-sub-channel is kept for pWT <
120 GeV so as to provide the most reliable constraints on the non-MJ backgrounds. The
resulting loss in sensitivity is 0.6%. For pWT > 120 GeV, the MJ background is much